Article Text

Abstract
Objective To examine whether confidence in primary healthcare (PHC) differs among ethnic–linguistic groups and which PHC experiences are associated with confidence.
Design A cross-sectional study where patient surveys were administered using random digit dialling. Regression models identify whether ethnic–linguistic group remains significantly associated with confidence in PHC.
Setting British Columbia, Canada.
Main outcome measures Confidence in PHC measured using a 0–10 scale, where a higher score indicates increased confidence in the ability to get needed PHC services.
Participants Community-dwelling adults in the following ethnic–linguistic groups: English-speaking Chinese, Chinese-speaking Chinese, English-speaking South Asians, Punjabi-speaking South Asians and English-speakers of presumed European descent.
Findings Based on a sample of 1211 respondents, confidence in PHC differed by ethnicity and the ability to speak English. Most of the differences in confidence by ethnic–linguistic group can be explained by various aspects of care experience. Patient experiences associated with lower confidence in PHC were: if care was received outside Canada, having to wait months to see their regular doctor and rating the quality of healthcare as good or fair/poor. Better patient experiences of their doctor being concerned about their feelings and being respectful and if they found wait times acceptable were associated with higher levels of confidence in PHC. The final regression model explained 30% of the variance.
Conclusions Improving the delivery of PHC services through positive interactions between patients and their usual provider and acceptability of wait times are examples of how the PHC system can be strengthened.
- Primary Care
- Health Services Administration & Management
This is an Open Access article distributed in accordance with the Creative Commons Attribution Non Commercial (CC BY-NC 3.0) license, which permits others to distribute, remix, adapt, build upon this work non-commercially, and license their derivative works on different terms, provided the original work is properly cited and the use is non-commercial. See: http://creativecommons.org/licenses/by-nc/3.0/
Statistics from Altmetric.com
Strengths and limitations of this study
-
Having the survey available in English, Chinese and Punjabi enabled us to collect data from those rarely included in reports about primary healthcare (PHC) experiences together with their confidence in these services.
-
These were cross-sectional data collected in one Canadian province; therefore, generalisability to other settings may be limited and only associations between patients’ experiences and confidence in PHC can be inferred.
-
Asking a question about confidence in a survey is a snapshot of an attitude that is never permanently crystallised, but likely has some stability over time.
Introduction
Confidence in healthcare can be defined as a belief in the trustworthiness or reliability of care, and understood as a perception that influences how patients make decisions. Reduced confidence in healthcare on the part of patients is a serious concern because it can lead to poorer health outcomes and increase system costs.1–7 It can also lead to avoidance of care or seeking second and third opinions, requesting the newest prescription drug, and unnecessary medical tests. Previous works have shown that patients with higher confidence are more likely to seek care and show greater compliance with treatment.5 ,8–12 Indeed, it has long been recognised that the public's confidence in medicine's ability to provide care is one of its greatest assets,13 allowing practitioners to define the scope of medical work and increase their political and clinical autonomy. Confidence eliminates uncertainty, implies stability and suggests that a system is in place to effectively deal with any risks.
Poor health outcomes or inequities in healthcare that are known to occur among diverse ethnic populations are associated with their confidence in the healthcare system.10 ,12 ,14–17 Previous studies in the USA and the UK have suggested that ethnic and linguistic minorities have lower levels of confidence or trust, which could lead to health disparities.18–20 For example, African-Americans generally have less confidence in primary healthcare (PHC) providers and the healthcare system; observed differences in trust have been attributed to divergent experiences,15 ,21 historical legacies16 and lower levels of generalised social trust.18 Some sources of confidence are pertinent for one ethnic group but not for others. For example, gender has a stronger relationship with trust among non-Latino whites compared with African-Americans.15 Language was a concern for Hispanics who expressed reduced confidence when they had difficulty communicating with the PHC provider due to a language barrier.22
There remains a paucity of literature about levels of confidence in healthcare held by ethnic or language groups in other countries, including Canada. The purpose of this study was to examine levels of confidence among ethnic and linguistic minorities. The specific research questions were: (1) Does confidence in PHC differ between ethnic–linguistic groups? and (2) What PHC experiences are associated with confidence?
Methods
Design and participants
This cross-sectional survey was designed to examine patient experiences in PHC across three ethnic and language groups. The survey reflected important dimensions of PHC based on our previous work23 and past research,24 ,25 sociodemographic characteristics, health status and confidence in the healthcare system. Each participant was given a definition of PHC as the: “Provision of healthcare services outside of hospital settings. Family physicians and nurses most often provide these services. These clinicians assume responsibility for a large part of your personal healthcare needs—they provide services (eg, immunisations) to keep people from getting sick and provide services when people are sick.”
The survey, originally developed in English, was translated to Chinese and Punjabi by research assistants (RAs) and then back-translated to English by different RAs.26 All RAs were fluent in written and spoken English as well as in Chinese or Punjabi. To ensure semantic equivalence,27–31 we first undertook the translation process and then further refined items with cognitive interviews32–34 that were completed with a small group of Chinese (n=10) and Punjabi (n=10) participants. Semantic equivalence was satisfied when items originally developed in English had similar meanings to people whose first language is not English. That is, the same expression existed in the target culture and equivalent expressions could be found for idioms and colloquialisms and the technical features of the language were equivalent (eg, complexity, syntax and grammar). In order to ensure operational equivalence (eg, administration using low-literacy terms and correct skip patterns), the survey was pilot tested in a smaller sample of Chinese-speaking (n=121) and Punjabi-speaking (n=131) participants.
Random digit dialling (RDD) methods were used to collect a random sample of ethnic Chinese, South Asian and English speakers of presumed European descent (herein ESED) participants’ reports of PHC experiences. A random sample of telephone numbers35 was obtained from British Columbia's (BC's) 28 census divisions, based on relative population. For example, the Greater Vancouver Regional District (GVRD) contained 51% of BC's population; thus, 51% of the sample was drawn from the GVRD. In order to increase the probability of contacting individuals whose first language was either Chinese or Punjabi, we used two approaches to randomly selecting telephone numbers. First, we oversampled telephone numbers in census dissemination areas where there was a high likelihood of speaking Chinese or Punjabi at home. Second, we oversampled Chinese and South Asian households where the listed surname for the telephone number matched the list of Chinese or South Asian surnames maintained by ASDE, which maintains the Canada Survey Sampler.35
The survey sampler is a general, geographically stratified, telephone population, random sampling programme. It samples by RDD methodology. The samples are checked against published phone lists to divide the RDD into ‘directory listed’ and ‘directory not listed’ components.35 In an effort to ensure that participants were accessing similar PHC services, we obtained a random selection of telephone numbers for ESED participants from telephone exchanges and geographical areas where at least one completed survey from Chinese-speaking or Punjabi-speaking participants occurred.
Data collection procedures
Computer-assisted telephone interviews took place in Chinese (Cantonese or Mandarin), Punjabi or English. Using a standard telephone script, one adult per household was randomly selected by asking to speak to the adult with the next birthday. Eligibility criteria included: (1) age 19–90 years, (2) Chinese, Punjabi or English speaking, (3) no cognitive impairments and (4) had visited a family doctor or nurse practitioner in the past 12 months. Verbal consent was obtained and each survey took an average of 27 min to complete.
Variables of interest
Drawing on previous work measuring consumer confidence,24 ,25 our dependent variable of interest was patients’ reports of their confidence in PHC: “On a scale of 0–10, where 0 means no confidence at all and 10 means total confidence, how much confidence do you have in the ability to get the primary health care services you need?”
We examined which patient-reported PHC experiences were associated with confidence. Our analyses were informed by previous works. Increased trust (a closely related concept) is associated with: positive interpersonal style of physician,7 ,21 ,30 ,31 increased time spent with the physician, continuity of care15 ,32 ,33 and coordination of care.36 We measured six dimensions of PHC: accessibility, utilisation, relationship continuity of care, interpersonal communication, quality and acceptability of care and care obtained outside Canada (table 1). Accessibility was measured by patients’ reports of having a usual source of care, length of wait time to see a provider and unmet healthcare needs.37 Utilisation was measured by the respondent's report of the number of times he/she had visited their doctor for either a physical or mental health issue. Relationship continuity was measured by the patient's self-report of the length of time he/she had been with the same provider. Interpersonal processes of care was measured using the Interpersonal Processes of Care (IPC) short form which is a publicly available reliable and valid instrument.38 IPC items (table 1) were combined to create scale scores for: unhurried communication, explained results, patient-centered decision-making and interpersonal style. All scales were constructed such that a higher score meant more of the concept.
Description of independent variables that represent patient experience with primary care
To measure the dimension of quality, participants were asked to provide an overall rating of the quality of healthcare received in the past 12 months. We constructed the acceptability of care from two items where patients reported on the acceptability of wait times for routine and urgent services. One additional measure, receiving care outside of Canada, was also included (see table 1).
Other covariates
Our analyses included sociodemographic characteristics and health status as potentially confounding variables. These variables included: gender (male and female), age (continuous variable), education (less than high school, high school, some university or completed college, completed undergraduate degree and graduate degree), yearly household income (<C$10 000–C$30 000, C$30 001–C$50 000, C$50 001–C$80 000, C$80 001–C$100 000 and >C$100 000) and marital (yes or no), employment (full-time or not full-time) and immigrant status (born in Canada and years living in Canada).
Health status variables included: presence of a chronic condition, number of chronic conditions and self-rated health (excellent, very good, good, fair or poor). Participants were asked whether a health professional had ever diagnosed or treated them for heart disease (yes/no), high blood pressure or hypertension (yes/no), depression (yes/no), arthritis (yes/no), diabetes (yes/no) or some other chronic condition. We constructed a variable that provided information on whether a participant had one, two or three or more chronic conditions. Reports of self-rated health status were collapsed into three categories: excellent/very good, good and fair/poor.
Data analysis
Prior to undertaking data analysis for this study, we conducted psychometric testing of the items and scales. We examined single-item responses for their distribution. If the items were part of a scale, internal consistency reliability was examined using Cronbach's α coefficient. The four IPC scales and the Acceptability scale met adequate internal consistency reliability criterion of >0.70.39
Descriptive statistics were calculated to characterise five ethnic and linguistic groups: English-speaking Chinese, Chinese-speaking (Mandarin or Cantonese) Chinese, English-speaking South Asians, Punjabi-speaking South Asians and ESED. Although missing data on individual items were low, missing data for scales ranged from 11% (unmet healthcare needs) to 43% (household income; see table 4). Multiple imputations using the expectation maximisation algorithm for missing income data were calculated using Stata V.11. However, since patient-centered decision-making may not have been applicable to all participants (true missing data), it was excluded from the regression model because of the high amounts of missing (44.8%) data.
We conducted a series of stepwise ordinary least squares regression models to identify whether ethnic–linguistic group remained statistically significant after controlling for other variables. Four blocks of variables were entered into the regression models in the following order: (1) ethnic–linguistic group, (2) sociodemographic characteristics, (3) health status and (4) the six dimensions of patient experiences in PHC: accessibility, utilisation, relationship continuity of care, interpersonal processes of care, quality and acceptability of care and obtaining care outside Canada. Of the three items asking about length of waiting time to see their usual provider, we used one variable (length of wait) to keep the model more parsimonious.
In order to answer our research questions, ethnic–linguistic group and patient experiences in PHC were considered as independent variables, whereas sociodemographic characteristics and health status were considered as potentially confounding variables. Statistical tests were two-tailed, reflecting our uncertainty about the likely direction of many of the effects. Descriptive statistics were conducted using SAS V.9.1, and regression modelling was conducted using Stata V.11.
To guide our analytical work, we hypothesised that the following experiences of care would be significantly associated (p < 0.01) with higher confidence in PHC
-
Accessibility: patients who have a usual source of care.
-
Interpersonal Processes of Care: patients who scored higher on communication, decision-making and interpersonal style scale.
-
Quality: patients who reported a higher rating of quality of healthcare received in the past 12 months.
-
Acceptability: patients who reported that wait times for routine and urgent care were more acceptable.
Results
A total of 1211 participants answered our survey. Response rates were calculated based on ethnicity, language and the number of complete interviews, divided by the total number of interviews (complete plus partial) plus the number of non-interviews that involve the identification of and contact with an eligible respondent (eg, refusal and break-off).40 Telephone numbers were checked to ensure they were operational. Attrition due to telephone numbers not being operational ranged from 17% (Punjabi) to 30% (ESED). Next, telephone numbers were called and eligibility of potential participants was assessed. Attrition of participants due to not meeting the eligibility criteria of the study ranged from 7% (Caucasian) to 20% (Chinese). The response rates ranged from 25% (ESED) to 50% (Chinese-speaking and English-speaking Chinese). Once potential participants responded to the telephone interviewer, the cooperation rate was 79% (Punjabi-speaking South Asian) to 94% (Chinese-speaking Chinese).
The characteristics of the total sample and by ethnic–linguistic groups are displayed in table 2. There was a significant amount of heterogeneity between the ethnic–linguistic groups. Only 31% of the participants in the total sample were born in Canada, with Chinese-speaking and Punjabi-speaking groups made up mostly of immigrants; approximately half of those who immigrated to Canada did so after 1990. All groups, except Chinese-speaking Chinese, had lived in Canada for over 20 years.
Sociodemographic characteristics of participants
In the total sample, half of the participants reported having at least one chronic condition. Yet, over 60% of ESED reported having a chronic condition followed by Punjabi-speaking South Asians (54%), English-speaking South Asians (48%) and the English and Chinese-speaking Chinese (40%). For all groups, the most frequently reported chronic condition was hypertension. The presence of depression was reported significantly less by English (6%) and Chinese-speaking Chinese (4%) compared with any other group. Almost one-third of ESED and one of every five Punjabi-speaking South Asians reported having two or more chronic conditions. Over one-third of Chinese-speaking and Punjabi-speaking participants reported their health as fair or poor.
Confidence
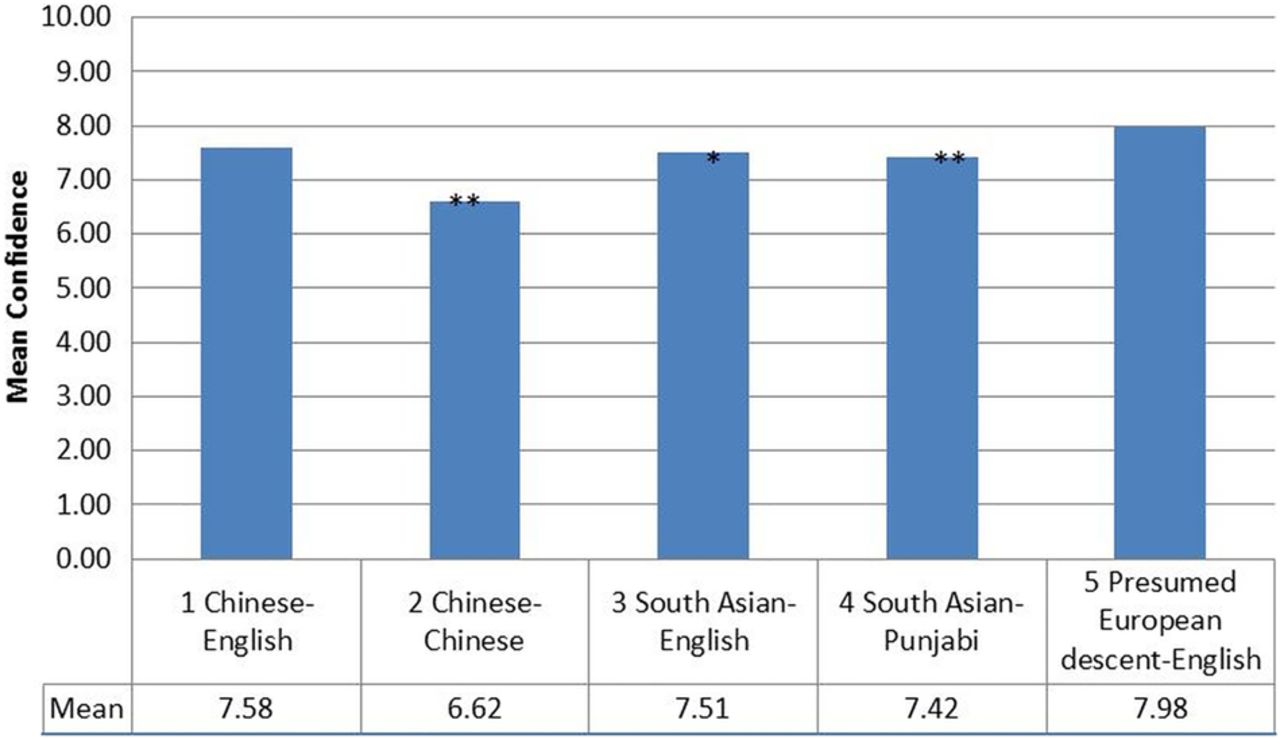
Figure 1 shows that participants’ mean level of confidence in PHC ranged from 7.98 (ESED) to 6.62 (Chinese-speaking Chinese), on a scale of 1–10. Three ethnic–linguistic groups, Chinese-speaking (p<0.001) and Punjabi-speaking (p<0.001) and English-speaking South Asians (p<0.05), reported significantly lower confidence in PHC compared with other English speakers. Given that the majority of Chinese-speaking Chinese and Punjabi-speaking South Asians were not born in Canada, figure 1 also suggests that these groups have significantly lower confidence in PHC compared with their ESED counterparts.
Confidence in primary healthcare.
Obtaining care outside Canada
Table 3 shows results for patients’ experiences in PHC. Among these groups, Chinese-speaking Chinese were more likely to obtain care outside Canada.
Patient reported experiences in primary healthcare
Accessibility
Compared with other ethnic–linguistic groups, the ESED group waited the shortest amount of time to see a provider at their usual place of care. Punjabi-speaking South Asians have the highest number of people who reported waiting over 60 min to see a provider at their usual place of care. Waiting over 1 month for needed healthcare was highest in the ESED group. Almost one in four English-speaking Chinese reported having to wait weeks to receive needed healthcare compared with other groups. Many (81%) respondents could see their doctor within the next working day but the variation between groups ranged from 75% of English-speaking South Asians to 87% of Chinese-speaking Chinese.
Utilisation and relationship continuity
Compared with the ESED, Punjabi-speaking South Asians reported the highest number of times they visited their provider for physical and mental health issues. No differences were found in the relationship continuity among the ethnic and language groups.
Interpersonal processes of care
Among all the groups, Chinese-speaking Chinese reported significantly lower scores on all scales: unhurried communication, explanation of test results, patient-centered decision-making and interpersonal style, as compared with the ESED. Patient-centered decision-making was scored the lowest of the IPC scales by all participants.
Quality and acceptability of care
Compared with the ESED, Chinese-speaking Chinese had a significantly lower number of participants rate the quality of healthcare as ‘excellent’ or ‘very good’. One in three Chinese-speaking Chinese and Punjabi-speaking South Asians reported the quality of PHC as fair/poor. South Asians, both English and Punjabi speakers, reported significantly lower acceptability of wait times for PHC.
The hierarchical linear regression results are shown in table 4.
Hierarchical linear regression models showing the association between ethnicity/language and patient experiences in primary healthcare
Ethnic–linguistic group remained significantly related to confidence in PHC after controlling for sociodemographic characteristics and health status. Specifically, Chinese-speaking Chinese reported a lower confidence in PHC than did ESED. However, when participants’ PHC experiences were entered into the regression model, the association between being Chinese-speaking Chinese and reports of lower confidence in PHC was attenuated. Patient experiences significantly associated with lower confidence in PHC included: if, in the past 12 months care was received outside Canada, they had to wait for months to see their regular doctor, or they rated the quality of healthcare received as good or fair/poor. Higher reports of confidence in PHC was associated with participants’ experiences in: perceiving their doctor was concerned about their feelings, that their doctor was respectful or if they found wait times for routine and urgent care acceptable. The final regression model explained 30% of the variance with many patient experience variables significantly and positively related to confidence in PHC. These variables far outweighed the impact of ethnicity and language alone on levels of confidence.
Discussion
The results of this study suggest that, uniformly, confidence in PHC is less than ideal. No one group in this study scored close to 10. Moreover, confidence in PHC differs by ethnicity and the ability to speak English. These results provide evidence of the heterogeneity among ethnic groups. Work completed in the UK reported that South Asian and Chinese who speak English as a second language score lower on primary care surveys.41 Future examination of health disparities should take into account ethnicity and language.
Most of the effect of ethnicity and language on confidence, however, was influenced by aspects of the care experience. Increased confidence in PHC was related to certain aspects of the care experience such as providers’ interpersonal style and acceptability of wait times. Recent work from the UK suggests that interpersonal communication is a driver of overall satisfaction with primary care.42 Structural changes to PHC that enable more positive interactions between patients and their usual provider/place of care and decreased wait times for appointments can serve to increase patients’ confidence in PHC. It is important to build patients’ confidence in PHC in order to be responsive to people's needs and potentially avoid increased health system costs where less confident patients may seek second and third opinions and have unnecessary or duplicative tests.
By tracking patients’ experiences and confidence over time, insights into the ongoing importance of healthcare concerns for Canadians could be provided. While work of this nature is now being led by the Robert Wood Johnson Foundation,43 this study provides a broad range of experiences that could be tracked as indicators for better understanding and forecasting changes in the PHC system. This type of work could provide important information on the quality of PHC. Confidence in PHC could be an indicator of ‘consumer expectations’ in healthcare, similar to the type of information gathered through the Index of Consumer Expectations, which is an official component of the US Department of Commerce's Index of Leading Economic Indicators.43
The results should be interpreted in light of this study's limitations. These were cross-sectional data collected in one Canadian province. Therefore, generalisability to other settings may be limited. Not all variables, such as the physician's ethnicity or preferred language, which are known to influence patient's confidence, were measured in this study. Having this variable available could have resulted in more of the variance of the regression model being explained. However, having the survey available in three different languages enabled us to collect data from a sample rarely included in self-report surveys. Only associations between patients’ experiences and confidence in PHC can be inferred. While patients’ experiences and their ratings of confidence in PHC can fluctuate over time, recent evidence from the US suggests that even despite an eventful year of health reform in 2010, trends in patients’ confidence remained stable.43 We can also draw on work from public opinion polls which suggest that for the most part, people do not have preformed, crystallised attitudes on public issues.44 ,45 Asking a question about confidence in a survey is a snapshot of an attitude that is never permanently crystallised but likely has some stability over time. Finally, this was a telephone survey which will not have reached those who do not have a telephone. Although the response rate for the ESED group was low, the response rates of the other groups were higher than a similar RDD survey completed in BC.45
Despite these limitations, patient experiences in PHC are associated with a person's confidence in the PHC system. Confidence in PHC is generally low, especially those who are Chinese-speaking Chinese. One reason for this group's low reported confidence in PHC could be based on their experience using the healthcare system in China. Despite major PHC reforms occurring in China, in urban areas, out-of-pocket payment for and receipt of PHC services from ‘specialists’ located in hospitals is still the norm. In addition, Chinese-speaking Chinese may believe that paying for services means care will be provided to certain standards.46 Even though Chinese-speaking Chinese in this sample had lived in BC for over 10 years, their low confidence scores could be based on the belief that skills of community-based PHC providers are low; in China, this belief is true since 25% of general practice physicians and approximately 2% of nurses having bachelor's level training with few receiving any training in general practice.46 Based on the results from our Chinese-speaking Chinese respondents, more work is needed to examine the relationship between obtaining healthcare services outside Canada and confidence in PHC in Canada.
In summary, overall confidence in PHC can be improved. Experiences of care in PHC, regardless of ethnicity or language spoken, can influence people's confidence in PHC. These findings have important implications for policy and decision makers. In countries with people who have diverse ethnic and language backgrounds, having positive PHC experiences is important. Work completed in the UK by Croker et al44 also provides evidence that, in particular, interpersonal aspects of a visit are strongly associated with reported confidence and trust in the doctor. Poor experiences of care, particularly for those who are not English speakers, could have a stronger overall impact on confidence, which could lead to delays in obtaining necessary services and possibly using more acute levels of care. This study provides a snapshot of how people who speak English, Chinese and Punjabi living in BC experience PHC and their confidence in the PHC system.
Acknowledgments
The authors would like to thank their research assistants and the men and women who participated in this study. The authors also especially acknowledge the support of Weihong Chen, Anureet Brar, Albert Wu, Sitaram Saroa and Emily Marshall in facilitating collection of data. They also thank Sandra Peterson and Leena Wu in their assistance with some of the data analysis and formatting, respectively.
References
Footnotes
-
Contributors STW oversaw all parts of the project, including conceptualisation, data collection and analysis and writing of the manuscript. CB and FC conceptualised and interpreted the analysis. RB conducted analysis of the data. JLH and J-FL helped to conceptualise the overall study, interpreted the analysis and aided in writing the manuscript. All authors contributed to the final version of the manuscript.
-
Funding This study was funded by a grant from the Canadian Institutes for Health Research grant number (166088).
-
Competing interests STW was supported by a scholar award from the Michael Smith Foundation for Health Research (CI-SCH-051 (04-1)) and a new investigator award from the Canadian Institutes for Health Research. JLH was supported by the Canadian Institutes for Health Research and the Université de Sherbrooke as a Canada Research Chair. J-FL had a Fonds de la recherche en santé du Québec clinical scientist award.
-
Ethics approval The University of BC's Behavioral Ethics Board approved all procedures.
-
Provenance and peer review Not commissioned; externally peer reviewed.
-
Data sharing statement Deidentified data are available for use. Permission must be sought from STW (Sabrina.wong@nursing.ubc.ca)