Article Text

Abstract
Objective To use newly available self-assigned ethnicity information to investigate variation in breast cancer screening uptake for women from the 16 specific ethnic groups within the broad Asian, Black and White groups that previous studies report.
Setting National cancer screening programme services within London.
Participants 655 516 female residents aged 50–69, invited for screening between March 2006 and December 2009. Ethnicity information was available for 475 478 (72.5%). White British women were the largest group (306 689, 46.8%), followed by Indian (34 687, 5.3%), White Other (30 053, 4.6%), Black Caribbean (25 607, 3.9%), White Irish (17 271, 2.6%), Black African (17 071, 2.6%) and Asian Other (10 579, 1.6%).
Outcome measures Uptake for women in different ethnic groups aged 50–52 for a first call invitation to the programme, and for women aged 50–69 for a routine recall invitation after a previous mammography. Uptake is reported (1) for London overall, adjusted using logistic regression, for age at invitation, socioeconomic deprivation and geographical screening area, and (2) for individual areas, adjusted for age and deprivation.
Results White British women attended their first call (67%) and routine recall (78%) invitations most often. Indian women were more likely to attend their first (61%) or routine recall (74%) than Bangladeshi women (43% and 61%, respectively), and Black Caribbean women were more likely than Black African women to attend first call (63% vs 49%, respectively) and routine recall (74% vs 64%, respectively). There was less variation between ethnic groups in some screening areas.
Conclusions Breast cancer screening uptake in London varies by specific ethnic group for first and subsequent invitations, with White British women being more likely to attend. The variation in the uptake for women from the same ethnic groups in different geographical areas suggests that collaboration about the successful engagement of services with different communities could improve uptake for all women.
- PUBLIC HEALTH
- PREVENTIVE MEDICINE
This is an Open Access article distributed in accordance with the Creative Commons Attribution Non Commercial (CC BY-NC 4.0) license, which permits others to distribute, remix, adapt, build upon this work non-commercially, and license their derivative works on different terms, provided the original work is properly cited and the use is non-commercial. See: http://creativecommons.org/licenses/by-nc/4.0/
Statistics from Altmetric.com
Strengths and limitations of this study
-
Women from different ethnic groups in the UK have differing awareness of National Health Service cancer screening programmes but studies assessing uptake of breast cancer screening have investigated only the broad Asian, Black and White ethnic groups.
-
This study used new self-assigned data on the more specifically defined ethnic groups and investigated different geographical screening areas of a diverse London population which has a low screening uptake.
-
The study found significant differences in the uptake of breast cancer screening within each of the broad White, Black and Asian ethnic groups in London.
-
The variation in screening uptake found for women from specific ethnic groups between different geographical screening areas of London suggests there are significant opportunities to improve uptake for all women.
Introduction
The English Breast Screening Programme aims to identify breast cancers at an early stage, thereby improving treatment options and survival.1 ,2 Uptake of breast cancer screening is defined as the proportion of women invited who attend for screening within 6 months of their invitation. Within England, this has been consistently lower in London than other areas.3 London is the most ethnically diverse area in England, and previous research has shown that different ethnic groups have varying knowledge of cancer screening programmes4 and beliefs about their personal risk of breast cancer.5
A recent British survey found there was no statistically significant difference in the proportion of White British women and women from any other ethnic group who reported ever having had a mammogram, although White British women were more likely to report having had a cervical smear.6 Breast screening attendance has been found to vary between the broad White (British, Irish and White Other), Black (Caribbean, African and Black Other) and Asian (Indian, Pakistani, Bangladeshi and Asian Other) groups within London,7 and uptake is lower in some Asian religio-linguistic groups, particularly Muslim women, compared with non-Asian groups in the West Midlands.8 Scottish data have shown that after taking age, education, deprivation, long-term illness and urban/rural status into account, White Scottish women were more likely to attend breast cancer screening than women from Other White British, Irish, Other White, Mixed, Indian, Pakistani, other South Asian, African and other ethnic groups.9
This study aimed to examine the difference in breast cancer screening uptake in London in the 16 more specifically defined ethnic groups from the England and Wales 2001 Census using individual-level self-assigned ethnicity information.
Methods
Information on women resident in London who had been sent a breast cancer screening invitation between 31 March 2006 and 31 December 2009 was obtained from the London Quality Assurance Reference Centre. Invitations were from six geographical screening areas—North London; West of London; Barking, Havering, Redbridge and Brentwood; Central and East London; South East London; and South West London. Each woman's earliest invitation in this period was examined and the data were split into two groups. Women aged 50–52 who had a first call invitation (a first invite to the national screening programme) and women aged 50–69 who had a routine recall invitation (after previously attending for a screening programme mammography) were analysed separately.
Self-assigned ethnicity was recorded by the screening programme on attendance, including subsequent invitations to the ones studied. If a woman never attended a screening appointment, or chose not to describe her ethnic group, this information was missing. In these cases, multiple imputation was used to estimate this variable. Twenty data sets were imputed for a categorical variable using the statistical software package Stata, based on age when invited, screening area, type of invitation (first call or routine recall), ward of residence, socioeconomic deprivation and screening attendance. The 16 ethnic groups from the England and Wales 2001 Census were analysed (table 1). Postcodes were used to assign each patient to a lower super output area (LSOA) of residence. Socioeconomic deprivation was measured based on their LSOA using the income domain from the Indices of Deprivation 200710 divided into quintiles over the whole of England.
Number and percentage of women invited for first call and routine recall breast cancer screening appointments in different ethnic groups, London screening areas
Screening attendance in different ethnic groups was assessed using logistic regression, and adjusted for age at invitation, socioeconomic deprivation and screening area. White British women were used as the baseline group. Odds ratios were then back transformed to calculate adjusted proportions for each ethnic group. The six individual screening areas were also analysed separately, adjusting for age and socioeconomic deprivation to assess variation in the attendance of specific ethnic groups within them.
Results
Data on 159 078 women were included in the first call analysis, and on 496 438 women in the routine recall analysis. Ethnicity information was available for 475 478 (72.5%) of women analysed: 95 284 (59.9%) of the first call group and 380 194 (76.6%) of the routine recall group (table 1). White British women were the largest known ethnic group (46.8%), followed by Indian women (5.3%) and White Other women (4.6%).
In the first call group, the proportion of known ethnicity information varied by age (61% in 50-year olds, 62% in 51-year olds and 56% in 52-year olds), socioeconomic deprivation (64% in the most affluent quintile and 56% in the most deprived quintile) and screening area (from 56% in West of London to 73% in Barking, Havering, Redbridge and Brentwood). However, the age and socioeconomic differences were largely due to variation in screening attendance. When examining only those who attended their screening appointment, 91% of 50 and 51-year olds, 90% of 52-year olds and 91% in each socioeconomic deprivation group had known ethnicity information. There was still variation between screening areas, with the lowest proportion of known ethnicity in South West London (83%) and the highest in Barking, Havering, Redbridge and Brentwood and South East London (97%). Similarly, of women who attended their routine recall screening appointment, ethnicity was known for 90–93% of the different age groups and 90–92% of the different socioeconomic groups. Women in South West London (82%) were least likely to have a record of their ethnicity if they attended, and women in South East London (98%) were most likely.
The number of women invited and screened in the two invitation groups are shown overall and for age, screening area and socioeconomic deprivation groups in table 2. Of the women invited for their first call screening appointment, 96 452 (61%) attended. Of women who attended this screening appointment, ethnicity information was available for 87 530 (91%) women, while of the 62 626 women who did not attend, ethnicity was known for only 7754 (12%). Attendance ranged in the different screening areas from 55% in Central and East London and 56% in the West of London areas, to 71% in Barking, Havering, Redbridge and Brentwood. Women resident in the most deprived areas were less likely to attend than those living in more affluent areas. Uptake was higher for women who were invited to a routine recall appointment, with 371 848 (75%) women attending having previously attended a screening appointment. Ethnicity information was provided by 91% (340 001) of women who attended this appointment, and 40 193 (32%) women who did not attend. Again, attendance was highest in Barking, Havering, Redbridge and Brentwood (82%), while the lowest attendance was in the West of London (72%) and North London (73%) screening areas. Routine recall screening uptake decreased as age at invitation and deprivation of area of residence both increased.
Number of women invited and who attended first call and routine recall breast cancer screening appointments, London screening areas
The proportions of women attending screening appointments in different ethnic groups, adjusted for age, socioeconomic deprivation and screening area are shown in figure 1 (for ORs see table 3). White British women were most likely to attend their first call (67%) and routine recall (78%) invitation. Of the other ethnic groups, first call screening uptake ranged between 43% in Bangladeshi women and 63% in Black Caribbean women. Bangladeshi women also had the lowest uptake of routine recall screening invitations (61%), while excluding White British women, Mixed White & Asian women had the highest uptake (75%). Variation within each of the broad ethnic groups was also seen. For example, Indian women were more likely to attend their first call (61%) or routine recall (74%) appointments than Pakistani (52% and 67%, respectively) or Bangladeshi women (43% and 61%, respectively). Black Caribbean women were more likely than Black African women to attend first call (63% vs 49%) as well as routine recall (74% vs 64%) appointments.

Uptake of screening invitations in different ethnic groups, London, adjusted for age at invitation, screening area and socioeconomic deprivation. (A) First call invites, women aged 50–52 and (B) routine recall invites, women aged 50–69.
Fully adjusted ORs and 95% CIs of attending first call screening appointment, women aged 50–52
There was less variation in first call uptake between ethnic groups in some of the screening areas (figure 2 for percentages and table 3 for ORs). For example, in the West of London screening area, White Irish (57%, 95% CI 53% to 62%), Indian (60%, 95% CI 58% to 63%), Asian Other (58%, 95% CI 54% to 61%), Chinese (57%, 95% CI 51% to 62%) and all of the Mixed groups of women were as likely to attend their first call appointment as White British women (60%). White Irish (66%, 95% CI 61% to 71%), Indian (69%, 95% CI 65% to 73%), Black Caribbean (65%, 95% CI 61% to 68%), Chinese (62%, 95% CI 55% to 69%) and all Mixed groups also had the same likelihood of attending as White British women (67%) in South West London. However, the biggest difference in attendance was in South East London, where Pakistani (19%, 95% CI 14% to 25%) and Bangladeshi (14%, 95% CI 10% to 19%) women had a much lower uptake of their first call invitation than other ethnic groups (between 40% in Asian Other women and 69% in White British women).
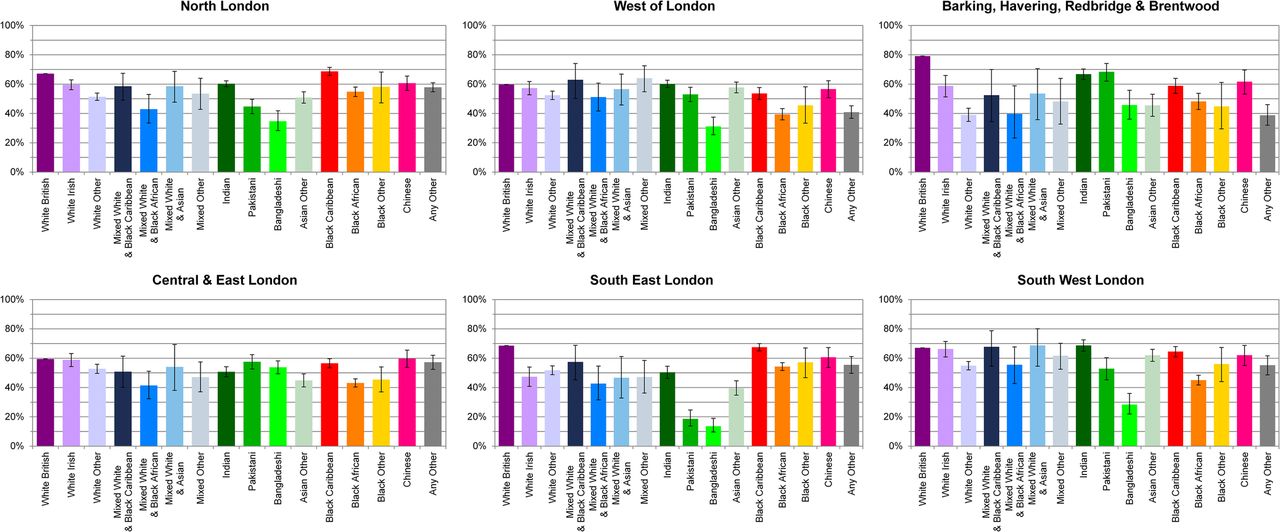
Uptake of first call screening invitations in different screening areas and ethnic groups, London, women aged 50–52, adjusted for age at invitation and socioeconomic deprivation.
When routine recall uptake was analysed separately for the screening areas (figure 3 and table 4 for ORs), Mixed White & Asian and Chinese women were as likely to attend their screening appointment as White British women in four of the areas (North London, West of London, Central and East London, and South West London). In general, there was less variation between ethnic groups within the screening areas than overall, although in Barking, Havering, Redbridge and Brentwood and South East London, White British women were more likely to attend than all other ethnic groups. The biggest discrepancy was again seen in South East London where Bangladeshi women had a screening uptake of 36% (95% CI 30% to 43%), which was less than half the highest uptake figure of 82% for White British women.

Uptake of routine recall screening invitations in different screening areas and ethnic groups, London, women aged 50–69, adjusted for age at invitation and socioeconomic deprivation.
Fully adjusted ORs and 95% CIs of attending routine call screening appointment
Discussion
In London, White British women are more likely than other ethnic groups to attend screening appointments as part of the national Breast Screening Programme. This difference is not explained by socioeconomic deprivation or place of residence. Variation in uptake is also found for the more specific ethnic groups within the broad Asian, Black and White ethnic groups. However, within some screening areas, women from several specific ethnic groups had uptake rates similar to White British women's. These results were found for the first invitation and subsequent invitations after women had previously been screened, and were not explained by differences in socioeconomic deprivation or age.
A previous study of the same region found variation in breast cancer screening attendance between ethnic groups, with areas with large Black populations having lower attendance.7 The pattern with the Asian group was more complex, and probably a consequence of combining the diverse Indian, Pakistani, Bangladeshi and Asian Other groups into one. The present study's ability to examine the more specific census categories within each broad ethnic group has shown other important differences, for example, the lower uptake in Black African women compared with Black Caribbean women, and in White Other women compared with White British women.
A survey of women in Britain by Moser et al6 showed that while White British women were more likely to report ever having had a mammogram than women from other ethnic groups combined after adjusting for age, this difference was attenuated and not statistically significant after additionally adjusting for region and various socioeconomic factors. However, this measure does not indicate whether a woman has attended routine screening appointments, as any reason for having a mammography was included. The income domain of the Indices of Deprivation used in the present study may not adequately account for explanatory socioeconomic differences, and the multiple measures (including number of cars available to a household, housing tenure, education level and socioeconomic employment classification) used by Moser et al may be more appropriate. Future analyses could explore the effect of different measures of socioeconomic deprivation.
The present study used self-assigned individual-level data on ethnicity for women who were invited for, as well as those who attended breast cancer screening appointments in London for almost 4 years. However, ethnicity information was not available for all women who were invited for screening. If a woman had never attended a screening appointment there would be no opportunity for her ethnicity to be recorded. There was, therefore, a higher proportion of women with ethnicity information in the routine recall group, as these women had all previously attended a screening appointment. However, not all women who attend have an ethnic code recorded, so there was still missing ethnicity information in this group. Restricting the routine recall analysis to those who had a known ethnicity had little impact on the results (data not shown). Using multiple imputation provided similar results overall and across the screening areas for the different invitation types, suggesting that this method was as accurate with the different levels of missing ethnicity data.
Although the 16 more specific ethnic groups from the England and Wales 2001 Census were examined, there are likely to be other factors that would affect uptake of screening invitations within these groups. The variation in screening uptake found between Asian religio-linguistic groups in the West Midlands8 indicates that the analysis of even more specific ethnic groups would be useful in future studies.
While Bangladeshi women had low uptake of breast cancer screening overall and in most screening areas, in Central and East London, where the majority of the Bangladeshi population live,11 uptake was more similar to other ethnic groups. Several projects to improve screening uptake in this area were undertaken around the time of data collection for this analysis.12 Although some of the initiatives were focused on White British, White Irish and Bangladeshi women, an improvement in uptake was only seen in Bangladeshi women, the ethnic group with the lowest uptake in London.13
Even in areas where there was less variation in attendance, some ethnic groups had much lower uptake. While it makes sense to focus on as many of the eligible population as possible to improve screening uptake, smaller communities should not be forgotten. Collaboration between different areas to find successful practices for engaging with particular communities would be an ideal place to start.
London has a greater population turnover rate than other regions in England, and smaller areas within London have even higher rates.14 This may impact on the accuracy of General Practice lists, so that women who no longer live at an address are being invited to screening appointments. This would lead to a lower uptake level. Eilbert et al12 found that increasing population turnover was actually associated with a higher proportion of eligible women who were screened in the previous 3 years. However, the data collected were from different sources in different years and only a small proportion of the variation between areas was explained by population turnover.
The fact that women from some ethnic groups had low uptake of both first call and routine recall implies that not only were these women less likely to attend the screening appointment, which was their first contact with the screening service, but that having attended, they were also less likely to return. Having a negative previous experience can be a factor in women not attending subsequent screening appointments15 ,16 and, therefore, improving the experience so that it matches the expectations of women from these ethnic groups could help to increase screening uptake. While the variation in screening attendance found in this study is a concern, the real challenge is ensuring a high level of uptake across all ethnic groups. Work to improve screening uptake in London has continued since the study period for which these self-assigned ethnicity data first became available. Future studies can now evaluate the influence of improvement initiatives on these uptake figures and on the variation between them.
Acknowledgments
The authors thank Steve Dixon, former Director of Quality Assurance for the London Quality Assurance Centre for his help in securing the data and funding for this study.
References
Footnotes
-
Contributors RHJ, TR and EAD designed the study. TR acquired and advised on the data. HM advised on analysis. RHJ analysed the data and drafted the manuscript.
-
All authors interpreted the data, commented on the manuscript and had final approval of the version to be published.
-
Funding This study was funded by the former London Quality Assurance Centre and the former Thames Cancer Registry. The work was carried out by the Thames Cancer Registry in King's College London, which received funding from the Department of Health. The study was completed with the support of the London Knowledge and Intelligence Team, Public Health England.
-
Competing interests None.
-
Provenance and peer review Not commissioned; externally peer reviewed.
-
Data sharing statement No additional data are available.