Article Text

Abstract
Objective To study stroke incidence among women over 32 years of age with a focus on subdividing by stroke type, to consolidate end points and associations with risk factors.
Design Prospective population study initiated in 1968–1969 with follow-ups in 1974, 1980, 1992 and 2001.
Setting Gothenburg, Sweden.
Participants A sample of 1462 women from five age strata examined in 1968–1969, representative of women in the general population.
Main outcome measures Main types of first-ever stroke and fatal stroke during 1968–2001 identified and validated. Stroke incidence rates in different age strata. Association with baseline smoking, body mass index (BMI), waist–hip ratio, hypertension, serum lipids, physical inactivity, perceived mental stress and education. Associations with atrial fibrillation (AF), diabetes, baseline hypertension and myocardial infarction (MI). Blood pressure (BP) levels 1–3, corresponding to modern guidelines, in relation to stroke risk.
Results 184 (12.6%) cases of first-ever stroke, 33 (18%) of them fatal. Validation reduced unspecified stroke diagnoses from 37% to 11%. Age-standardised incidence rate per 100 000 person-years was 448. A multivariate model showed a significant association between ischaemic stroke and high BMI: HR 1.07 (95% CI 1.02 to 1.12), smoking 1.78 (1.23 to 2.57) and low education 1.17 (1.01 to 1.35). Significant association was seen between haemorrhagic stroke and, besides age, physical inactivity 2.18 (1.04 to 4.58) and for total stroke also hypertension 1.45 (1.02 to 2.08). Survival analysis showed a significantly increased risk of stroke in participants with diabetes (p<0.001), AF (p<0.001) and hypertension (p=0.001), but not MI. Stroke risk increased with increasing BP levels but was already seen for diastolic pressure grade 1 and particularly when combined with systolic BP grade 1; 1.62 (1.17 to 2.25).
Conclusions Hypertension, smoking, AF, diabetes and high BMI were associated with increased stroke risk. Low education was associated with stroke. Validation of National Patient Registry diagnoses to increase specified diagnoses improved data quality.
- PREVENTIVE MEDICINE
This is an Open Access article distributed in accordance with the Creative Commons Attribution Non Commercial (CC BY-NC 4.0) license, which permits others to distribute, remix, adapt, build upon this work non-commercially, and license their derivative works on different terms, provided the original work is properly cited and the use is non-commercial. See: http://creativecommons.org/licenses/by-nc/4.0/
Statistics from Altmetric.com
Strengths and limitations of this study
-
Well-defined population with a long follow-up time and high participation rate.
-
Detailed validation of stroke diagnoses to overcome difficulties through earlier more deficient precision in stroke diagnostics.
-
Limited number of participants partly compensated for by the high participation rate and rigorously structured follow-up.
Background
Stroke is a leading cause of death and disability worldwide, and our knowledge about stroke risk factors has increased considerably through large population-based1 and case–control studies.2 Rapidly increasing diagnostic and therapeutic possibilities have an impact on stroke morbidity, mortality and secular trends. However, there is a need for validation of data in longitudinal studies where the focus on stroke diagnoses may vary over time. Moreover, data from inpatient and cause of death registers can contain misclassifications.3 Here, we study stroke incidence in the Prospective Population Study of Women in Gothenburg (PSWG) over a period of 32 years with the focus on main subtypes. Our aim was to study first-ever and fatal stroke (FS) in women over 32 years of age with a focus on subdividing by stroke type, to consolidate end points and to examine associations with risk factors. Both classical risk factors and others concerning socioeconomic background and lifestyle were addressed.
Material and methods
Study population
The PSWG sample was recruited in 1968–1969 from the Revenue Office Register.4 Five age strata, 38, 46, 50, 54 and 60 years at baseline, were studied. A total of 1462 women were examined, with a participation rate of 90.1%. Follow-up examinations took place in 1974–1975, 1980–1981, 1992–1993 and 2000–2001. Details have previously been reported4 and are shown in the supplementary file. We present 32-year incidence data on first-ever stroke and stroke mortality from 1968–1969 to 2000–2001. For the purpose of the present study, two cases were excluded due to stroke before inclusion.
Classification of stroke
Stroke was defined using the WHO criteria.5 Since 1978, all hospital admissions are registered in the National Patient Register (NPR) and classification is based on the International Classification of Diseases (ICD 8 until 1986; ICD 9 until 1996, ICD 10 since 1997). Principal discharge diagnoses from the NPR were used. End points were defined as fatal or non-fatal ischaemic (IS), haemorrhagic (HS) and non-specified (NS) strokes. IS was defined as ICD codes 434 and I63, HS was defined as 431 and I61 and NS was defined as stroke not possible to subtype into IS or HS. Subarachnoid haemorrhage (SA) was excluded. For all cases with unspecified or uncertain NPR stroke diagnoses (432, I62 and 436, I64), medical records including reports from rehabilitation staff and nurses and CT scans and MRIs were scrutinised to validate the stroke and specify end points (IS, HS, NS). Records were also scrutinised from participants who had 433, 437, 438 and I67, I69 codes. Classifications were made by the first author and a secondary examination by the second author (ChB), an experienced stroke neurologist. Specified NPR IS and HS codes were accepted, but 10 patient journals chosen at random were examined and none contained diagnostic errors. Transient ischaemic attacks (TIA) with ICD codes 435 and G45 were also scrutinised to reveal possible IS among these, and further analyses were made among 433, 434 and I65, I66 to yield possible IS or TIA cases there. The remaining TIA cases were not included in the analyses. FS was defined as death within 1 month after the stroke without other primary causes of death.6 Death certificates, NPR diagnoses and complementary information from records provided support to ascertain FS and type when possible.
Potential risk factors for stroke
The PSWG included medical examinations, questionnaires, anthropometric data (body mass index (BMI) and waist–hip ratio (WHR)), blood tests (total cholesterol, serum triglycerides and b-glucose in the fasting state) and blood pressure (BP) measures (sitting position after 5 min rest) as described earlier in detail.4 Hypertension was defined as ≥160/≥95 mm Hg (each or both) and/or antihypertensive treatment. For comparison with modern guidelines,7 we further subdivided it into four BP (mm Hg) groups: a reference group (<140/<90), grade 1 (140–159 and/or 90–99), grade 2 (160–179 and/or 100–109) and grade 3 (≥ 180 and/or ≥110). Smoking habits were classified as smokers, ex-smokers and non-smokers. Socioeconomic status was based on women's reported own (or husband's) occupation. Education was divided into eight levels from elementary school1 to secondary education.8 Self-perceived mental stress was evaluated on a scale from 0 to 5: 0=no stress and 5=continuous stress in the past 5 years. In the analyses, stress was dichotomised such that >3 represented permanent stress during the past year. Leisure time physical activity was classified as ‘low’(1), ‘intermediate’(2), ‘high’(3) and ‘very high’ (4). In the analyses, leisure time physical activity was dichotomised using a cut-off point between 1 and 2, in order to study the effect of inactivity.
Statistical methods
Descriptive statistics are presented as frequencies and percentages. Association with stroke incidence risk was estimated by HRs and 95% CIs from Cox regression analyses in multivariate models including as covariates age and baseline data concerning hypertension, BMI, smoking, physical inactivity, cholesterol, triglycerides, mental stress and educational level. HRs were calculated for total stroke, IS, HS and FS. Significance was considered at p<0.05. Survival time free from stroke was calculated for diabetes, myocardial infarction (MI), atrial fibrillation (AF) and hypertension. Incidence was calculated crude and age-standardised per 100 000 person-years of first-ever stroke for women in PSWG between 1968 and 2001, using the Gothenburg female population in 2000 as the reference. Incidence rates were also calculated for age groups 38–54 and from 55 with 5-year strata from 55–59, up to 85–89, by dividing the number of strokes by the total amount of person years in each age category. Incidence rates are given with 95% CI. To illustrate the non-linear effect of BP level on stroke risk, figure 2 plots the model-predicted risk of total stroke from a third-degree polynomial function of systolic and diastolic BP, with age as a covariate.
Results
Stroke incidence
Of the 1460 women, 184 (12.6%) had a first-ever stroke during the 32 years of follow-up in this study, distributed as follows: 138 (9.5%) IS, 25 (1.7%) HS and 21 (1.4%) NS. Table 1 shows the age cohort incidence. Of 19 TIA cases according to the NPR, 5 were changed to IS through the validation process. The age-standardised incidence rate was 4.48/1000 person-years.
Incidence of non-fatal and fatal stroke during a 32-year follow-up of women aged 38–60 years at baseline 1968–1969
The incidence rate increased with age as seen in table 2. In the group 80–84 years, the incidence rate was sevenfold higher than in the group 60–64 years.
Stroke incidence calculated for age groups from 38–54 and over 5-year intervals to 85–89 years
Fatal stroke
Fatal first-ever strokes constituted 33 cases, with a total stroke mortality of 48 cases: 18% of the incident strokes were fatal (9% of IS, 52% of HS and 33% of NS; table 1). Using death certificates and NPR, 74 cases were scrutinised, whereby 16 could initially be dismissed as stroke diagnoses, and 10 cases had another more probable diagnosis (1 MI, 4 dementia, 1 status epilepticus, 1 diabetes, 3 heart failure).
Validation of unspecified or uncertain diagnoses
Unspecified diagnoses constituted 68 strokes, that is, 37% of total strokes. The validation process specified these as 42 IS, 1 HS, 3 SA, and 1 as Parkinson's disease. Owing to the lack of medical record confirmation, 21(11%) strokes remained classified as NS (table 1).
Potential risk factors
Age-adjusted HRs of potential risk factors for stroke and FS are shown in table 3. All variables except cholesterol and mental stress showed significant association with either IS or total stroke or both. The smaller HS group showed significant association only with physical inactivity. BP, WHR, smoking and physical inactivity had significant associations with FS. Multivariate Cox regression analysis (table 4) found significant associations between IS and BMI, and between smoking and low educational level. Hypertension was significantly associated with total stroke, but the association between IS and hypertension did not reach significance (HR 1.50, CI 0.99 to 2.27). The association between HS and physical inactivity remained significant. Smoking, BMI and physical inactivity significantly increased FS HR.
Cox regression analysis including potential risk factors for stroke at baseline
Multivariate Cox regression analysis including potential risk factors for stroke at baseline
Analysis of association between risk of stroke and BP levels showed associations. Systolic hypertension, 140–159 mm Hg, corresponding to grade 1 was not significantly associated with increased risk of stroke, whereas systolic hypertension, 160–179 mm Hg, corresponding to grade 2 showed a small non-significant increase (HR 1.35, CI 0.81 to 2.27). In contrast, systolic hypertension ≥180 mm Hg, corresponding to grade 3, showed a significantly higher risk of stroke compared with the reference group (HR 2.73, CI 1.62 to 4.60). Diastolic hypertension 90–99 mm Hg, corresponding to grade 1, was significantly associated with increased risk of stroke (HR 1.41, CI 1.00 to 1.97) as was grade 2 hypertension 100–109 mm Hg (HR 1.65, CI 1.02 to 2.67) and grade 3 hypertension ≥110 mm Hg (HR 2.02, CI 1.05 to 3.89). The reference group was normotensive, that is, <140/<90 mm Hg. Analysis between stroke risk and continuous BP level showed a significant linear association with diastolic pressure, but a deviation from linearity was seen for low and high systolic pressure (figures 1 and 2). When comparing the risk of having one of the BP levels increased with both systolic and diastolic pressure levels increased, the analysis showed significantly increased risk when both pressures were increased: grade 1 (HR 1.62, CI 1.17 to 2.25) and grade 2 hypertensions (HR 1.85, CI 1.19 to 2.88).
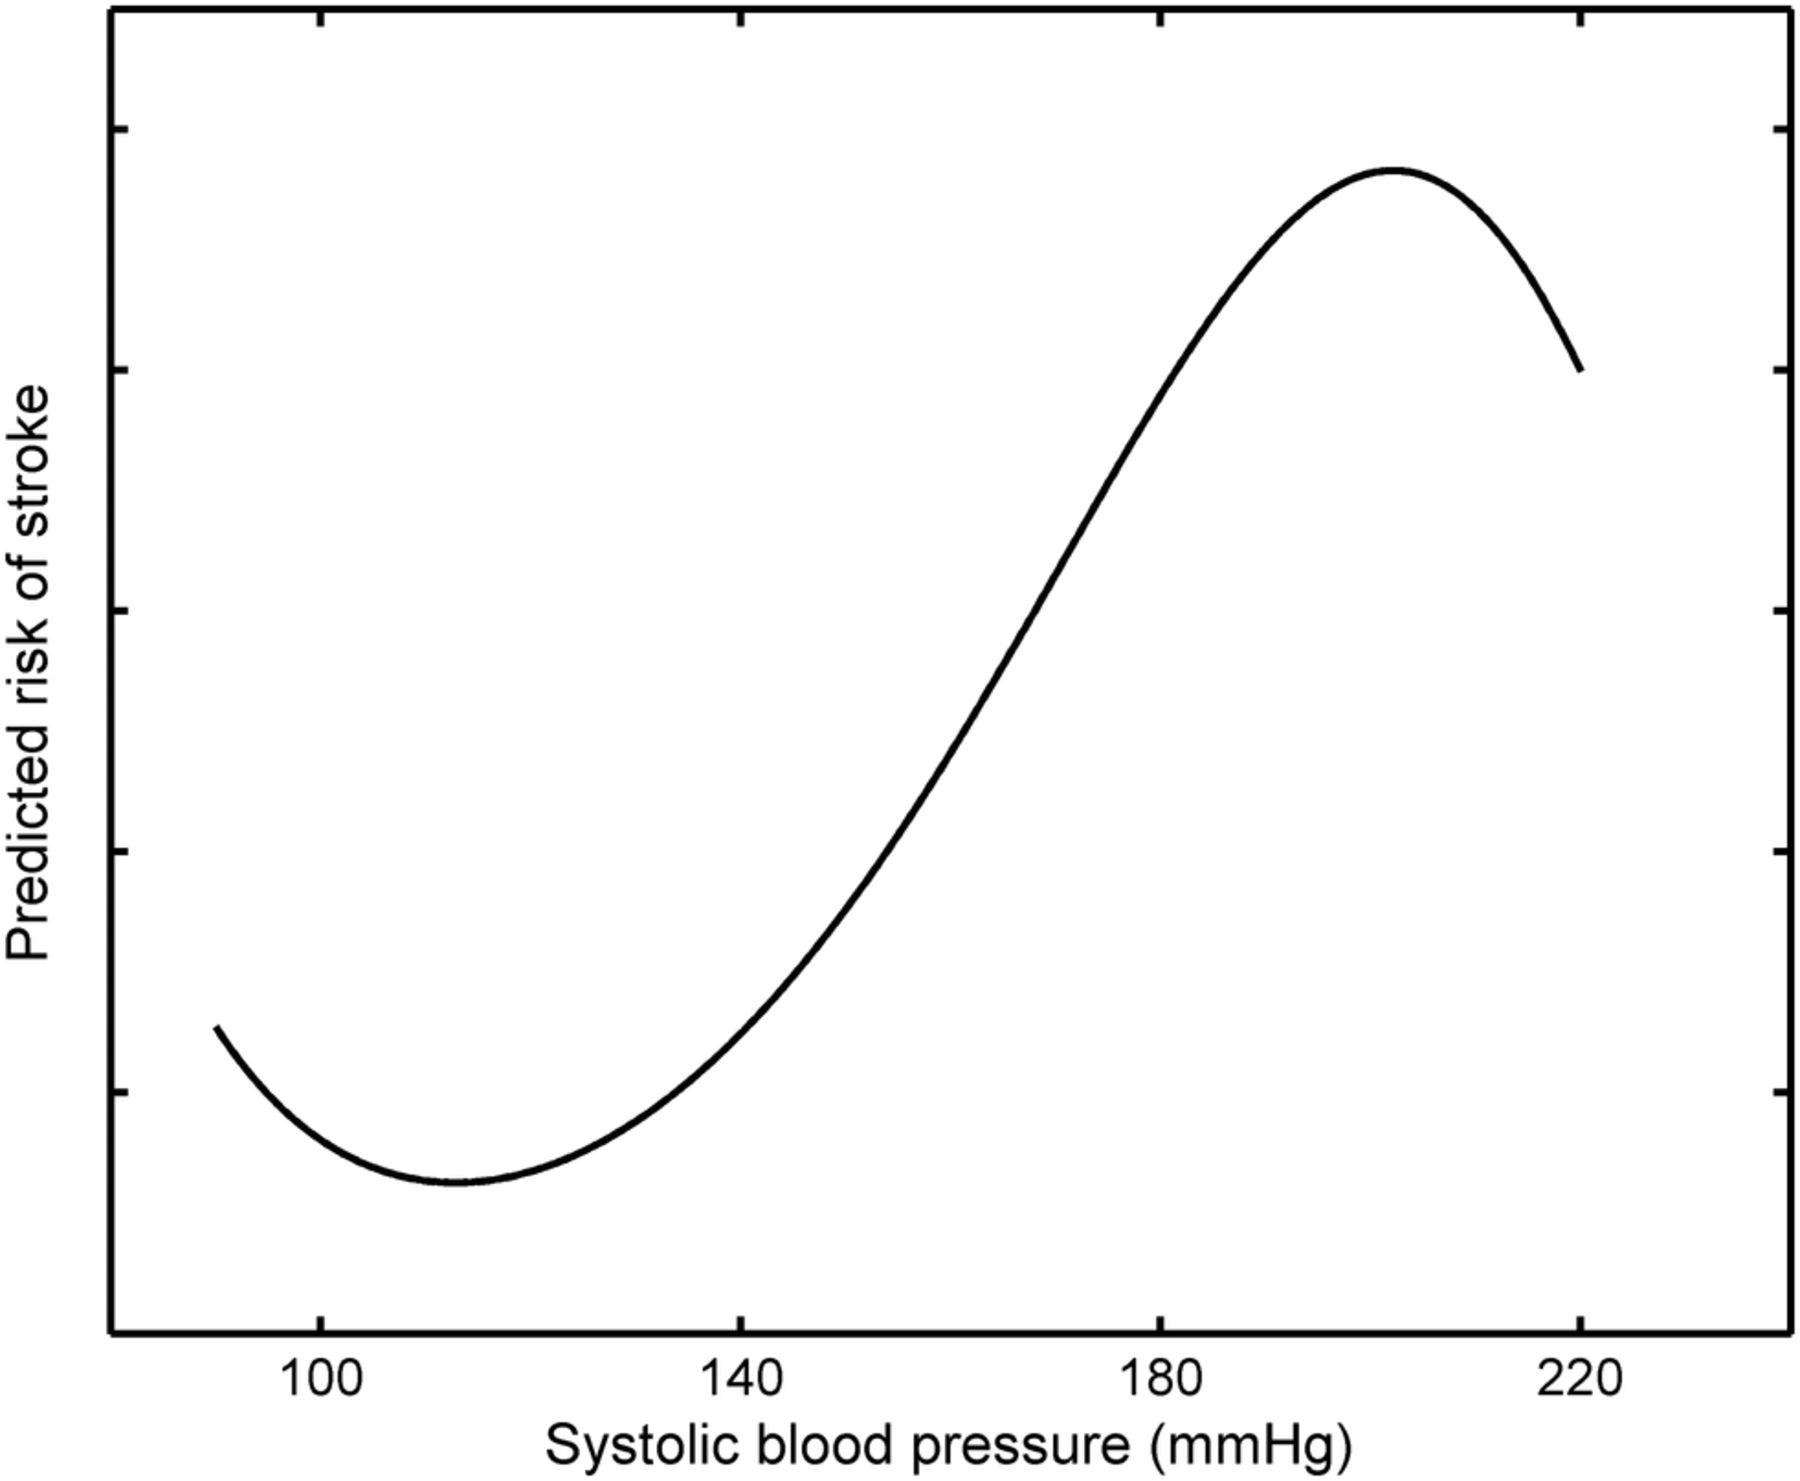
Plot for the model-predicted risk of total stroke from a third-degree polynomial function of systolic blood pressure with age as a covariate.

Plot for the model-predicted risk of total stroke from a third-degree polynomial function of diastolic blood pressure with age as a covariate.
The prevalence of medication for hypertension at any time during the follow-up period was 30% higher in the group with grade 1 hypertension at baseline compared with the reference group <140/<90 mm Hg at baseline.
MI, diabetes, AF and hypertension
The 32-year survival analyses showed significantly increased time free from stroke in individuals without concurrent diabetes (p<0.001), AF (p<0.001) and baseline hypertension (p=0.001), but not for MI (figure 3).

Thirty-two-year survival curves, based on the Cox regression analysis of stroke with and without myocardial infarction, diabetes, atrial fibrillation and baseline hypertension, respectively.
Discussion
PSWG is a unique longitudinal population study of women in five age strata, and here we report data from 32 years of follow-up. A validation process increased subtype diagnoses considerably such that the total incidence of stroke was 184 cases (12.6%) of which 33(18%) were fatal. Baseline BMI, smoking and low educational level were associated with IS, while smoking was associated with FS. Concurrent diabetes and AF were negatively associated with time free from stroke. Hypertension at baseline was associated with total stroke, but not significantly with subtypes. Stroke risk increased with increasing BP levels when viewed from a perspective of 32 years of follow-up time. Grade 1 systolic hypertension according to modern guidelines did not significantly increase the risk for stroke, grade 2 showed a tendency, while grade 3 showed a strong association with stroke risk. Diastolic hypertension grades 1–3 showed significant and increasing association with stroke risk and particularly combined with systolic hypertension.
As expected, stroke incidence increased with age and was somewhat higher in the higher age groups compared with rates for women in the Rotterdam Study,8 although the broad CIs in both studies do not allow any conclusions to be drawn regarding true differences between the rates. Our incidence rates were also comparable with another Swedish prospective study where the female average incidence rate was 400/100 000 person-years.9 Gold standards for studying stroke incidence have been described10 but comparison of incidence rates across studies is difficult.11 Great differences in incidence rates are due to several factors such as ages in different populations, ethnic and socioeconomic differences, varying criteria for stroke and different access to hospital facilities for securing diagnoses.
Identification of the main types of stroke is important since they differ concerning trends, risk factor associations and gender differences. Although stroke mortality and incidence has decreased in general, the trends vary in different age strata and by gender as observed for IS.12 Owing to the considerable change in diagnostic precision over time, we made considerable efforts to revise the NPR diagnoses through validation against clinical data from records and CT images. To avoid investigator biases, the diagnoses were set before subtype end points were included in the data set. This resulted in a 26% increase in specified stroke cases. A similar validation process was used to define FSs, given the low autopsy rate and often vaguely described death certificates. Clinical diagnoses in death certificates are often uncertain,3 particularly for patients dying outside hospitals. Accordingly, information was included from nursing homes, primary care and recent hospital admissions. In Sweden, only a few acute first-ever stroke cases have received care outside the hospitals even during the later decades of the 20th century.
A review of 56 population-based studies between 1970 and 2008 reports differences in secular trends in different countries.13 Stroke incidence increased by 100% in low-to-middle income countries but decreased by 42% in high-income countries.14 Large population studies show decreased stroke incidence during the past decades,1 but smaller decreases in women15 and also more severe stroke in women.16 The tendency among young age groups is more uncertain, particularly among women.11 A recent study in Sweden shows a declining incidence among the elderly but not among younger men and women.12 Differences in incidence rates have also been seen between different regions in Sweden.17 ,18
The results of the multivariate analyses showed a significant association between hypertension at baseline and total stroke. Hypertension is a strong risk factor for stroke2 and about 28% of incident stroke is attributable to untreated hypertension.19 The PSWG had a focus on cardiovascular risk factors, particularly hypertension, and it is likely that adequate treatment of hypertension could have led to an underestimation of the association with stroke in this study. Seventy-nine per cent of participants with hypertension diagnosis were on medication at some point during the 32-year follow-up, and 35% of the total cohort population in the PSWG were at some point on antihypertensive medication. AF was a strong risk factor for stroke, and increased focus is warranted particularly since women with AF who are not on warfarin treatment may have higher thromboembolic risk than men.20
Most of our findings are not novel and have been described in other studies. The significant association between BMI and IS and total stroke conforms to other studies,21–23 but increased risk for all stroke associated with WHR but not BMI has previously been reported.2 Similarly, abdominal obesity was associated with higher stroke risk in both sexes but was less pronounced in women.24 WHR measurement in women has been questioned25 and is controversial. In our study, WHR was associated with FS, but after multivariate adjustment this significance disappeared. Physical inactivity was associated with total stroke, HS and FS.
It is of interest that low educational level showed an independent association with IS, despite the lower proportion of well-educated women during 1968–1969. Kuper et al26 showed a gradient by years of education in women; low educational level was associated with smoking and alcohol. Earlier studies combining different aspects of socioeconomic status reported associations with stroke.19 ,27 In women the relationship was stronger than in men,19 but not in all studies.27 Smoking was associated with total stroke, IS and FS in accordance with other studies.2
The strength of our study is the well-defined and coherent population with a long follow-up time and high participation rate. High representativeness has been achieved by means of the sampling method and participation rate. Further, end point certification was made with the aim of obtaining reliable data through careful medical record examination. The combined ascertainment method increased data quality despite the limited number of participants and lack of trustworthy community and primary care registers concerning stroke. Earlier, the lack of diagnostic protocols caused difficulty in the classification of specific stroke types, and in longitudinal analysis, early and late cerebral events may differ in diagnostic precision, as reflected by NPR diagnoses.
Routine hospital discharge diagnoses have limitations as a sole basis for estimating stroke incident rates. The proportion of ‘false-positive’ stroke diagnoses at discharge may be as high as one-third of all diagnoses of stroke.28 Our validation of diagnoses partly resolved such risks. Despite the limited sample size, we could show that smoking, overweight and low educational level could influence future stroke risk besides hypertension. Higher stroke risk was seen for increasing systolic and diastolic BP levels in a long-term perspective. The low risk of grade 1 systolic hypertension7 in this study is compatible with present guidelines indicating that lifestyle intervention is a number one priority if no other risks are present. Our results strengthen the notion that early evidence-based lifestyle interventions should take into account women's socioeconomic background and educational differences besides classic risk factors.
Acknowledgments
The authors thank Valter Sundh for excellent statistical support and valuable contributions to the analyses.
References
Supplementary materials
Supplementary Data
This web only file has been produced by the BMJ Publishing Group from an electronic file supplied by the author(s) and has not been edited for content.
Files in this Data Supplement:
- Data supplement 1 - Online supplement
Footnotes
-
Contributors AB was responsible for collecting the data and for end point analysis of the diagnoses from the NPR registers and death certificates. She also wrote the first draft of the manuscript. For cases with uncertain and unspecified stroke diagnoses, records were scrutinised. AB, together with ChB, established end points. Classification was made by AB and a second examination by ChB. ChB was responsible for neurological knowledge with focus on stroke in all parts of the work. He contributed to the study design and participated in scientific analysis and the writing of the manuscript. NA contributed to the statistical analyses, data interpretation and production of the paper. CaB was the initiator of PSWG and was not only active since 1968–1969 in design but also participated in all the follow-ups. He contributed with genuine knowledge about the population and the database. CeB contributed to the study design, scientific analyses and writing of the manuscript. She is the guarantor of the study and, together with CaB, was responsible for the PSWG over decades.
-
Funding This study had financial support from the Swedish Research Council and Swedish Council for Working Life and Social Research (WISH 2007-1958).
-
Competing interests None.
-
Ethics approval The study was approved by the Regional Ethical Review Board at the University of Gothenburg.
-
Provenance and peer review Not commissioned; externally peer reviewed.
-
Data sharing statement Owing to restrictions from the Swedish Data Inspection Board, individual based data cannot presently be shared via, for example, the internet. General information about the Prospective Study of Women in Gothenburg can be reached at http://www.allmanmedicin.gu.se