Article Text

Abstract
Objectives To assess the 2009 National Dementia Strategy's (NDS) impact on dementia diagnosis and treatment.
Setting and participants Primary care data for England before and after launch of the NDS.
Primary outcome measures We used nationally available data to estimate the trends over time in rates of dementia diagnoses recorded on the Quality Outcomes Framework (QOF) in Primary Care Trusts (PCT) and antidementia medication prescriptions from 2006/2007 (the first available figures) and the associated increase in cost relative to all other prescriptions. To establish PCT general practitioner (GP) QOF dementia recording validity, we correlated it with medication prescription using the NIC (net ingredient cost).
Results Regression analysis showed that dementia diagnosis rate was lower prior to launch of the NDS and increased significantly after it was launched. The number of antidementia prescriptions and the cost of antidementia drugs relative to total PCT prescribing costs increased significantly after 2009. GP recording of dementia diagnosis correlated highly with prescription of cholinesterase inhibitors and memantine in the same area (p<0.001 each year).
Conclusions The launch of the NDS was associated with a significant increase in dementia diagnosis rates and prescriptions of antidementia drugs. We cannot establish the causality but this was a change from the prelaunch pattern. Further assessment of any intervention to increase the diagnoses should include an assessment of harm as well as potential benefit.
- Public Health
This is an Open Access article distributed in accordance with the Creative Commons Attribution Non Commercial (CC BY-NC 3.0) license, which permits others to distribute, remix, adapt, build upon this work non-commercially, and license their derivative works on different terms, provided the original work is properly cited and the use is non-commercial. See: http://creativecommons.org/licenses/by-nc/3.0/
Statistics from Altmetric.com
Strengths and limitations of this study
-
To our knowledge, this is the first study to examine the effect of healthcare policy on measurable health outcomes.
-
Owing to the nature of the intervention being studied, we could not establish causality.
-
The mechanisms of change in diagnostic and prescription rates following the policy launch remain unclear.
Introduction
The number of people with dementia is rising rapidly worldwide with increased life expectancy1 ,2 although the current cohort of older people may have slightly lower rates of dementia than their counterparts 20 years ago.3 Timely diagnosis of dementia can provide advice, treatment and support which empowers the person with dementia and their family, reduces crises and delays institutionalisation.4 It also leads to access to treatments, opportunities to take part in research, admission to specialist units when physically ill with a better experience of inpatient care5 and the ability to plan ahead.2 ,4 ,6 Nonetheless, diagnosis is often late in the illness and the majority of people with dementia are never given a diagnosis,7 even if they present to their general practitioner (GP) with symptoms.8 Consequently, early diagnosis is a key aim of current dementia policies in the Western world, including England's National Dementia Strategy9 but there is dispute about what strategies to use to increase the diagnosis rates, partly centring on the lack of definitive evidence to date on the efficacy of interventions to increase diagnosis6 or the usefulness of screening.10
Barriers to help-seeking for dementia include believing that the symptoms are due to normal ageing, lack of insight of the person with dementia,11 low levels of knowledge about dementia12 and a lack of confidence among GPs in discussing this diagnosis.7 ,13 ,14 The National Dementia Strategy (NDS) is the first UK government initiative to focus on improving dementia care through: raising awareness about the illness; encouraging earlier diagnosis and intervention (primarily by increased access to specialist diagnostic services) and increasing the quality of care that people with dementia receive.9 It was launched in February 2009 and £150 million of funding was allocated to Primary Care Trusts (PCTs; who at that time commissioned health services for their local areas) to help achieve these objectives. The additional funding was primarily intended to improve diagnosis rates and the quality of dementia care, partly through provision of extra memory clinics. National dementia awareness campaigns were also launched but no specific funding was provided for these.15
The NDS is for England, but similar strategies were published for Scotland in June 2010 and Wales in February 2011. Dementia awareness campaigns have been launched in many countries to improve awareness of dementia and reduce stigma, in order to improve detection rates,7 ,16 but none of these have been evaluated in terms of their impact on measureable outcomes for people with dementia and their family carers.
Increasing diagnostic rates is theoretically possible through targeting known barriers. Our recent systematic review of interventions to increase either the number of people with diagnoses or timely diagnosis found that increasing the number of memory services was correlated with higher rates of dementia diagnosis17 and that they diagnosed people earlier in their illness than traditional old-age psychiatry services.18 In this paper we aim to explore whether there was an increase in diagnosis rates after the NDS compared with the preceding period and whether there was a corresponding increase in the rate of prescription of antidementia medications (cholinesterase inhibitors and memantine).
Objectives
-
To assess whether the implementation of the NDS was associated with an increase in the rate of identification of people with dementia.
-
To assess whether the NDS was associated with an increase in the treatment of dementia with antidementia medications.
-
In addition, we aimed to consider the validity of dementia diagnoses on primary care registers.
Methods
Data description
We established the following figures in England from national databases and the Alzheimer's Society Mapping the Dementia Gap publications:
-
Annual national community-level prescribing data from 2003 to 2012 (calendar year).19
-
National hospital-level prescribing data from 2007 to 2011 (calendar year).20
-
Yearly prescribing data of antidementia medications at Primary Care Trust (PCT; an administrative body covering local primary care practices) level for 2008/2009 to 2011/2012 (fiscal year—April to March).21
-
Number of people diagnosed with dementia on general practitioner (GP) databases by PCT from 2006/2007 to 2011/2012 (these are recorded by GP practice as quality and outcomes framework (QOF) data, fiscal year).22
-
Estimated true number of people with dementia in each PCT from 2010 to 2012.23 ,24
We divided the number of GP-recorded dementia diagnoses (from QOF registers) by the estimated total number of people with dementia. We used the estimates in the Alzheimer’s Society reports of the actual prevalence of dementia in each PCT for 2010–2012. We calculated the prevalence of dementia for preceding years using the same method used by the Alzheimer's Society in their reports.23 ,24
As QOF data rely on GPs to enter dementia diagnosis onto their database, we wished to establish its validity, by comparison with an independent method of estimating the rate of dementia diagnosis, that is, with prescription levels for antidementia drugs calculated by:
-
Net ingredient cost (NIC): the cost of the drug before discounts which does not include any dispensing costs or fees.
-
Items dispensed: a prescription item refers to a single drug on a prescription so if a prescription form includes three medicines it is counted as three prescription items.25 The potential disadvantage of relying on this method of calculating costs is that regional or temporal differences in prescribing policy may exist, for example, prescribing for a maximum of 1 month versus prescribing for a maximum of 3 months at a time, which could affect the results significantly.
We used community NIC as hospital NIC data was only available from 2007, was a relatively small figure (approximately 10% of total) and changed over time at around the same rate. We adjusted the NIC for inflation as specified by the Bank of England inflation calculator26 to enable us to consider whether there were true differences between years. We correlated the NIC and the number of items dispensed to check whether they were similar. The correlation in 2008/2009 between the two was 0.974, in 2009/2010 was 0.968, in 2010/2011 was 0.965 and in 2011/2012 was 0.963 (all p values<0.001), so we concluded that they were very similar. We therefore report only NIC (as it would theoretically be less prone to variation over time and between districts) until 2012 when cholinesterase inhibitors came off-license as follows: Donepezil, February 2012; Galantamine, January 2012; Rivastigmine, July 2012.27
We removed Hertfordshire from the dataset in all PCT level data for prescriptions and diagnoses due to West Hertfordshire PCT and East and North Hertfordshire PCT merging into NHS Hertfordshire after 2009/2010.
PCT-level prescribing data rows ‘PCT unidentified doctors’ and ‘PCT unidentified deputising services’ were included when calculating totals but removed for comparison purposes with QOF data at PCT level. These data were never more than 0.06% of the total.
Statistical analysis
Numerical data were summarised using mean and SD or median and range depending on data distribution. We used Spearman's rank correlation to assess the monotonic association between two numerical variables.
Dementia diagnosis rates
We used negative binomial regression (NBR) models to assess the trend in diagnosis rates before and after the NDS, adjusting for cluster at PCT level. The NBR model is appropriate for count data and is similar to the Poisson regression model but is more appropriate in the presence of over-dispersion.28 The NBR yield estimates of incidence rate ratio (IRR) and 95% CIs, where an IRR value of 1 indicates no impact on diagnosis rates. We used total population at risk as the offset variable in order to adjust for variable population denominators.
Dementia drug prescriptions
We used NBR to assess the trend in the number of dementia drug prescriptions, before and after the NDS, adjusting for cluster at PCT level with the total number of prescriptions as the offset variable.
We used multilevel linear regression to examine the effect of NDS on the relative prescription cost, adjusting for cluster at PCT level.29 We used residual plots to investigate the assumptions of normality of residuals required by the multilevel models.
Validity of QOF figures
In order to explore whether areas with a calculated low diagnosis rate were explained by lack of recording of dementia diagnoses on the QOF registers, we assessed the relationship between dementia diagnosis rate and NIC costs per person diagnosed with dementia. If there was a bias in reporting then the mean NIC costs per person diagnosed with dementia would be higher than in other areas. We categorised diagnosis data and prescription data into quartiles and then assessed the Spearman's correlation between them.
All models are fitted with year as a fixed effect. Descriptive analyses were carried out in SPSS V.20. All models were fitted in Stata V.12.
Results
Dementia diagnosis numbers and percentages
The number of people with a dementia diagnosis in England appeared to be similar from 2006 to 2008 but increased every year after 2008. This is shown in figure 1. Dementia diagnosis percentages are available online as a data supplement.

English National diagnosis numbers, 2006/2007 to 2011/2012. *y Axis begins at 200 000 as this was the baseline for numbers on the quality outcomes framework.
Dementia diagnosis rates
Table 1 shows the median number of recorded dementia diagnoses per PCT, the mean proportion of dementia diagnosed per PCT and change in the mean number diagnosed per PCT compared with the previous year, from 2006 to 2012.
Numbers and percentages of people diagnosed with dementia per Primary Care Trusts (PCT per year)
Regression analysis showed that dementia diagnosis rates were lower in 2006–2008 compared with 2009, as shown in table 2. The dementia diagnosis rate increased by an estimated 4% in 2010 (IRR 1.04, 95% CI 1.03 to 1.05) and 12% in 2011 (IRR 1.12, 95% CI 1.11 to 1.13) compared with 2009.
Results of regression analyses for dementia diagnosis and antidementia drug prescriptions
Validity of QOF dementia diagnosis data
Dementia diagnosis rates were highly correlated with the prescribing data (see table 3). We divided PCTs into quartiles based on their dementia diagnosis rates and correlated these with the NIC (see table 4). PCTs in the quartile with the lowest diagnosis rates had lower correlations with the NIC than those with the higher diagnosis rates but this was not explained by higher prescribing costs per person diagnosed.
Spearman's rank correlation between numbers of people with dementia diagnoses on PCT quality outcome framework register with PCT level prescription data
Spearman's rank correlation between dementia diagnosis rates divided into quartiles and prescription costs
Antidementia drug prescriptions
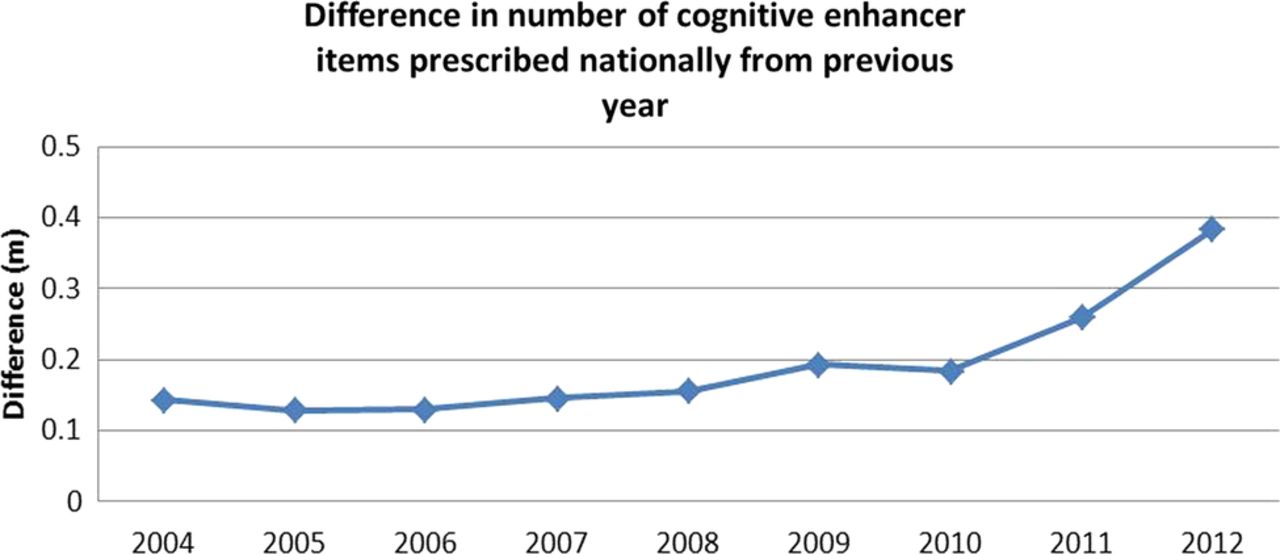
The rate of prescriptions of antidementia drugs has increased dramatically since 2010 (see figure 2). There was a down-tick in 2012 in cost (see figure 3) although not in the number of prescriptions.

Rate of increase in cognitive enhancer prescriptions over time.

National community net ingredient cost 2003–2012.
Regression analysis showed that the number of antidementia drug prescriptions increased significantly after 2009. The cost of antidementia drugs relative to total PCT prescriptions costs also increased significantly after 2009. All of these results are shown in table 2.
Discussion
Overall, these results indicate that launch of the NDS is temporally linked to an increase in the diagnosis rates and in prescriptions of antidementia medications in England. We found that the mean number of dementia diagnoses per PCT per year (as reflected in GP recording of the diagnosis on their QOF register) and dementia diagnosis rate increased from the year the NDS was launched. Prior to this, there was no clear increase in the number of diagnoses since records began in 2006/2007; therefore, the change does not seem to be just a continuation of a trend that was already occurring or established.
National spending on antidementia medication has also been increasing over time. There was a significant increase in the mean NIC every consecutive fiscal year since 2008/2009 with the decrease in 2012 probably due to the lapsing of patents of cholinesterase inhibitors in England, as prescription numbers continued to increase. We found a larger increase in items prescribed in 2010, the year after the NDS was launched and following the National Institute for Health and Care Excellence (NICE) guideline amendment in August 2009 to allow prescription of cholinesterase inhibitors for mild dementia. The costs of antidementia medications as a proportion of overall spending in PCTs also significantly increased following the launch of the NDS.
The mechanism of this change in diagnostic rates and prescriptions is unclear. The NDS involved provision of additional funding to PCTs. A government review of how this was spent found that less than half of PCTs responded to the survey, of which two-thirds were unable to say where they had allocated the money. Those who could comment on spending mostly prioritised funding memory services and early diagnosis.30 It is unlikely that those who were unable to say where it was spent used it for dementia and thus it appears that most of the funding was not used for the intended purpose. Therefore, increased spending seems unlikely to be the sole mechanism of change. It is, however, clearly essential to fund services in line with growing demand and ideally this funding should be ringfenced.31
The other two elements of the NDS were national dementia awareness campaigns and addressing the quality of dementia care partly through the establishment of memory clinics. A memory clinic survey with an 80% response rate found that the number of people using memory services in each PCT was 1.5 times higher in 2010/2011 than in 2008/2009.32 In England, consistent with the NICE guidelines, most of the GPs do not diagnose dementia and initiate medication. An increase in diagnosis rates therefore indicates an increase in specialists’ diagnoses, probably in memory clinics as they are now the assessment and diagnosis route in most services for people with suspected dementia. This accords with previous reports of an increase in numbers diagnosed with dementia with the establishment of memory clinics.17 ,33 Nationally and internationally, relabelling mental health services as ‘memory clinics’ may also reduce the barrier to diagnosis caused by the stigma of attending mental health services.34
It may also be that GPs’ and the public's opinion about obtaining a dementia diagnosis has changed with the national awareness campaigns, meaning GPs are more willing to suggest the possibility of the diagnosis and refer patients who are more willing to have further assessment, but we were unable to find evidence about opinion stability or change.
Strengths and limitations
To our knowledge, this is the first study to test the effect of government policy on measureable outcomes in dementia. This is an area that deserves further study to ensure the best use of resources in managing dementia and other illnesses.
The QOF provides a financial incentive for GP practices to create and maintain a register of patients with dementia. It is a voluntary reward scheme and there has been some debate about whether it provides an accurate estimate of numbers diagnosed with dementia. We tested its validity and found the QOF data to be highly correlated with prescriptions for antidementia medication, indicating that it is a valid measure of the number of people diagnosed with dementia. There is still a significant amount of variance in prescription which is unexplained by diagnosis rate. However, areas which had low diagnosis rates did not have higher prescription rates per person diagnosed with dementia, indicating that there is not a systematic omission of people with dementia from the QOF register in these areas. Although antidementia drugs are recommended in the UK across all the dementia severity ranges and there is no reason to think that the proportion of people with Alzheimer's dementia varies across areas, we do not know whether some practitioners prescribe in different ways. However, our analysis finds no systematic pattern in the PCTs with low dementia diagnosis percentages and therefore suggests that the low rates are not accounted for only by a failure to record diagnosis.
Owing to the nature of the intervention being studied, we could only establish associations and temporal links between the launch of the NDS and outcomes. It may be that there is another explanation for the changes, including a change in peoples’ perceptions about dementia. This could account for the launch of the NDS and the change in diagnosis and prescription rates. Also, the NDS is a policy change with a wide remit and regional variation in its application. It is therefore difficult to say with any certainty which aspect of the NDS may account for the changes in outcomes we have seen. Finally, all our data were retrospective and not specifically collected with the aim of assessing the impact of the NDS, therefore systematic error cannot be ruled out.
Although we did not have any data on the timeliness of the dementia diagnoses being made, if the increase in dementia diagnosis is due to more diagnoses being made in memory services, these diagnoses are likely to be more timely.18
Policy and research implications
More than half of people with dementia are still not diagnosed and others are diagnosed late in the illness and therefore do not have the benefits of timely diagnosis described above. If more diagnoses for dementia are made in a timely manner, this should improve individual experience of the illness and have positive implications for health and social care costs. Further effective interventions to increase the number of timely dementia diagnoses are still needed and these interventions should consider harm in terms of anxiety increase in the ‘worried well’ as well as benefit and cost. As more antidementia drugs come off-license in the UK, costs associated with earlier diagnosis of dementia could fall despite an increase in the number of prescriptions, which could be an important factor in assessing the costs and benefits of future interventions.
Our results suggest that government policy has a significant effect on the number of people diagnosed with dementia and prescription of antidementia drugs but this is unlikely to be due only to additional funding. In particular, more people have accessed the rebadged memory services than mental health services and it may be important to consider the publics’ perception of services as well as their funding and operation.
Acknowledgments
The authors are very grateful to the Alzheimer's Society for their help in understanding and processing dementia diagnosis data.
References
Supplementary materials
Supplementary Data
This web only file has been produced by the BMJ Publishing Group from an electronic file supplied by the author(s) and has not been edited for content.
Files in this Data Supplement:
- Data supplement 1 - Online supplement
Footnotes
-
Contributors SR found and imported the relevant data. NM, GL and SR wrote the first draft of the manuscript and NM is the guarantor. All authors analysed the data. All authors contributed to and agreed to the final version.
-
Funding The authors received no funding for this research. NM is funded by the NIHR.
-
Competing interests None.
-
Provenance and peer review Not commissioned; externally peer reviewed.
-
Data sharing statement No additional data are available.