Article Text

Abstract
Objective To examine the between-hospital variation of charges and discounted prices for uncomplicated vaginal and caesarean section deliveries, and to determine the institutional and market-level characteristics that influence adjusted charges.
Design, setting and participants Using data from the California Office of Statewide Health Planning and Development (OSHPD), we conducted a cross-sectional study of all privately insured patients admitted to California hospitals in 2011 for uncomplicated vaginal delivery (diagnosis-related group (DRG) 775) or uncomplicated caesarean section (DRG 766).
Outcome measures Hospital charges and discounted prices adjusted for each patient's clinical and demographic characteristics.
Results We analysed 76 766 vaginal deliveries and 32 660 caesarean sections in California in 2011. After adjusting for patient demographic and clinical characteristics, we found that the average California woman could be charged as little as US$3296 or as much as US$37 227 for a vaginal delivery, and US$8312–US$70 908 for a caesarean section depending on which hospital she was admitted to. The discounted prices were, on an average, 37% of the charges. We found that hospitals in markets with middling competition had significantly lower adjusted charges for vaginal deliveries, while hospitals with higher wage indices and casemixes, as well as for-profit hospitals, had higher adjusted charges. Hospitals in markets with higher uninsurance rates charged significantly less for caesarean sections, while for-profit hospitals and hospitals with higher wage indices charged more. However, the institutional and market-level factors included in our models explained only 35–36% of the between-hospital variation in charges.
Conclusions These results indicate that charges and discounted prices for two common, relatively homogeneous diagnosis groups—uncomplicated vaginal delivery and caesarean section—vary widely between hospitals and are not well explained by observable patient or hospital characteristics.
- HEALTH SERVICES ADMINISTRATION & MANAGEMENT
- OBSTETRICS
This is an Open Access article distributed in accordance with the Creative Commons Attribution Non Commercial (CC BY-NC 3.0) license, which permits others to distribute, remix, adapt, build upon this work non-commercially, and license their derivative works on different terms, provided the original work is properly cited and the use is non-commercial. See: http://creativecommons.org/licenses/by-nc/3.0/
Statistics from Altmetric.com
Strengths and limitations of this study
-
Uses a comprehensive dataset of all visits to California hospitals and links to patient and institutional characteristics, allowing for analysis over a complete population.
-
Employs a two-stage analysis which enables control for individual patient characteristics and isolation of between-hospital variation of charges for childbirth.
-
Limitations include use of aggregate discount rates to estimate discounted prices paid, potential residual patient-level variation in care intensity and the inability to completely capture hospital quality.
Background
USA healthcare expenditures totalled US$2.7 trillion dollars in 2011 – representing 17% of US gross domestic product—and are projected to rise steeply in future years.1 Unlike most other industries, the way healthcare is priced and paid for is notoriously opaque, making it difficult for patients to act as educated, price-comparing consumers.2 At a time when out-of-pocket payments for healthcare are increasing,3 and the growing number of ‘consumer-directed’ high deductible health plans put more pressure on patients to make cost-efficient healthcare decisions,4 ,5 the opacity of healthcare pricing is increasingly concerning.
Recently, hospital charges have come to the forefront of political, popular and medical discourse due to their inexplicable magnitude and devastating effects on specific patients.6–8 While insurers typically negotiate lower reimbursements, these full, inflated charges are still billed to the 22% of American adults aged 19–64 who are uninsured and to privately insured patients receiving care out of network,9 ,10 contributing in large part to the 57% of US bankruptcies that result from medical bills.11 Furthermore, the charges indirectly affect healthcare pricing for all patients. Many private insurers use charges as the basis of price negotiations7 ,12 ,13; Medicare uses charges in determining inpatient diagnosis group weighting and outlier payments,14–17 and also must adapt their prices to private-sector prices.18 In addition, hospitals use charges in calculations of uncompensated care, which affect their non-profit status and thus many aspects of their business model, participating insurance plans, and prices.19 ,20
Yet despite their consistent use in many forms of healthcare price setting and hospital bills, charges appear to be nearly random, and are either based on outdated historical methods or set using idiosyncratic proprietary formulas.12 ,13 ,21 One hospital administrator called his hospital's method of setting charges ‘madness.’22 The academic literature has supported this assumption; studies have documented the wide variation in hospital and physician charges and payment rates for the average inpatient stay.23 Past economics literature has attempted to discern some methods to charge setting by documenting the relationship between hospital payment rates and industry organisation, and has found, for example, that less competitive markets have higher predicted prices.24 ,25 These studies, however, have mostly addressed broad price indices based on aggregate hospital charges.
Given the wide range of procedures and diagnoses that comprise hospitals’ inpatient censuses, it is important to evaluate specific, common episodes of care that should have less variation in charges, and are more relevant to patients presenting with a symptom and no knowledge of the specific services they will need. An ideal service is childbirth, the most common reason for hospitalisations in the USA,26 accounting for 4.2 million inpatient stays and US$16.1 billion in hospital costs in 2008.27 Recently, a study by Truven Health Analytics28 looked at both charges and discounted prices nationally for vaginal and caesarean childbirth using their own proprietary database of paid medical claims, finding significant variation in charges and reimbursements. However, the study does not address the possible sources of the variation in charges that it documents.
In this study, we sought to fill this gap by documenting and attempting to explain between-hospital variation in charges for the same, average woman's inpatient stay for vaginal birth or caesarean section in California—relatively homogeneous episodes of care. Our analysis is based on the theory that the variation in charges for these homogeneous episodes of care, once adjusted for patient characteristics, is potentially explained by measurable hospital and market characteristics that govern hospital charge-setting behaviour. We first predict charges and estimated prices paid at each hospital after adjusting for patient characteristics, and then explore whether hospital or market-level characteristics can explain some of this charge variation.
Methods
Data source
We used the 2011 California Office of Statewide Health Planning and Development (OSHPD) public Patient Discharge Public Data Set (PDD) to perform our cross-sectional analysis. The OSHPD PDD captures patient demographic and clinical information, along with charges, for each inpatient encounter at California hospitals. Our study was exempt from review by the Committee on Human Research at the University of California, San Francisco because we used a public data source that was masked for identifiers.i
To capture hospital-level characteristics, we used OSHPD's hospital financial and utilisation files for 2011. We also used the 2009 Area Resources File,29 the most currently available year, to obtain county-level area percent of uninsurance and poverty, and the Impact Files from the Centers for Medicare and Medicaid Services (CMS) to obtain a hospital wage index.30
Sample selection
We limited our study to adult women (≥18 years) who were admitted for diagnosis-related group (DRG) 775 (uncomplicated vaginal delivery) or 766 (uncomplicated caesarean section) at short-term general California hospitals. Also, we included only privately insured women (47.5% of DRG 775; 47.1% of DRG 766), as our estimated discount rate only applies to them. Patients admitted to federal hospitals (eg, Veterans Administration hospitals) are not in our data as OSHPD reporting requirements do not apply to such hospitals. Also, privately insured women who receive care through the Kaiser Permanente network were excluded, as Kaiser hospitals do not report charges to the state (29.4% of DRG 775; 19.7% of DRG 766).
To restrict our sample to a relatively healthy and more homogenous population, we excluded patients who died in the hospital or who did not have a routine discharge. We further excluded patients without a valid age group or gender recorded, as we could not accurately adjust for their demographic predictors of charge. We also excluded patients with invalid charges, those receiving charitable care and those with charges too large to fit within the charge variable's character limit. Finally, we excluded patients visiting hospitals that did not report a wage index. See figure 1 for a full description of the applied exclusions.

Sample selection.
Outcome
Our first outcome was hospital charges, which are the total dollar amounts billed by the hospital for each admission, excluding physician fees. These charges reflect the hospital's full, established rates before contractual adjustments and prepayments.
Our secondary outcome was discounted prices, or the estimated amounts which hospitals received from private insurers for the services their enrollees received. We obtained this by multiplying the total charge billed to the patient with the hospital's discount rate for privately insured patients. As carried out in previous literature, the discount rate for privately insured patients at each hospital was calculated using the formula: (gross inpatient revenue+gross outpatient revenue−contractual adjustments)/(gross inpatient revenue+gross outpatient revenue).24 ,31 We obtained these amounts through the 2011 OSHPD financial files for each hospital.
Statistical analysis
Our analysis is similar to the two-stage approach used by previous economic analyses.24 ,32 The approach first separates out patient-level charge variation within each hospital and estimates childbirth charges for the average California woman at each hospital, and then looks at the independent influence of the hospital and market characteristics on variation in those estimated charges across hospitals. Estimates from this two-stage approach can be mapped to estimates from hierarchical models, in the sense that they allow for random effects in the intercept coefficient. However, for our purposes, the two-stage model is preferable because we are interested in explaining variation in expected charges using observable hospital characteristics. For all analyses, charges are logged to account for the right skew. We performed separate analysis for each DRG.
In the first stage, to control for patient-level variation in charges, we regressed logged raw charges on patient characteristics shown in previous literature to be correlated with price indices and line item charges.33 ,34 Patient characteristics included age (in 2 categories: 18–34 and ≥35), the number of conditions present on admission, Charlson comorbidities, and the length of stay. We chose the 18–34 and ≥35 maternal age groups because 35 years old is the cut-off at which the American Congress of Obstetricians and Gynecologists generally defines ‘advanced maternal age,’ which has been associated with increased risk of complications for the mother and the infant.35–37 As the length of stay is also often right-skewed, we transformed it to log (length of stay+1). We included three different types of private insurance, including two forms of managed care (Knox-Keene/Medi-Cal County Organised Health System, or other) and traditional private coverage. To control for unobservable within-hospital factors that could affect the variation, we also included a dummy variable for each hospital. Errors from this regression are clustered at the hospital level. Results of these regressions are shown in online supplementary tables S1 and S2.
From this regression, we then calculated a given hospital's adjusted charge for the average statewide patient for that DRG, where the adjusted charges represented standardised log charge/(day+1). This gave us a single adjusted charge per day for each hospital, representing the predicted charge for a patient with the same, average clinical and demographic characteristics, which we then used as the dependent variable in our second-stage regression.
In the second stage, we regressed our adjusted logged charges on hospital and market-level factors cited by previous literature as related to broad price indices,24 ,32 ,38 to determine which characteristics explain observed between-hospital variation in charges for childbirth. Hospital-level factors included ownership (not for profit, for profit and government), teaching status, urban/rural location, capacity (number of licensed beds), patient payer mix (proportion Medicare, Medicaid), and casemix (which was used to adjust the average cost per patient for a given hospital relative to the adjusted average cost for other hospitals).39 We also incorporated three quality measures from the Agency for Healthcare Research Quality's Inpatient Quality Indicators (IQIs): caesarean delivery rate, vaginal birth after caesarean rate (uncomplicated) and primary caesarian delivery rate.40 These utilisation indicators are intended to capture either overuse of procedures found to be unnecessary or low quality, or underuse of procedures with merit, such as vaginal birth after prior caesarean delivery.41 We further incorporated market-level factors including the wage index, percent uninsured in the county, percent below the poverty line in the county and the system-wide Herfindahl-Hirschman Index (HHI).
The HHI is a widely used economic measure of the degree of competition faced by a company, or in this case hospital, within its market.42 It is calculated as the sum of the squares of market shares for each hospital in a given market. Higher HHIs are associated with less competition, while lower HHIs indicate more competitive markets. We calculated these shares of patients directly from the hospital discharge data. Our HHI calculation also accounts for membership in a hospital system, which has been shown to influence hospital price setting.38
Results
Sample
We analysed a sample of 76 766 uncomplicated vaginal deliveries and 32 660 uncomplicated caesarean sections in 2011 across 198 and 195 California hospitals, respectively. As shown in table 1, 78.4% of women with uncomplicated vaginal deliveries were between the ages of 18–34, and 97.9% had a Charlson comorbidity index of 0, indicating that they were relatively healthy. The length of stay for 77.8% of these women was less than 3 days. For the 32 660 women with uncomplicated caesarean sections (table 2), the majority (69.5%) were again between ages 18 and 34, almost all (97.2%) had a Charlson comorbidity index of 0, and 77.5% had a hospital stay between 3 and 6 days. For both DRGs, the majority of hospitals were not for profit, non-teaching hospitals located in urban areas.
Characteristics of study sample for uncomplicated vaginal deliveries (diagnosis-related group 775)
Characteristics of study sample for uncomplicated caesarean sections (diagnosis-related group 766)
Charges
We found that the raw charges for uncomplicated vaginal birth ranged from US$3344 to US$43 715, with a median charge of US$15 278 (IQR US$7981). Once adjusted for patient clinical and demographic characteristics, charges for the average patient ranged from US$3296 to US$37 227, depending on which of the 198 hospitals she visited (median US$14 620; IQR US$7643). For uncomplicated caesarean sections, the raw charges ranged from US$7905 to US$72 569, with a median charge of US$27 517 (IQR US$14 206). Adjusted charges ranged from US$8312 to US$70 908, with a median charge of US$27 481 (IQR US$12 525), again for a patient with the same average characteristics.
Estimated discounted price
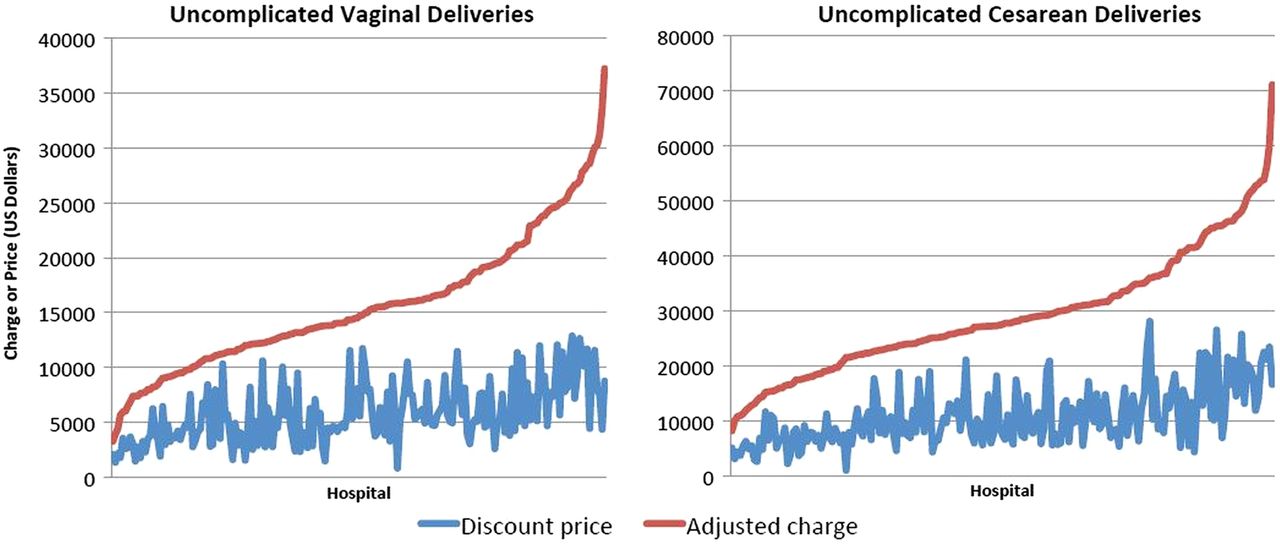
Discounted prices paid by private insurers ranged from 5% to 92% of the charge, with an average of 37%. Discounted prices for vaginal deliveries ranged from US$835 to US$12 873 (median US$5123; IQR US$3827), and prices for caesarean sections varied from US$1135 to US$28 105 (median US$9640; IQR US$6631). For vaginal births, the largest difference between a hospital's adjusted charge and estimated discount price was US$29 217, where it charged US$33 593 for an average patient, almost eight times the US$4376 it finally received from insurers. The smallest difference was just US$920, where the hospital's average charge (US$11 251) was a mere 109% higher than its estimated price (US$10 332). For uncomplicated caesarean sections, the differences were even more dramatic—one hospital charged 1899% of what it typically received, while another charged 124%. Figure 2 illustrates the differences between the adjusted charges and discounted prices for each hospital in our dataset for the two conditions.

Adjusted charges and discount prices for uncomplicated vaginal deliveries and uncomplicated caesarean sections across California hospitals, 2011.
Hospital and market-level factors
In the multivariate model using adjusted charges across hospitals as the dependent variable, hospitals with for-profit ownership, severe casemixes and high wage indices charged significantly more than their counterparts for uncomplicated vaginal delivery (table 3).
Regression of adjusted charges on hospital and market characteristics for uncomplicated vaginal deliveries
For uncomplicated caesarean section (table 4), charge was associated with ownership. Government-owned hospitals had 14.6% lower charges (95% CI −29.8 to 0.6), while for-profit hospitals had 17.2% higher charges (95% CI 3.2 to 31.2) than non-profit hospitals. This implies that if the mean charge for uncomplicated caesarean section, US$29 480, was offered at a non-profit hospital, the adjusted charge in a government hospital would be US$25 176 and the adjusted charge in a for-profit hospital would be US$34 551. Also similar to our findings with uncomplicated vaginal births, hospitals with higher labour costs (wage index) had higher charges. The casemix was no longer predictive, but a higher rate of percent uninsured in the county was significantly correlated with lower charges. Though the significance was marginal, the proportion of patients covered by Medicare was also associated with higher charges.
Regression of adjusted charges on hospital and market characteristics for uncomplicated caesarean sections
Discussion
Our results demonstrate the wide variability of charges and prices for childbirth between hospitals, even after controlling for patient characteristics, and point to specific institutional and market-level factors that affect those standardised charges. Even after adjusting for patient demographic and clinical characteristics, we found that charges for vaginal births ranged from US$3296 to US$37 227, and charges for caesarean sections ranged from US$8312 to US$70 908, depending only on which hospital the average California woman giving birth visited. This implies that, after adjusting for patient characteristics, the highest hospital charge was more than 11 times that of the lowest hospital charge for vaginal births, and more than 8.5 times that of the lowest hospital charge for caesarean section births. Without adjusting for patient characteristics, the hospital with the highest charges would charge about 13 times more than the hospital with the lowest charges for vaginal births, and about 9 times more than the hospital with the lowest charges for caesarean sections. While the variation of adjusted charges is, as expected, smaller than the variation in raw charges between hospitals, the very small difference between the two implies that service-intensity and patient observable factors provide little explanation for variation in charges between hospitals.
Our findings show that some hospital and market-level factors, on the other hand, do clearly impact the differences in charges between hospitals. We find a positive relationship between charges for childbirth and hospital wage index, casemix index and for-profit ownership. However, it is probably more notable how few of the hospital and market-level regressors are significant in explaining the variation. Our vaginal and caesarean delivery models account for only 36% and 35%, respectively, of the variation observed between hospitals in adjusted charges. This implies that the variation is a result of either (1) unobservable hospital characteristics or (2) pure noise.
On the basis of findings from the existing literature, we hypothesise that the variation we find is more likely random than due to unobservable hospital characteristics. A MedPAC study of hospitals found that many items on chargemasters were based on historical prices, which were formulated before it was possible to accurately estimate the costs.21 Even recently, the survey found that only one-third of hospitals reported any concern regarding covering operating costs when updating their chargemasters. Rather, most of the hospitals were concerned with conforming to regulations and maintaining their overall bottom line.21 Currently, even for new services, providers are not incentivised to set charges based on costs, because third party payments are largely not based on true costs for a given service.12 ,23 This, therefore, precludes a valuable correlation between cost and charge and thus an anchor on which charge variation would be limited.12 In addition, the current lack of correlation between cost and charge is exacerbated by simplistic ‘updates’ in the form of across-the-board percentage increases of charges, often resulting in certain services subsidising others to manage the overall solvency of the hospital or department.12 ,21 ,43 Thus, our results again confirm the documented lack of comprehensible or at least measurable sense in the chargemaster system.
The troubling part of this largely random variation is that charges do still matter to patients and to hospitals in many ways. The 41.9 million uninsured Americans along with privately insured patients visiting an out-of-network hospital may be faced with the full charges for their care, which are typically so high that few patients can pay them, resulting in need for charity care, sliding scale payments or often bad debt on the patient's part.13 ,44 In addition, as some private insurers still negotiate discounts off charges, especially in fee-for-service systems, and use charges to benchmark the relative weights in their prospective payment systems, higher charges can lead to higher out-of-pocket payments for patients.3 ,12 ,13 Medicare also compares charges between DRG groups modified by cost-to-charge ratios calculated at the cost centre level to determine the relative weight of DRGs and identify qualifying outlier payments within DRGs.14–17 Finally, many hospitals use charges to calculate their uncompensated care costs, which affect their not for profit and hence tax exempt status. In fact, the Internal Revenue Service (IRS) found that 18–20% of hospitals include the difference between charges and allowed payments by private insurers, and 50% include the difference between charges and payments received from the uninsured in their uncompensated care calculations.19 ,20
A secondary finding in this study is the large discrepancy between hospitals’ predicted charges and their estimated discounts. Our finding that insurers pay, on an average, 37% of charges is supported by previous literature showing that private insurers pay, on an average, 39% of the charge for hospital inpatient services.45 ,46 We estimated median payments of US$5123 for vaginal and US$9640 for caesarean section births, slightly lower than the Truven estimates of US$8519 and US$12 894, respectively.28 The difference between the adjusted charge and discounted price estimates what could be considered ‘excess charges’, and in 2011 this sums to US$1.36 billion dollars for all uncomplicated vaginal and caesarean births in California (US$760.1 million for uncomplicated vaginal deliveries; US$601.1 million for uncomplicated caesarean sections).
Past literature has speculated three reasons for high charges relative to reimbursements. First is the change in Medicare's reimbursement protocol from the historical cost-plus reimbursement system to the current prospective payment system.43 As providers were paid a percentage above the charged rate, it was in the providers’ financial interest to maintain exorbitant charges, a practice that has persisted despite the change in reimbursement. Second, in fee-for-service payments for which reimbursements are simple discounts of charges, hospitals are incentivised to raise their charges in an effort to increase reimbursement. Finally, hospitals may be setting artificially inflated charges to increase the nominal value of their uncompensated care indices, which are based on charges.20 ,47
Limitations of research
There are several limitations of this study. First, we used DRGs to determine what constituted an episode of care. The DRG system was designed to classify patients into groups based on likely utilisation of services and accumulation of costs. However, because the administrative data we used do not provide charge itemisation, it is very likely that some women received greater ‘intensity’ of services in unobservable ways. For instance, if one woman received an epidural, and another woman did not, we might expect the woman with the epidural to have higher charges. As much as possible, we are minimising fallout from this limitation by using observable attributes of the episode (eg, length of stay, discharge and comorbidities) in our first-stage regression, which should absorb some of the patient-level differences in care intensity. It is possible, however, that if unobservable patient characteristics affecting intensity of care are correlated with hospital characteristics, we might expect our second-stage estimates to be biased. On the other hand, if treatment intensity is a hospital-level characteristic, then our analysis does accurately capture this.
Second, our brief analysis of discounted prices is limited by the fact that we must estimate discount rates, since insurers and providers carefully guard their actual payment rates as proprietary. The financial data we used are self-reported, and thus the accuracy of our estimates is dependent on the accuracy of hospital reporting to OSHPD. However, inaccuracies are not a big concern as OSHPD performs systematic financial audits of their data. Furthermore, the discount rates are hospital-wide and aggregate across all insurers, while negotiations regarding discount rates granted by a given hospital may vary widely by particular insurer and according to DRG or cost centre. It is partly because of this significant limitation that we chose to focus our main results on charges and the factors affecting them. That said, our estimated prices were roughly consistent with the Truven study, which did have access to claims-based prices paid.28 In addition, discounted rates negotiated by insurers have been found to be broadly applied to wide swaths of services, as the main goal of such negotiations is overall solvency.48 Furthermore, modifications to charges at the aggregate level are regularly used in institutional practice, such as cost-to-charge ratios used by CMS to estimate outlier payments, which have been shown to be imperfect but generally appropriate estimates of cost.49
Third, our study examines only charges in California. Though California is a large, diverse state, our results cannot be generalised to the entire nation. Last, our study could not examine the full effect of quality of care on hospital price premiums, though we included select quality indicators. However, it is difficult to imagine that these variations could be attributed entirely to quality, given numerous studies demonstrating that charges and payments are unrelated to quality, which we similarly found in our analysis of three quality measures.50 ,51
Conclusions
For the same average patient in California, we find that charges for uncomplicated vaginal delivery ranged from US$3296 to US$37 227 (median: US$14 620) and charges for uncomplicated caesarean section ranged from US$8312 to US$70 908 (median: US$27 481) depending on which hospital she visited. Hospital ownership, casemix, wage index, percent uninsured in the county and market competitiveness had a significant impact on these adjusted charges. Estimated discounted prices averaged 37% of the adjusted charges. Our findings indicate that the charge faced by a patient for a common obstetrical procedure is significantly influenced by institutional and market-level factors outside of her own presentation, but that the majority of variation in charges between hospitals she could visit remains unexplained. Our results also suggest significant room for improved methodologies, incentives and policy interventions for accurately estimating and presenting charges and ultimate costs.
Acknowledgments
The authors especially thank Julia Brownell, BA, and Emilio Galan, BS, for their editorial and technical assistance.
References
Supplementary materials
Supplementary Data
This web only file has been produced by the BMJ Publishing Group from an electronic file supplied by the author(s) and has not been edited for content.
Files in this Data Supplement:
- Data supplement 1 - Online tables
Footnotes
-
↵i OSHPD masks selective patient information in this public dataset to prevent identification of individuals pursuant to the California Health Data and Advisory Council Consolidation Act, Health and Safety Code section 128675 et seq.
-
Contributors RYH conceived of the study, obtained the data, directed and interpreted the analyses, and helped draft and edit the manuscript. YAA helped conceive the study design, analysed the data, interpreted the results and edited the manuscript. EW contributed to methodological design, analysed the data and interpreted the results, and helped with editing of the manuscript. All authors have read and approved the final version of the manuscript.
-
Funding This work was supported by the National Center for Advancing Translational Sciences, National Institutes of Health, through UCSF-CTSI Grant Number KL2 TR000143 (R.Y.H), the Robert Wood Johnson Foundation Physician Faculty Scholars Program (R.Y.H), and a UCSF Center for Healthcare Value grant.
-
Competing interests None.
-
Provenance and peer review Not commissioned; externally peer reviewed.
-
Data sharing statement All datasets used in this study are available to the public through the California Office of Statewide Health Planning and Development (OSHPD), either by download or by request at http://oshpd.ca.gov