Article Text

Abstract
Objective The World Health Organization (WHO) has established a set of growth curves for use as international standards in children up to age 5. The WHO's position is that all economically advantaged children who were breastfed as infants grow similarly. As a result, a single set of growth charts can be used to judge growth in any child, regardless of race or ethnicity. The goal of this study was to compare mean heights, weights and head circumferences from a variety of studies with the WHO's data.
Design We compared data from the WHO's Multicentre Growth Reference Study (MGRS) with data from studies performed in 55 countries or ethnic groups.
Data sources PubMed, WHO Global Database on Child Growth and Malnutrition, SciELO, Google Scholar, Textbooks and Ministries of Statistics and Public Health.
Eligibility criteria Large recent studies (1988–2013) of economically advantaged groups, including comparisons with cohorts of breastfed children wherever possible.
Results Height varied somewhat among different national and ethnic groups. Means were generally within 0.5 of an SD of the MGRS means. Weight varied more than height, but the low MGRS means were seen as endorsing slenderness in the midst of an obesity epidemic. The mean head circumference varied widely. In many groups, means were consistently 0.5–1 SD above the MGRS mean. Head size in breastfed children at any age examined was far closer to local norms than to the MGRS means.
Conclusions Height and weight curves may not be optimal fits in all cases. The differences between national or ethnic group head circumference means were large enough that using the WHO charts would put many children at risk for misdiagnosis of macrocephaly or microcephaly. Our findings indicate that the use of a single international standard for head circumference is not justified.
Systematic Review Registration PROSPERO (# CRD42013003675).
- PAEDIATRICS
- PUBLIC HEALTH
This is an Open Access article distributed in accordance with the Creative Commons Attribution Non Commercial (CC BY-NC 3.0) license, which permits others to distribute, remix, adapt, build upon this work non-commercially, and license their derivative works on different terms, provided the original work is properly cited and the use is non-commercial. See: http://creativecommons.org/licenses/by-nc/3.0/
Statistics from Altmetric.com
Strengths and limitations of this study
-
We found data from 55 different countries or ethnic groups (over 11 million children), making this study a large-scale comparison of growth in healthy children around the world.
-
We found a relatively few studies from South America and sub-Saharan Africa. This limitation was due to the relatively few studies meeting our inclusion criteria in these areas.
-
We also found extensive data comparing growth in breast- and formula-fed infants. This data facilitated comparisons with the MGRS data.
Introduction
The importance of growth monitoring in paediatric care is well recognised. Unduly slow or rapid growth can indicate serious medical conditions, including genetic disorders, chronic disease, infectious disease, abuse or neglect and a variety of other problems.
Although analysis of information about an individual's growth can be complex, clinicians often look for patterns that may indicate abnormal growth. Examples include data points for a child that cross centile lines on a growth curve quickly, or values >2 SDs from the mean (below the 2.3rd and above the 97.7th centiles). Head circumference values below the 2.3rd centile may indicate poor brain growth, and height values in this range are often used to define short stature. Insurance companies and national healthcare systems often use SD cut-offs as criteria for coverage of growth hormone therapy. Thus, it is critically important that clinicians use curves with centiles that accurately reflect a child's expected pattern of growth.
The WHO's position is that unconstrained growth of economically advantaged breastfed infants and children does not vary substantially, and that a single set of growth curves can describe a human physiological norm up to age 5.1 ,2 Accordingly, the WHO calculated a set of normative curves from the Multicentre Growth Reference Study (MGRS1 ,3). Study participants came from single cities in six countries (Brazil, Ghana, India, Norway, Oman and the USA).
The WHO refers to its curves as growth standards, or tools that provide a norm or desirable target, involve a value judgement, and describe how children ‘should grow’ in all countries.3–8 Standards are different from references, which show how children are actually growing in a given place and time. The WHO notes that any deviations from its standards should be considered as evidence of ‘abnormal growth’.1 ,3 To date, >100 countries have adopted the MGRS curves.9
Many recent studies have found growth patterns of economically advantaged children that differ from the MGRS means. These studies were rigorous. Unfortunately, however, they focus on no more than two countries or ethnic groups,10–16 do not compare their data with the MGRS data, were published before the MGRS curves11 ,14 ,17–20 or are written in local languages.21–23 To date, no one has carried out a large-scale comparison of data from the MGRS and different studies. As a result, the magnitude of international differences in growth is not fully evident.
In addition, the WHO has not published data supporting the idea that head circumference does not vary between nations and ethnic groups, nor has it published site-specific data for weight and head circumference from the MGRS study. Owing to the large number of countries using the WHO curves and because errors in diagnosis can occur when using growth curves with inaccurate centiles, we decided to compare the MGRS data with data from growth studies performed in different countries.
We analysed studies from 55 countries or ethnic groups, including 3 that had participated in the MGRS (India, Norway and the USA). We compared height, weight and head circumference from birth to age 5, and strove to use data from breastfed economically advantaged children. Like the WHO,2 ,5 we defined 0.5 of an SD as a benchmark for significant differences between groups (called outlying groups or outliers here).
Methods
The protocol for this study is registered with PROSPERO (# CRD42013003675).
Literature search
We searched PubMed, the WHO Global Database on Child Growth and Malnutrition, SciELO, Google Scholar and Google between May 2012 and May 2013. A final search was also performed immediately prior to publication. Our search terms were [“head circumference” OR birthweight OR weight OR length OR height OR anthropometric OR anthropometry OR “occipito-frontal” OR “growth curves” OR “length or height or stature” OR “growth charts”] alone or AND [ethnic group or nation]. Searches were performed in English, Arabic, Chinese, Czech, Dutch, French, German, Japanese, Icelandic, Italian, Korean, Norwegian, Polish, Portuguese, Russian, Spanish and Turkish. Most of the non-English papers had English abstracts. Google Translate and colleagues with knowledge of other languages aided in translation.
We scanned publication references and ‘cited by’ papers in Google Scholar, and contacted researchers to request information or sample size data not included in publications. Our initial screen identified ∼2500 publications; ∼900 that appeared to be relevant were selected for close review. ‘Relevance’ was defined as publications that, according to their abstracts, focused on growth, including the creation of curves and/or mean or centile values at specific ages. These included papers, books, one PhD thesis and government-made national growth curves. We reviewed these leads and determined which studies met our inclusion/exclusion criteria (see below and online supplementary figure S1). Differences of opinion were discussed until agreement was reached.
Study selection and data extraction
The MGRS study enrolled economically advantaged children who had been breastfed as infants.1 ,3 We strove to find studies duplicating these conditions. The MGRS assumed that children at study sites in two developed nations (Norway and the USA) were unconstrained by economic hardship. We made this assumption for nations scoring ≥0.750 on the United Nations Human Development Index (HDI) at the time a study was performed. This approach helped us to reduce bias from growth data from children who were malnourished or afflicted with poverty-related medical conditions that affect growth. Other studies specifically cited favourable circumstances as inclusion criteria.19–21 ,24–26
Study quality was improved by the use of peer-reviewed publications and data from national health surveys. Online supplementary table S1 has a column ranking each study by its relative risk for the biases noted above. Rankings were described on the following scale: low, low-medium, medium, medium-high and high. We used studies with rankings of low and low-medium. A study was scored low-medium if it met the conditions noted above but some uncertainties existed. An example would be the absence of a statement in a high HDI country about excluding children with diseases affecting growth. As another example, the MGRS study was scored low-medium because of potential attrition bias.27
For size at birth, we used studies reporting measurements by gestational age when possible.10 ,22 ,24 ,28–51 In addition, two studies defined ‘term birth’ in this way.52 ,53 This approach allowed us to duplicate the MGRS's 37–41 completed weeks ‘term birth.’ Some studies defined term birth as 37–42 weeks.12 ,54–59 A study from Sweden defined term birth as 37–43 gestational weeks.60 Another study of birth size in Sweden noted deceleration of growth after 40 weeks61; thus, the studies including data from gestational ages after 41 weeks (in Sweden at least) are unlikely to skew the data significantly. The Euro-12 used data from 37–44 weeks.62 Five studies noted ‘term birth’.23 ,25 ,26 ,63–68 Our remaining birth studies simply reported size at birth.14 ,21 ,69–76
Means at the following ages were analysed: birth, 6 months (head circumference only), and 12, 18, 24, 36, 48 and 60 months. Data were transferred to Excel spreadsheets and checked and rechecked by both authors.
Calculation of weighted averages and composite SDs
We calculated weighted averages ( ) and composite SDs (
 ) for data at birth using standard methods. Composite SDs were calculated as follows:
In this calculation, k is the number of term gestational age groups in each study (1 group/week; 37–41 weeks),  the sample size of each gestational age group,
  the total number of samples in each ethnic group, (
 –1) the degrees of freedom,
  the mean value in each gestational age group and
  the variance in each gestational age group. The first sum inside the root sign is the overall error sum of squares; the second sum is the group sum of squares. When added together and divided by the degrees of freedom, the result is variance. The square root of variance is SD, which we used to calculate SEs.
Defining significant differences
The WHO used 0.5 SD as a benchmark for clinically significant differences.2 ,5 We adopted this cut-off. However, 0.5 SD is normally considered to be of moderate clinical significance and <0.5 SD may not be an optimal definition for not significantly different. Consequently, we also identified differences that were smaller but consistent. This was defined as a mean that was 0.25–0.49 SD from the MGRS mean in at least four of the ages noted above. Note that 0.25 SD outliers measure studies as a whole: if means at ≥4 ages were ≥0.25 SD from the MGRS mean, the country was identified as a 0.25 SD outlier.
Results
Study selection
This review uses studies from the following countries/ethnic groups: Argentina,44 Australia (indigenous and non-indigenous),28 ,49 ,75 Belgium,59 Brazil,41 Canada (indigenous and non-indigenous),10 ,48 ,77 China,65 ,71 Czech Republic,73 Denmark,16 ,52 ,66 Egypt,19 Euro-12,62 Finland,37 ,64 France,29 ,78 Germany13 ,50 ,79 Greece,57 ,80 Hong Kong,30 Iceland,53 ,81 India (birth and postnatal20 ,33 ,38 ,82 ,83), Iran,55 Ireland,84 Israel,34 Italy,31 ,85 Japan,14 ,39 ,56 Kuwait,43 Lebanon,36 Libya,86 Malaysia,35 Mexico,45 Moroccans (in the Netherlands and Spain),22 ,87 Nepal,63 the Netherlands (including Moroccans and Turks),18 ,87–90 New Zealand (indigenous and non-indigenous),58 ,91–93 Nigeria (birth26), Norway,12 ,51 ,67 Poland,94 ,95 Portugal,46 Russia,72 Saudi Arabia,25 Scotland,47 Singapore,40 ,69 South Korea,70 ,74 Spain (birth; Caucasians, Moroccans, South Americans and sub-Saharan Africans born in Spain),22 Spain (postnatal),96 Sweden,60 Switzerland,23 Taiwan,42 Turkey,21 ,90 United Arab Emirates,24 the UK54 and the USA,32 ,97 plus the MGRS.1 ,3 The participants in these studies totalled roughly 11 million children (see online supplementary table S1).
Height
A publication authored by the MGRS showed that height means within the MGRS study sites did not vary significantly from birth to age 5.2 In general, most means we analysed also fit within±0.5 SD of the MGRS means (results not shown). Groups with outlying means at three or more ages included Pacific Islanders,58 the Netherlands,18 Finland,98 India20 and Saudi Arabia.25 Europeans and Pacific Islanders were above the +0.5 SD mark; other groups were below −0.5 SD.
Pacific Islander adults are not taller than other groups99; it is likely that increased height in these children is due to prematurely accelerated growth caused by increased weight (E. Rush, personal communication).100 As a result, we were concerned about high weight and high body mass index (BMI). We investigated this possibility by using the Centers for Disease Control and Prevention's (CDC's) paediatric BMI calculatori to determine BMIs for Pacific Islander children aged 2–5 with weights and heights at the 50th centiles; all values came from a large recent study of this group.92 The values we obtained were between the 87th and 98th centiles, with the majority >90. The CDC cutoff centile for overweight is the 85th centile. Thus, an average-sized child in that study would be overweight at a minimum, even when accounting for differences in body composition.99 Alternatively, the same calculations for Dutch children ranged from the 39th to the 56th centiles, with the majority <50. These findings imply that increased linear growth in the Dutch population is not due to excess weight.
Infants in some nations were also longer than the MGRS means. For example, the average length of all children in Iceland was ∼2/3 of an SD longer than the MGRS charts at birth and 12 months in a study that measured children at these two time points.53 Male and female infants in Denmark were also outliers up to age 1.66 The Icelandic study was small, but the Danish study was a large national survey. In addition, Moroccan infants in the Netherlands were outliers at age 1.87 Finally, a large German study found that means for German girls and boys up to age 5 were at the 62nd and 60th MGRS centiles, respectively.101 The authors deemed these differences to be sufficient to warrant the use of national growth curves over the MGRS curves.101 Overall, 20% of the total means were ≥0.5 SD from the MGRS mean. However, the percentage of means at least ±0.25 SD from the corresponding MGRS means at 4 or more time points was 44% for boys and 48% for girls.
Breastfed infants and children
Several studies have examined the effects of breastfeeding on linear growth. Although breastfed cohorts may be smaller than formula-fed cohorts,52 ,56 in most studies we analysed, the lengths of breastfed infants and children were closer to local references than to the WHO standards12 ,16 ,56 ,102 ,103 or, in pre-MGRS studies, the mean lengths of breast- and formula-fed infants were not significantly different.104 ,105 We excluded older studies (before 1988) comparing breastfed and formula-fed infants due to changes in formula content with time. A Japanese breastfed cohort was at least 0.5 SD below the MGRS mean at every age measured; means for formula-fed children were either within 0.25 SD of the MGRS mean or not below 0.5 SD.56 No pattern was found when comparing Greek breastfed infants with the national standards and MGRS data.57 ,80
Weight
We compared mean MGRS weight-for-age values with values from 24 to 54 (depending on age) countries or ethnic groups. The MGRS means were always at the low end of the range of values we obtained. Figure 1 is an example showing weight in boys and girls at age 24 months.

Weight at 2 years: 30 countries versus Multicentre Growth Reference Study (MGRS). The green box delimits the area within 0.5 SD of the MGRS mean. The green line within the box shows the MGRS mean. (A) Boys; MGRS mean: 12.2 kg; SD up: 1.55 kg, down: 1.25 kg. (B) Girls; MGRS mean: 11.5 kg; SD up: 1.65 kg, down: 1.25 kg. Error bars show 1 SE.
Overall, weight varied more than height. The percentage of outlying means in our analysis ranged 12–57%, with a peak at 30–39%. The greatest variation occurred at the age of 12 months (60% of means were outliers among boys and 44% for girls).
Importantly, ∼84% of outlying mean weights were above the MGRS +0.5 SD mark. Owing to the global obesity epidemic, the low position of the MGRS means in our range can be seen as endorsing the idea that slenderness is healthy. This is a strength of the MGRS curves, particularly since overweight and obesity pose significant health risks. However, clinicians working with children from groups that are somewhat taller or shorter than average should bear differences in mind when assessing weight centiles with the MGRS charts. This is particularly important when making determinations about failure to thrive (FTT).
Online supplementary figure S2 compares birth weight in boys and girls in 54 studies and the MGRS. Although the MGRS values were closer to the middle of the range of values at birth, outliers occurred above and below the mean, with highly developed nations well above the mean (Iceland) and well below it (Japan). Thus, the charts may not be good global fits for birth weight. A study in the UK came to this conclusion for British children.106
Overall, 31% of all weight means were at least 0.5 SD from the WHO mean at any age, with 62% (boys and girls) of studies being 0.25 SD outliers as defined above. Alternatively, results for a similar comparison of Euro-1262 weight means and national European weight means identified only four 0.5 SD outliers among 144 data points and 2/15 (13%; boys and girls) as consistent 0.25 SD outliers. We did not make this comparison for height because the Euro-12 study measured only length, and most other studies measured standing height at ages 2 and 3.
Breastfed infants and children
Weight differences between breast- and formula-fed cohorts were more substantial than for length/height. However, national breastfed means were not necessarily the same as the WHO means, and no overall pattern was found. For example, weights in Belgium and Norway were closer to the MGRS means at some ages and to local formula-fed means at other ages.12 ,107 Alternatively, a study in the USA found consistent differences between the two cohorts.102 Weights of Danish infants fed according to the WHO recommendations fluctuated but were generally <0.25 SD from the overall mean of breastfed and formula-fed infants combined.52 Mean cohort weights did not differ significantly in another Danish study, but were above the MGRS means.16 This finding mirrors that of a study in Sweden, which found no differences between the two feeding groups.104 Most breastfed Japanese infants up to age 2 were 0.5 SD outliers.56 All were lighter than formula-fed infants, who were not generally 0.5 SD outliers.
Head circumference
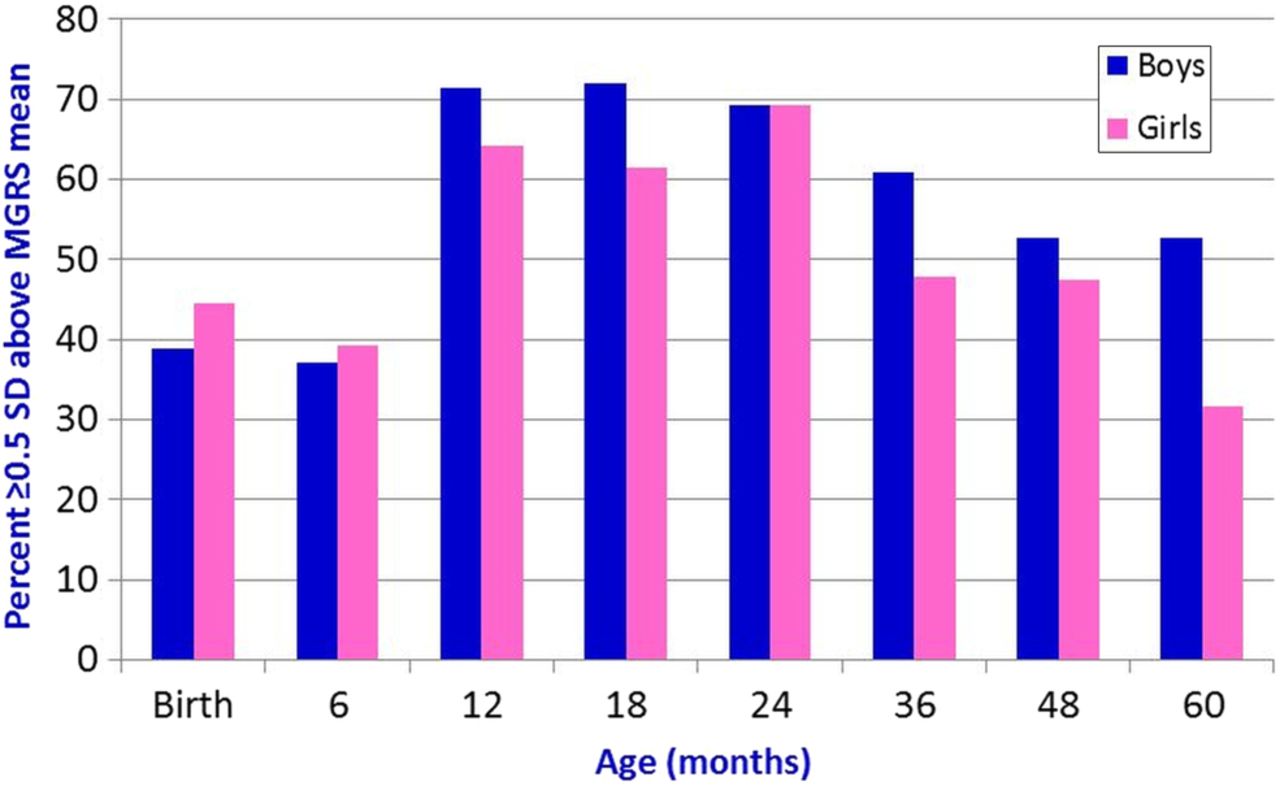
Overall, head circumference varied far more than weight or height. Again, the MGRS mean values were at the low end of the range of values we found. Most outlying groups were European (including Turks), but Asian Indians, Australian aborigines, Canadian Cree, Japanese children at birth and Pacific Islanders were also represented. Figure 2 compares head circumference at age 24 months in 26 studies with the MGRS means. Eighteen means in each group were 0.5 SD outliers. Figure 3 shows the percentage of outlying means at each age we analysed. Outliers ranged from 32–72% of age groups from birth to age 5. Overall, 219 means of 408 total were outliers (54%). Of these, 202 (98%) were above the +0.5 SD cut-off.

Head circumference at 2 years: 26 countries versus Multicentre Growth Reference Study (MGRS). The green box delimits the area within 0.5 SD of the MGRS mean. The green line within the box shows the MGRS mean. (A) Boys; MGRS mean: 48.25 cm; SD: 1.36 cm. (B) Girls; MGRS mean: 47.2 cm; SD: 1.40 cm. Error bars show 1 SE.

Percentage of head circumference outliers by age and sex. The figure shows the percentage of studies with head circumference means that were at least 0.5 SD above or below the Multicentre Growth Reference Study (MGRS) mean. Half or more of all means for boys were beyond 0.5 SD at 12 months and older; at least 40% of means for girls were in this category in 6 of 8 age groups.
A total of 51% of female means and 56% of male means were 0.5 SD outliers, and 69% of studies on boys and 78% of studies on girls were 0.25 SD outliers. The difference between the highest and the lowest mean values was ≥1.5 MGRS SDs in the majority of ages.
Means in geographically proximal countries were closer. Figure 4 compares Euro-12 means at 24 months with European national means.62 There were no 0.5 outliers. In addition, there were only eight 0.5 SD outliers of 182 data points from birth to 36 months (data not shown). Six of these points were from the UK. However, 31% of female study means from 0 to 5 and 44% of male studies were surpassed the 0.25 SD cut-off.

Euro-12 versus 15 European studies (head circumference, 24 months). (A) Boys; Euro-12 mean: 49.5 cm; SD: 1.4 cm. (B) Girls; Euro-12 mean: 48.4 cm; SD: 1.3 cm. Error bars show 1 SE. MGRS, Multicentre Growth Reference Study.
Data for Cree head size were included even though many Cree live in disadvantaged circumstances with a high prevalence of diabetes. Our reasons for using the data were that (1) diabetes (including gestational diabetes) apparently does not affect head circumference108 and (2) different studies have found large head sizes in the Cree,77 ,109 with their larger overall sizes dating back to a time when they maintained traditional lifestyles.110
In practical terms, these findings indicate that many children from groups analysed here would be extreme outliers above the 97.7th centile/2nd SD above the mean on the MGRS's curves, and few would be extreme outliers below the 2.3rd centile/2nd SD below the mean. We addressed this question by estimating the percentage of children from different national or ethnic groups who would be extreme outliers on the MGRS curves.
To do this, we determined MGRS values that were ±2 SDs from the MGRS mean for different ages and sexes. For example, the MGRS +2 SD value for 24-month-old boys is 51 cm. Next, we determined centiles for these values in other groups. Thus, 51 cm is roughly the 73rd centile for British boys at the same age, meaning that ∼27% of British boys would be above the 97.7th centile on the MGRS growth curves. Alternatively, 51 cm is approximately the 86th centile in the Euro-12 data, meaning that ∼14% of European 2-year-old boys overall would be above the MGRS's 97.7th centile. This estimate fits well with the fact that the Euro-12 male mean at 24 months is ∼0.9 SD above the MGRS mean. Alternatively, only 0.02% of British boys and 0.26% of Euro-12 boys would be below the 2.3rd centile on the MGRS charts. Note that the SD values for the MGRS, UK and Euro-12 studies were generally very close at all ages, especially for males, facilitating this comparison. This similarity was not the case for every country tested, and growth variation within individual nations presumably contributes to differences at the extremes when measured against the MGRS curves. Figure 5 shows percentages of extreme outliers for countries on different continents. Online supplementary figures S3 and S4 show extreme outliers for height and weight at age 2.

Estimated percentages of extreme outliers (head circumference) at age 24 months. (A) Percentage of boys (blue) or girls (pink) estimated to be above the 97.7th centile on the Multicentre Growth Reference Study (MGRS) curves. (B) Percentage of boys (blue) or girls (pink) estimated to be below the 2.3rd centile on the MGRS curves.
Euro-12 used ‘strictly standardised methods of measurement’ that mirrored the MGRS's,111 including use of a metal measuring tape applied firmly.112 Given the methodological similarities between both studies, it is unlikely that the large differences in means between the MGRS and Euro-12 studies are due to technique.
Breastfed infants and children
Head circumference means in breastfed infants and children were generally closer to local norms than to the MGRS standards12 ,107 or close to formula-fed groups in pre-MGRS studies.52 ,62 ,102 ,105 A Turkish study found fluctuations in differences between the groups, but only measured infants until the age of 6 months.113 Head size in Japanese breastfed and formula-fed cohorts did not generally differ significantly at the ages tested (birth to 24 months), while differences from the MGRS means fluctuated.56 A Danish study found that head circumference in breastfed infants did not differ from non-breastfed infants, and both groups had larger mean head sizes than the MGRS means.16
Discussion
This study is a large international comparison of height, weight and head circumference means in children up to age 5. In order to minimise effects due to secular changes in growth, we used recent growth studies published within the same general time as the MGRS study. Overall and with some exceptions as noted, mean values for linear growth examined here were within 0.5 SD from the MGRS means, although close to half of means were not consistent within 0.25–0.49 SD of the MGRS means. Among 0.5 SD outliers, Europeans were generally above 0.5 SD and some other groups (eg, Saudi Arabians and Asian Indians) were below −0.5 SD. Thus, the curves may underindicate short stature in slightly taller European populations and overindicate it in shorter ones. Clinicians should keep this fact in mind when dealing with children from these populations.
Obviously, means for groups with small average body sizes, such as the Aka, Efé and Mbuti tribes, and others, would not fit into the MGRS charts and these groups would presumably require their own charts for optimal analysis of growth. Owing to the challenges of making charts for these populations (a relatively small population size, relative isolation, etc), their situations pose unique difficulties in this regard.
Variation in weight was greater, with 57% of male means and 39% of female means being outliers at 12 months. This large percentage may have been partially due to differences in feeding methods, but without specific studies, there is no way to know. Additionally, many of the higher weights in European populations may also have been partially due to their mildly greater lengths/heights.
The MGRS weight means tended to be at the low or very low end of the range of weights we found, and 84% of outlying weight means were above the MGRS mean. The position of the MGRS means can be seen as endorsement of slenderness and is therefore a strength of the MGRS curves. However, weight centile values must still be interpreted carefully in populations that are tall or short.
In addition, 16% of the outlying mean weights identified here were below the MGRS mean. Most were from India and Saudi Arabia. As noted, Indian children tended to be short and would therefore be expected to have lower weights; Saudi children were also at the low end of our height ranges.
In contrast, head circumference varied considerably. Variation between the extremes in each age/sex group was as high as ∼2.5 SDs. However, as noted in the text and shown in figure 4, variation was less in geographically proximate Europeans. This was also the case for eastern Asian populations analysed here (China, Japan and Singapore). Overall, means for these groups clustered together at all ages examined.
Although the WHO examined weight and linear growth in breast- and formula-fed infants prior to beginning the MGRS, head circumference was not examined.114–117 In addition, the final MGRS study did not publish site-specific head circumference data, apart from a small set of sex-pooled birth data.118 We found 0.5 SD outliers in that data (Norway and Oman; not shown).
Also, studies comparing head size in breastfed and bottlefed children have found either no or modest size differences between them or found that head circumference in breastfed infants is closer to other local infants than it is to the WHO charts.12 ,52 ,102 ,107 ,119 The Euro-12 study found that all size differences between breastfed and non-breastfed European children, including head size, were clinically irrelevant after the first birthday.105 Taken as a whole, these findings indicate that the MGRS head circumference curves are of questionable validity for global use.
The variation found here highlights the fact that growth and growth monitoring are complex processes. Growth is affected by genes, physiology, general health, general environment, nutritional status and other factors. Growth monitoring is affected by secular changes in size, the size of each study sample and its composition, measurement errors and other things.
Just as importantly, size at any age is affected by innate differences in anatomy. As an example, the craniums in Polynesians are shaped differently when viewed from above and behind in comparison with those of other humans, and their cranial vaults are higher and larger.120 There are also differences between Chinese and Caucasian head morphology.121 Finally, the highly regarded works of William White Howells describe ethnic differences in skulls that are used to aid in the identification of human remains.122 ,123 One of his works describes centuries-old Polynesian skulls as ‘large’.122 Many or most of the differences he described may affect head circumference.
The WHO is correct to be concerned that the potentially smaller size of breastfed infants may lead to erroneous interpretations of growth faltering, followed by premature introduction of supplemental foods. This practice can be deleterious and have significant ill effects on children living in areas where sanitation is poor. However, it is equally important to acknowledge that curves that fit poorly with a population may also lead to errors, such as regarding head growth, FTT or the need for specialist services. These errors can raise barriers to correct diagnosis when a problem exists, create unnecessary stress when one does not and increase strain on overtaxed healthcare systems. Many countries will be able to use their own curves. However, because of the lack of data on unconstrained growth in sub-Saharan Africans, growth references for this population may be beneficial. Creating them for East and West African groups could be advantageous.
Analyses of secular changes have found that average height increases incrementally over generations,124–134 even in affluent populations. Continued incremental increases in height continue to be documented in countries such as Denmark, Sweden and the Netherlands (albeit at reduced rates16 ,18 ,135), where socioeconomic constraints on growth have been effectively absent for decades.
Incremental increases appear to be due to physiological constraints,136 and are affected by maternal growth (fetal and postnatal137) and mid-parental height (reviewed in ref. 138), among other factors. However, secular increases in stature have slowed considerably in some countries, yet will likely continue robustly in others for decades.136 These observations imply that a population may eventually reach a maximum mean height. Clearly, however, maximum height cannot have been reached for the vast majority of the world's populations.
On the basis of this information, the advantaged children in the WHO's study may not have represented their population's maximal sizes, unless they had come from families that had been living in optimal conditions for many generations. The MGRS did not consider this factor. While Norway may have reached or be close to a growth plateau, the five other countries in the MGRS study likely have not, and all are likely in different stages of secular change. As a consequence, although the WHO notes that its curves were designed to show how children ‘should grow rather than how they grew in a particular time and place’,6 ,139 they may describe how advantaged children in countries at different stages of secular change were growing at a certain time.
Strengths and limitations
A major strength of this study is that it is the first large-scale comparison of growth data with the MGRS data. In choosing which data to include, we were careful to select recent studies of children living in advantaged conditions. This careful selection process increased the comparability of the means reported here with the MGRS means by maximising the similarity of conditions under which the data for comparison was gathered. We have also compared mean head size in cohorts of breastfed children with the MGRS means wherever possible.
We attempted to reduce the risk of bias by including large studies, searching multiple sources in multiple languages and using high-quality studies. By focusing on healthy, affluent populations, we also reduced the risk of reporting on growth that had been affected by disease or poverty.
Limitations of this study include the relative lack of data from South America and Africa. Unfortunately, the majority of South American studies pooled data for both sexes, and could not be used. In addition, the dearth of studies from sub-Saharan African nations was a limitation. Although our searches were extensive, it is also possible that we may have missed publications relevant to this analysis.
Acknowledgments
The authors would like to thank Martin O’Connor and Shannon Rice Long for advice and critical reading of the manuscript and Dr Charles McCulloch (UCSF) for statistics-related advice and critical reading. The authors are also grateful to the following for provision of data: Professor Kailash Agarwal (Health Care and Research Association for Adolescents, Noida), Dr Oskar Jenni (University Children’s Hospital, Zurich), Dr Hemasree Kandraju (Nizam's College, Hyderabad, India), Dr Luciano Molinari (University Children’s Hospital, Zurich), Dr Elaine Rush and Steve Taylor of Auckland University of Technology, and Professor Stef van Burren (The Netherlands Organisation for Applied Scientific Research TNO, the Netherlands).
References
Supplementary materials
Supplementary Data
This web only file has been produced by the BMJ Publishing Group from an electronic file supplied by the author(s) and has not been edited for content.
Files in this Data Supplement:
- Data supplement 1 - Online figure
- Data supplement 2 - Online table
Footnotes
-
Contributors VN conceived and designed the study. VN and AR performed the literature search and performed data analysis. VN drafted the initial report and both coauthors revised it and approved the final version. The researchers were independent from the funders.
-
Funding This work was funded by the Harry L Willett Foundation.
-
Competing interests VN and AR have support from the Harry L. Willett Foundation for the submitted work.
-
Provenance and peer review Not commissioned; externally peer reviewed.
-
Data sharing statement Both authors had full access to all of the data (including statistical reports and tables) in the study and can take responsibility for the integrity of the data and the accuracy of the data analysis.
-
↵i http://apps.nccd.cdc.gov/dnpabmi/Calculator.aspx?CalculatorType=Metric