Article Text

Abstract
Objectives Reducing disease inequalities requires risk factors to decline quickest in the most disadvantaged populations. Our objective was to assess whether this happened across the UK's ethnic groups.
Design Secondary analysis of repeated but independent cross-sectional studies focusing on Health Surveys for England 1999 and 2004.
Setting Community-based population level surveys in England.
Participants Seven populations from the major ethnic groups in England (2004 sample sizes): predominantly White general (6704), Irish (1153), Chinese (723), Indian (1184), Pakistani (941), Bangladeshi (899) and Black Caribbean (1067) populations. The numbers were smaller for specific variables, especially blood tests.
Outcome measures Data on 10 established cardiovascular risk factors were extracted from published reports. Differences between 1999 and 2004 were defined a priori as occurring when the 95% CI excluded 0 (for prevalence differences), or 1 (for risk ratios) or when there was a 5% or more change (independent of CIs).
Results Generally, there were reductions in smoking and blood pressure and increases in the waist–hip ratio, body mass index and diabetes. Changes between 1999 and 2004 indicated inconsistent progress and increasing inequalities. For example, total cholesterol increased in Pakistani (0.3 mmol/L) and Bangladeshi men (0.3 mmol/L), and in Pakistani (0.3 mmol/L), Bangladeshi (0.4 mmol/L) and Black Caribbean women (0.3 mmol/L). Increases in absolute risk factor levels were common, for example, in Pakistani (five risk factors), Bangladeshi (four factors) and general population women (four factors). For men, Black Caribbeans had the most (five factor) increases. The changes relative to the general population were also adverse for three risk factors in Pakistani and Black Caribbean men, four in Bangladeshi women and three in Pakistani women.
Conclusions Changes in populations with the most cardiovascular disease and diabetes did not decline the quickest. Cardiovascular screening programmes need more targeting.
- EPIDEMIOLOGY
- PUBLIC HEALTH
This is an Open Access article distributed in accordance with the Creative Commons Attribution Non Commercial (CC BY-NC 3.0) license, which permits others to distribute, remix, adapt, build upon this work non-commercially, and license their derivative works on different terms, provided the original work is properly cited and the use is non-commercial. See: http://creativecommons.org/licenses/by-nc/3.0/
Statistics from Altmetric.com
Article summary
Strengths and limitations of this study
-
The study tackled an important policy question in the arena of health inequalities.
-
The study used the best available data in Europe.
-
The results have research, policy and service design implications.
-
An accurate time trend requires a third dataset, but as the Health Survey for England 2009/2010 that was planned to focus on ethnic minority populations was cancelled, this is not available.
-
Different sample sizes by ethnic group added complexity to interpretation of the data.
-
Future surveys should be designed to make long-term comparisons easy.
Introduction
Cardiovascular diseases (CVD) are declining in many countries, including the UK, as a consequence of reduction in some risk factors (smoking, hypertension and hypercholesterolaemia) and better clinical management and treatments. Progress is being hindered partly because some risk factors are unchanging or even rising (obesity and diabetes) and because of unequal benefits in subsections of the population.1 ,2 Very few people meet all or most of the current health recommendations, and many have multiple risk factors.2 ,3Inequalities in CVD and risk factors are not declining, and may be increasing in a number of countries including the UK and the USA.1 ,4 Monitoring risk factor trends by population subgroups is essential to target interventions for maximal effect.
The risk of CVD varies strikingly across ethnic groups within the UK with the lowest rates in the Chinese-born and the highest in the South Asian-born groups.5 ,6 Inequalities in coronary heart disease (CHD) mortality between ethnic groups in the UK, identified by country of birth, are increasing, because some minority groups have shown lesser declines in mortality between 1979 and 2003 than people born in England and Wales.7 Harding et al7 showed that this was particularly important for men born in Jamaica, Pakistan, Bangladesh and Poland, as well as women born in Jamaica and Pakistan. We need the cardiovascular risk factor trend data by ethnic group to interpret these mortality patterns. The major cardiovascular risk factors clearly vary across ethnic groups within the UK,8 ,9 but there is little reported research on time trends in risk factor patterns by ethnic group. Between 1989 and 1999 in Stockport, a primary care cardiovascular risk factors screening programme compared the South Asians and the Caucasians (the term presumably meaning the White population) and indicated that, except for smoking, where ethnic differences were converging (a decline in Caucasians and a rise in South Asians), the time trends in risk factors were similar, with rising blood pressure and body mass index (BMI).8 Using the Health Survey for England (HSE) data, Karlsen et al9 showed that current smoking rates declined in most ethnic groups in England between 1998 and 2008 (three time periods compared) but were relatively stable in White English, Black Caribbean and Pakistani men and Black Caribbean women. The 2004 HSE10 provided some comparisons of change (comparing with the 1999 survey8), but the overall picture was not observed and remains unclear. We have therefore collated and re-presented the published data systematically.
The UK, in common with most nations, has been committed to reducing health and healthcare inequalities,11 ,12 including those relating to ethnicity12 ,13 and especially in relation to CVD, for many decades.11 ,12 ,14 ,15 ,16 ,17 The understanding that the UK South Asians were prone to CVD and diabetes, and the African-origin populations to cerebrovascular diseases and diabetes, was established fairly clearly in the 1980s.18 ,19 To narrow inequalities, we need to reduce cardiovascular risk factors more quickly in the disadvantaged groups,20 ,21 in this instance, to reduce all CVD particularly in Indians, Pakistanis and Bangladeshis and to reduce stroke in African origin populations.6 ,7 ,11 ,12 Reduction in cardiovascular risk factors should not lag behind but come first in those minorities with the highest risks of disease; otherwise, inequalities will widen or, at best, remain unchanged. In practice, however, achieving this ideal is difficult (see Discussion section).
We used the best comparable cardiovascular risk factor data available for at least two time points by ethnic group in the UK (and, to our knowledge, Europe) that is, the 1999 and 2004 HSE, to describe and interpret the change in risk between 1999 and 2004 by ethnic group. We systematically examined data on 10 important, established cardiovascular risk factors, examining changes in actual and age-standardised risk factor patterns and calculating CIs around changes. If long-standing health policy objectives relating to inequalities in health,11 ,12 ,22 ,23 ,24 including an emphasis on ethnicity and especially CHD, all recently re-emphasised,13 ,15 ,16 ,17 were achieved between 1999 and 2004, the risk factor profiles would have improved most quickly in South Asian populations, especially in Bangladeshis and Pakistanis. (Prior to this work, however, we thought this to be unlikely.)
Methods
Overview of HSE
HSE is part of a programme of health interviews and examination surveys commissioned by the Department of Health, England and conducted with full ethical approval. As this paper was prepared with already published anonymised data, no further approval was required. The HSE methods have been published in detail.25 ,10 The complex sampling and weighting procedures were designed to monitor trends in the nation's health, particularly prevalence of health conditions and risk factors. In 1999 and 2004, the surveys were focused on the largest UK non-White ethnic minority populations with boost samples, utilising multistage, stratified, probability sampling.25 ,10 The sampling frame was the small user postcode address file aiming to identify private households. The ethnic boost samples were based on areas chosen on the basis of Census estimates of the population by ethnic group. In addition, for the Chinese sample, additional screening of names in the electoral register (voters’ roll) took place. The methods for recruiting the Chinese in 1999 and 2004 were different and the HSE 2004 report cautions that the results of the two surveys might not be comparable. (An equivalent ethnically boosted HSE planned for 2009/2010 did not take place.)
In this paper, we follow HSE's approach to ethnicity, which generally accords with the previously described concepts and terminology.26 The ethnic groups targeted in 1999 and 2004 were Black Caribbean, Indian, Pakistani, Bangladeshi, Chinese and Irish (Black African was added only in 2004 and is hence excluded from this paper). HSE's use of ethnic group labels for these groups follows the censuses 1991 and 2001, that is, self-reported, based on a list of ethnic groups. The exception is the Irish group where the birthplace in Ireland of the informant or either parent denoted Irish ethnicity. The general population consisted of individuals randomly sampled from the population and therefore included ethnic minorities. The data of the relevant ethnic minority groups in this general population sample were added to the specific ethnic group boost sample and also included in the general population in HSE analyses and reports25 ,10 and hence, for consistency, also in this paper.
In 1999 and 2004, all populations had the interviewer’s visit (including measuring height and weight), but only ethnic minority groups had the nurse's visit for clinical measures and bloods. The 1999 and 2004 reports therefore provide comparative data for clinical measures and analyses in the general population from the 1998 and 2003 surveys. Details of the tables from which these data were extracted are given in the online supplementary appendix tables A1 and A2.
The response rates and number of people interviewed and receiving a nurse visit varied by ethnic group. The numbers are shown for each risk factor in 1999 and 2004 in the online supplementary appendix tables A3–A9. The populations and population sizes (unweighted N for men and women) interviewed in 2004 were, for example: general population (2879 men, 3825 women), Irish (497 men, 656 women), Chinese (348 men, 375 women), Indian (550 men, 634 women), Pakistani (433 men, 508 women), Bangladeshi (411 men, 478 women) and Black Caribbean (414 men, 653 women). Population sizes in 1999 were similar. The sample sizes were smaller for data collected at the nurse visit and still smaller for blood tests as some participants did not give consent for these. Bloods were taken after an overnight fasting only in those 35 years or more, so some results are only available in this age group, for example, tryglycerides. For instance, in Pakistani men, the sample sizes for smoking, high-density lipoprotein (HDL) cholesterol and tryglycerides were 423, 137 and 38, respectively. The changing and sometimes small sample sizes require cautious interpretation of data.
Methods for measurement and lipid analysis were standard and described in the HSE reports. Blood pressure was measured using the Dinamap equipment in 1999 and Omron in 2004. Data provided on 1999 readings are adjusted (Omron-adjusted) to allow comparability. Supplementary online appendix 3 section iii describes how we handled this in the calculation of CIs.
Data and analyses for this paper
We used data on participants aged 16 years and above (except for triglyceride levels, which were published only for ages 35+ years). The data were of 10 well-established cardiovascular risk factors published in 1999 and 2004 HSE reports.8 ,25 As in the reports, the total cholesterol and HDL data are on non-fasting samples (these are available for larger numbers and comparable across years). In 2004, HDL-cholesterol analysis used a direct method (no precipitation), while in 1999 it was measured after phosphotungstic acid precipitation. Wherever possible, we used continuous variables in preference to binary categorisations of variables due to their greater information content. We subtracted from the risk factor value in 2004, the value in 1999. A rise in the mean value or prevalence between 1999 and 2004 of eight of the factors is associated with an increase in CVD. The exceptions were physical activity and HDL, where a decline is associated with increased disease, and therefore, for consistency with other factors, we changed the arithmetical sign of difference so that a decline in these two risk factors is shown as a positive value (thus, a positive number for all 10 factors indicates an increase in risk).
We examined the pattern of change in two ways, both available in the HSE reports: (A) the actual risk factor mean or prevalence in all age groups combined (absolute change). The age and sex structure of the populations was very similar in 1999 and 2004 (online supplementary tables and 7, vol I of the 1999 report and p.21 of the 2004 report). (B) the age-standardised ratio of means and standardised risk ratios. A positive number means the risk increased more in a particular ethnic group than in the reference general population.
The prime interest was in the pattern of change across ethnic groups, rather than the extent of change in each risk factor. Prior to analysis, we defined changes as potentially important if, after rounding off fractions, either there was more than a 5% change or the 95% CI for the change excluded 0. In the absence of clear-cut national targets for reduction for each risk factor, we judged that a 5% or more change over a 5-year period was potentially important irrespective of the 95% CI. If only those changes where the 95% CI excluded 0 (or 1 for relative measures) were highlighted, there would be a bias towards demonstrating change in the larger populations as the sample size drives statistical precision.
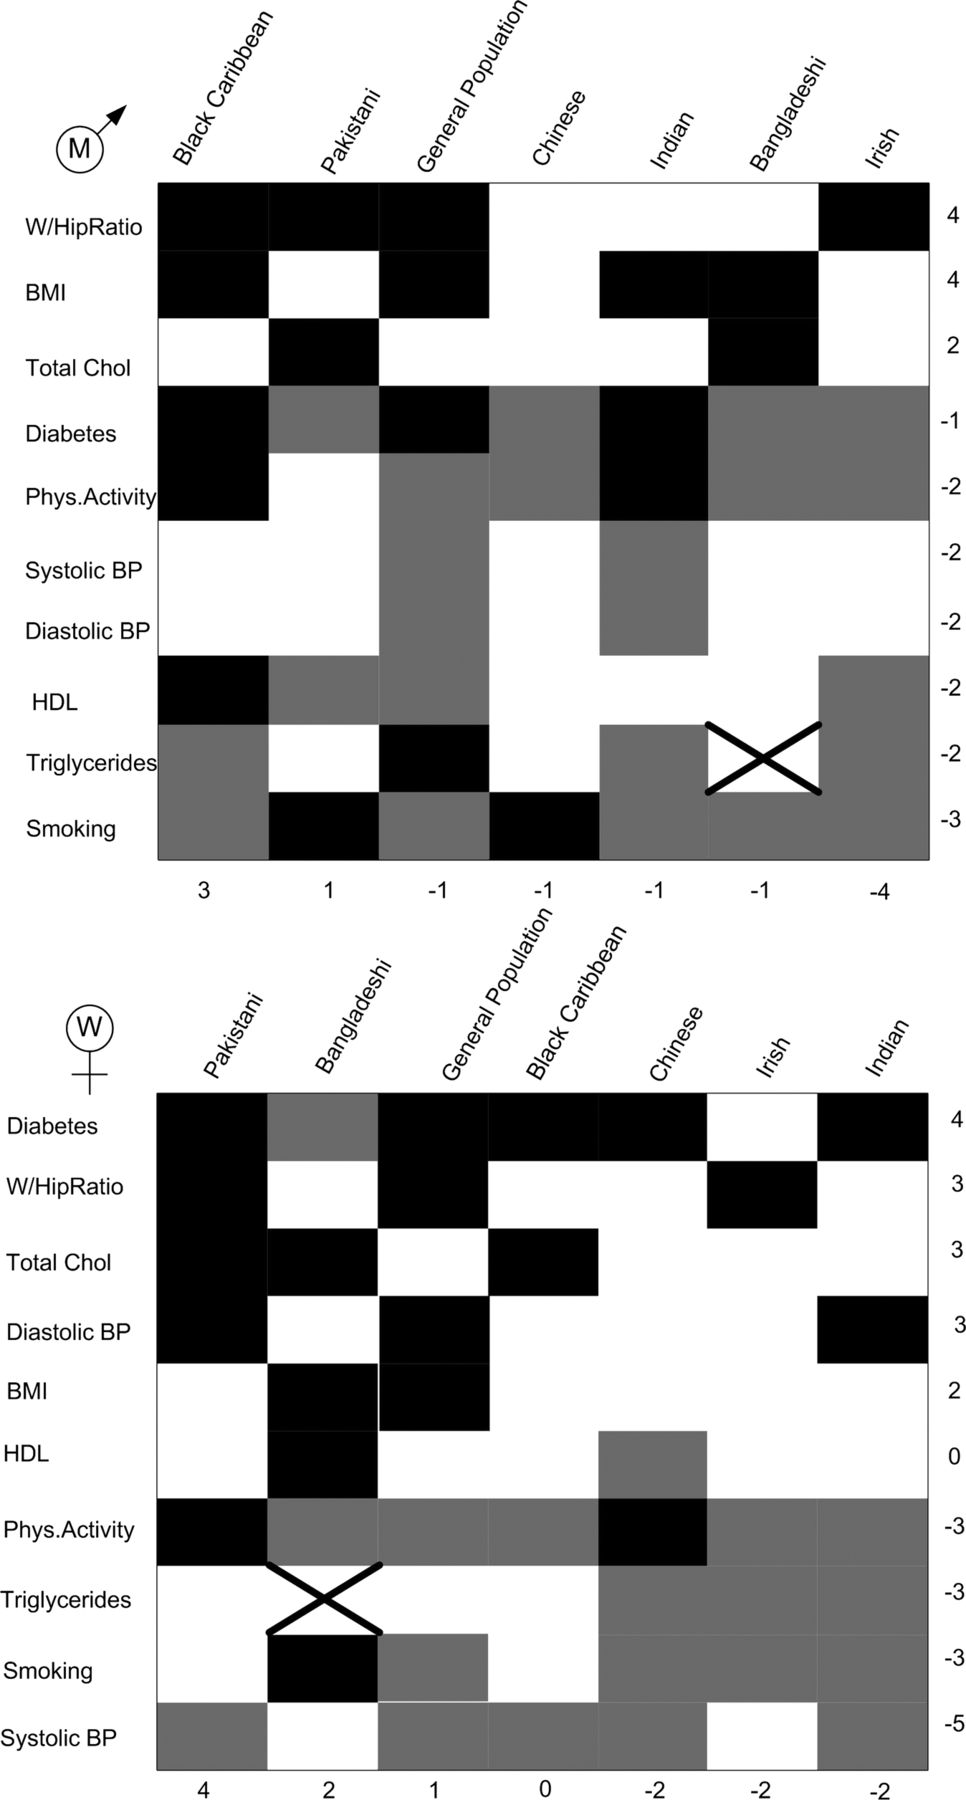
We created figures to summarise changes over time of the risk factors by ethnic group. A dark block indicates a worsening in risk for that risk factor. A grey block indicates an improvement for that risk factor. A white block indicates that any change was less than 5% in size and the 95% CI included either 0 or 1 for absolute and relative change, respectively. A cross indicates that the data were not available in the HSE reports to allow the comparison. The numerals in the rows are the number of worsened (black) blocks minus the number of improved (grey) blocks by risk factor. Similarly, the numbers in the columns give the net worsening by ethnic group. The figures rank the risk factors and ethnic groups according to the net worsening over improvement (black blocks minus grey blocks).
The calculations for the standardised ratios are described in the HSE reports and use standard methods. Online supplementary appendix 2 provides further details of our statistical methods for calculating CIs around the changes. No correction was made for multiple comparisons, but as recommended in these circumstances, relevant analyses are shown in full.27
Results
Absolute measures: prevalences and means
The detailed results are in the online supplementary appendix tables A3–A9. Figure 1 shows 19 black blocks (change for the worse) for men and 20 for women. The summarised results in table 1 and figure 1 show that changes were variable by risk factor, ethnic group and sex. The waist–hip ratio, BMIand total cholesterol rose or was unchanged in most ethnic groups. There were reductions in smoking and blood pressure in several ethnic groups. Increases in risk were most in Black Caribbean and Pakistani men, and in Pakistani, Bangladeshi and general population women. Increases in risk were fewest in Irish men and Chinese, Irish and Indian women.
Change in the mean risk factor level or in the prevalence of risk factor (percentage points) between 1999 and 2004 by ethnic group and sex (respondents aged 16 and over, except in the case of triglyceride where respondents were aged 35 and over). *A positive number denotes an adverse change in the risk factor level. An asterisk indicates the 95% CI excluded 0. A + or − sign denotes a 5% change in the risk factor for the worse or better, respectively.

Summary of changes in table 1 for men (top) and women (bottom). Black indicates a worsening in risk, grey an improvement and white that any change was less than 5% in size, and 95% CI's included 0. The cross indicates that the data were not available in the HSE reports to allow the comparison. The numbers on the y axis give the net for worsening position by risk factor and the numbers on the x axis give the net worsening for each ethnic group (see table 1 for a fuller description of the risk factors).
Relative measures: age-standardised ratios
Figure 2 shows 9 black blocks (worsening) in men and 15 in women. Table 2 and figure 2 do not show a consistent pattern of faster improvement in risk factor patterns in ethnic minority groups compared with the general population (as signified by negative signs) though the improvements (grey) exceed the worsening (black) blocks, although in most cases the 95% CIs for the change included 0. For diabetes in men and women, and triglycerides and waist–hip ratio in women, the ethnic minority populations improved compared to the general population, mostly reflecting a worsening in the general population, which is not the way to reduce inequalities (see table 1). Changes that were comparatively adverse were most common in Black Caribbean and Pakistani men (3 risk factors), Bangladeshi women (4 risk factors) and Black Caribbean men (2 risk factors). The relatively beneficial changes were most likely in Irish (5 risk factors), Bangladeshi4 and Chinese men (4 risk factors), as well as in Chinese (5 risk factors) and Indian women (4 risk factors), is a risk of over-interpretation.
Percentage change in standardised risk ratios or a standardised ratio of means in 2004 relative to 1999, by ethnic group and sex (respondents aged 16 and over, except in the case of triglycerides for which the only data were for those aged 35 and over). *A positive number denotes an increase in the age-adjusted risk factor level relative to the general population. An asterisk indicates the 95% CI excluded 0 (NA, not available). A + or − sign denotes a 5% change in the risk factor for the worse or better, respectively.

Summary of changes in table 2 for men (top) and women (bottom). Black indicates a worsening in risk relative to the White population, grey an improvement and white that any change was less than 5% in size, and 95% CI's included zero. The cross indicates that the data were not available in the HSE reports to allow the comparison. The numbers on the y axis give the net for a relative worsening position by risk factor and the numbers on the x axis give the net relative worsening for each ethnic group (see table 2 for a fuller description of the risk factors).
Discussion
Principal findings
Between 1999 and 2004, across most ethnic groups in England, some cardiovascular risk factors commonly reduced (blood pressure and smoking) while others mostly increased (obesity and diabetes). Important risk factors such as total cholesterol and HDL cholesterol showed little improvement, whereas in some ethnic groups these increased. Evidence for faster improvement in ethnic minorities than in the general population, as required to reduce cardiovascular disease inequalities to achieve public health goals, was sparse. Indeed, in some ethnic groups, particularly Pakistani and Black Caribbean populations, improvement was less common than in the general population. Overall, these findings show the magnitude of the task ahead in controlling CVD to their full potential in the entire population and in ethnic subgroups. Reduction in inequality in risk factors and diseases is a top policy priority,13 ,28 but these data indicate that it may not be achieved, a conclusion in accord with the sparse, previously published data on increasing inequality in cardiovascular mortality by ethnic group.1 ,4 ,8 ,29 The need for targeting effective cardiovascular prevention interventions in ethnic minority groups has been emphasised in the past13 ,30 and more recently as well,16 ,31 but more is required.
Limitations and strengths
The main limitation of this study is that we have only two valid time points of observation, 1999 and 2004. The lack of, and need for, updated data is shown by this study. Unfortunately, the planned 2009/2010 ethnically boosted HSE did not take place and there are no firm plans for it. These data are, to our knowledge, the best available in Europe that permit a comparison over time. While Karlsen et al9 examined a third time period (2006–2008) by combining years when there was no ‘ethnic boost’ in HSE, the numbers for this latter period were very small in important ethnic groups for example, there were only 83 Bangladeshi men and 61 Chinese men. Also, the methods for recruitment were different in this later time period. Even between 1999 and 2004, however, we have demonstrated important changes, incompatible with the legislative32 and policy15 goal of increasing equity in health status across some ethnic groups (particularly Pakistani, Bangladeshi and Black Caribbean), while being compatible with the goal in others, notably the Irish. The improvements seen in the Irish risk factor patterns require validation.
The age–sex structure of the sample populations was similar in 1999 and 2004. We examined data on overall prevalence and age-standardised ratios. This approach—giving weight to absolute and relative risk perspectives, as long recommended33—gives added insights. The actual changes (table 1 and online supplementary tables), in combination with relative changes, more fully reflect the task facing public health.
The results are from two cross-sectional surveys with independent samples so they represent the picture across England. Potentially, following up the same people, that is, a cohort study, would add important insights, though pragmatically it would be difficult to achieve and prone to non-response bias. Such results would be less representative of the burden of risk factors in 2004 (partly because of loss to follow-up) and therefore less applicable to public health action.
There are limitations to some of the measurements of risk factors. The self-reported risk factors are subject to issues of the cross-cultural validity of questions, although this should be less of a problem in comparison within ethnic groups across time rather than between ethnic groups.34 Blood pressure scores were transformed by HSE to make the comparison between the two time points valid as the measurement equipment changed (see online supplementary appendix 3 iii).10 The response rates varied across time as well as by ethnic group and type of data (interviewer, nurse, questionnaire/measurement and blood tests). Caution is required in interpretation when trying to compare like-with-like.
There is a risk of over-interpretation of statistical analysis as indicated by CIs since we did not adjust for multiple comparisons. We preferred the transparency of description of the analysis, without such adjustment, as recommended by Rothman.27 Our definition of a noteworthy change used a mix of actual size (5% or more) and statistical precision (95% CIs excluding zero for absolute measures and 1 for relative measures). This pragmatic approach was required because large differences in the sample size necessarily mean varying the precision of CI by ethnic group. The general population sample is 6–10 times larger (unweighted) than each of the ethnic minority groups, so CIs around changes are more precise. If we had only used CIs, small changes in the general population would have gained attention while large changes in the smaller population would have been ignored. Pending availability of better data, we think our approach, though not ideal, is a fair compromise.
There is a minor loss of precision in using published summary tables from the HSE reports rather than the raw data themselves. We calculated CIs around changes over time using methods that maximise precision (see online supplementary appendix 2). Using published figures makes our work open to scrutiny, allows easy comparison with published data and utilises the weighting procedures already used to adjust for complex sampling procedures in the HSE reports.
Interpretation and conclusions
England has a well-established and specially funded national programme—the National Service Framework—that sets standards for a number of conditions including the control of CVD and its risk factors that builds on decades of prior excellent work to control cardiovascular risk factors (http://www.nhs.uk/NHSEngland/NSF/Pages/Nationalserviceframeworks.aspx; accessed 13 Aug 2012).16 Several of the other service frameworks are also relevant to this goal. The National Service Framework for CHD emphasises the needs of ethnic minority groups (RSB served on the committee that developed this framework). There is a long-standing policy goal,13 ,24 ,35 backed by legislation and numerous health and healthcare policies, to provide equitable healthcare for all, across all ethnic groups.32 ,33 ,36 This kind of goal is also common in other countries including the USA37 and the European Union.17 The achievement of this goal requires that disadvantaged groups reduce their risk factors quicker than others21 ,33 Our analysis shows that this is not happening with regard to the reduction of cardiovascular risk factors.
The comparatively low risk of heart disease and diabetes in the UK Chinese population, along with the associated risk factors, is well established,5 ,38 ,39 although these diseases are rising rapidly in China itself.40 The Chinese set an example for the UK population and particularly for other populations with a similar settlement history; for example, Pakistani, Bangladeshi and Caribbean ethnic minority populations.
Without radical change, ethnic inequalities in CVD will increase unless interventions at individual level and group level are targeted at those ethnic minorities that already have relatively high cardiovascular risk and whose risk profile is getting worse.
Inequalities can be reduced in two ways. First, and in line with public health goals, the disadvantaged population improves quicker than the more advantaged one. This is, however, difficult to achieve and presents a formidable challenge to public health research and practice. The challenge is especially great in tackling ethnic inequalities where socioeconomic disadvantage may accompany changing cultures, changing family and social structures and the stresses of recent migration and, minority and non-White status.
Second, inequalities can reduce if the advantaged population's risk profile worsens while the disadvantaged population stays the same. Our data show some worrying evidence of this. Ostensibly, ethnic inequalities had reduced more in relative terms (figure 2) than in absolute terms (figure 1). Unfortunately, as table 1 shows, this happened sometimes because the general population risk profile had worsened and not because the minority population had improved.
These shifting inequalities require urgent attention as England and Scotland roll out their multimillion pound primary care-based cardiovascular screening programmes (Health Checks in England and Keep Well in Scotland).41 Fortunately, recent evidence suggests that ethnic minority populations in the UK respond well when provided with an opportunity to take up well-thought-out and adapted preventative programmes.42 ,43 ,44 People from ethnic minority populations have relatively low knowledge about CHD,45 ,46 ,47 but at least anecdotally, this seems to be changing for the better. Clinical services in the UK are now widely aware that CVD and diabetes are relatively common in the UK South Asian and African origin populations, and the recent evidence of comparatively high uptake of Health Checks in Ealing signals that change is achievable.43 This achievement needs to be emulated widely. However, it is imperative to monitor whether public health and social conditions are reducing ethnic group inequalities in risk factors and disease outcomes. This requires a third ethnically boosted HSE providing comparable data to those presented here and also further studies of mortality trends based on the 2011 census. In the longer term, general practice/primary care records may provide some of the required information with sufficient accuracy to monitor CHD risk factor trends. The need for, and additional value of, assessing trends in risk using risk prediction methods needs consideration. The accuracy and validity of such methods is still debatable,48 particularly in multiethnic settings,49 ,50 although some advances are being made; for example, QRISK.51 Such a method would produce a single number for each ethnic group, which would simplify the analysis but not necessarily the interpretation of findings or guidance on future policy and service delivery. If, as is being considered, there is to be no census in 2021, policymakers need to consider how ethnic inequalities in mortality are to be monitored in the future.
Acknowledgments
Anne Houghton and Arti Nair gave secretarial help to prepare the paper. Prof Aziz Sheikh, Prof Gordon Murray and Dr Paula Primatesta provided helpful advice on an earlier draft. Dr Therese Tillin and Prof Deepak Bhatnagar provided excellent feedback that improved the paper.
References
Supplementary materials
Supplementary Data
This web only file has been produced by the BMJ Publishing Group from an electronic file supplied by the author(s) and has not been edited for content.
Files in this Data Supplement:
- Data supplement 1 - Online supplement
Footnotes
-
Contributors RSB conceived the idea and was the lead writer. RWH undertook most of the analysis and drafted the methods and tables and CMF assisted with analysis and interpretation. All authors helped plan the study, evolve analysis plans, interpret data and critically revise successive drafts of the manuscript.
-
Funding The original Health Survey for England was funded by the Department of Health, and this analysis was partially funded by the research fund under the charitable Cardiovascular Research Fund under RSB's control, holding RSB's donations to the University of Edinburgh.
-
Competing interests None.
-
Ethics approval We have used anonymised published data from the Health Survey for England, which was itself ethically approved.
-
Provenance and peer review Not commissioned; externally peer reviewed.
-
Data sharing statement No additional data are available. The data are in the public domain already.