Article Text

Abstract
Objectives Illegal drug use continues to be a major threat to community health and safety. We used international drug surveillance databases to assess the relationship between multiple long-term estimates of illegal drug price and purity.
Design We systematically searched for longitudinal measures of illegal drug supply indicators to assess the long-term impact of enforcement-based supply reduction interventions.
Setting Data from identified illegal drug surveillance systems were analysed using an a priori defined protocol in which we sought to present annual estimates beginning in 1990. Data were then subjected to trend analyses.
Main outcome measures Data were obtained from government surveillance systems assessing price, purity and/or seizure quantities of illegal drugs; systems with at least 10 years of longitudinal data assessing price, purity/potency or seizures were included.
Results We identified seven regional/international metasurveillance systems with longitudinal measures of price or purity/potency that met eligibility criteria. In the USA, the average inflation-adjusted and purity-adjusted prices of heroin, cocaine and cannabis decreased by 81%, 80% and 86%, respectively, between 1990 and 2007, whereas average purity increased by 60%, 11% and 161%, respectively. Similar trends were observed in Europe, where during the same period the average inflation-adjusted price of opiates and cocaine decreased by 74% and 51%, respectively. In Australia, the average inflation-adjusted price of cocaine decreased 14%, while the inflation-adjusted price of heroin and cannabis both decreased 49% between 2000 and 2010. During this time, seizures of these drugs in major production regions and major domestic markets generally increased.
Conclusions With few exceptions and despite increasing investments in enforcement-based supply reduction efforts aimed at disrupting global drug supply, illegal drug prices have generally decreased while drug purity has generally increased since 1990. These findings suggest that expanding efforts at controlling the global illegal drug market through law enforcement are failing.
- AUDIT
- PUBLIC HEALTH
This is an Open Access article distributed in accordance with the Creative Commons Attribution Non Commercial (CC BY-NC 3.0) license, which permits others to distribute, remix, adapt, build upon this work non-commercially, and license their derivative works on different terms, provided the original work is properly cited and the use is non-commercial. See: http://creativecommons.org/licenses/by-nc/3.0/
Statistics from Altmetric.com
Article summary
Article focus
-
Studies have demonstrated that illegal drug use remains a threat to community health and safety.
-
However, less is known regarding the long-term impact of efforts to reduce the overall supply of illegal drugs.
Key messages
-
Using longitudinal governmental surveillance data, this study demonstrates that during the past two decades, the supply of major illegal drugs has increased, as measured through a general decline in the price and a general increase in the purity of illegal drugs in a variety of settings.
Strengths and limitations of this study
-
This study was limited by the quality and consistency of surveillance data on illegal drug supply.
-
This study presents data on trends in illegal drug supply in a variety of settings during two decades, including consumer and export drug markets.
Objectives
The United Nations (UN) recently estimated that the global illegal drug trade is worth at least US$350 billion annually,1 and illegal drug use remains a major threat to community health and safety.2 ,3 In addition to the range of harm associated with the direct health effects of drugs, including fatal overdose,4 ,5 illegal drug use is also one of the key global drivers of blood-borne disease transmission, in particular HIV infection.6 ,7 Illegal drug markets also contribute to community concerns, such as high rates of violence in settings where the trade proliferates.8
In response to the health and social concerns associated with illegal drug use, several UN conventions were organised to control the possession, consumption and manufacture of illegal drugs.9–11 As a result, during the last several decades, most national drug control strategies have prioritised drug law enforcement interventions to reduce drug supply, despite recent calls by experts to explore alternative models of drug control, such as systems of drug decriminalisation and legal regulation.12–14 Some unintended consequences of this approach, such as record incarceration rates, have been well documented.15–18 In addition, a small number of studies assessing aspects of drug supply, measured through indicators of drug price, purity/potency and seizures, have been undertaken to describe the global relationship between these indicators over the long term.19 However, systematic evaluation of these relationships is still needed to elucidate patterns of drug supply. The present study, therefore, sought to systematically identify international data from publicly available illegal drug surveillance systems to assess long-term estimates of illegal drug supply.
Design
Outcomes of interest
The primary outcomes of interest were long-term patterns of illegal drug supply, measured through indicators of price and purity/potency for three major illegal drugs: cannabis, cocaine and opiates (eg, opium and heroin). While data on amphetamine-type stimulants exist in some countries (eg, the UK), this class of drugs was not included given inconsistent data collection and classification, and fluctuating surveillance periods and overall data quality. A secondary outcome of interest was data on illegal drug seizures in (1) major illegal drug source regions and, (2) major destination markets, as identified by the United Nations Office on Drugs and Crime (UNODC).20 These secondary outcome data were used as an additional proxy measure to assess the availability of illegal drugs in specific regions, as has been carried out previously.21 ,22 All outcomes were systematically identified through publicly available illegal drug surveillance systems. Linear-by-linear association trend tests were carried out on annual estimates of all outcomes of interest. Price and purity estimates represent median values for each year, while estimates for seizures represent crude totals of quantity seized. All price estimates are expressed in 2011 USD and are, where possible, adjusted for purity.23
Illegal drug surveillance systems
An online search of surveillance systems monitoring illegal drugs using two a priori defined inclusion criteria was carried out. Search terms included the following: drugs, illicit, illegal, price, purity, potency, surveillance system, government data, longitudinal, annual, estimate. Inclusion/exclusion criteria were as follows: only surveillance systems that included continuous longitudinal assessments of these outcomes of interest for at least 10 years were included because we specifically sought to assess the long-term impact of enforcement-based supply reduction strategies on illegal drug price and purity/potency. Finally, data extraction was restricted to 1990 and onwards to focus on patterns of supply during recent decades.
Data were obtained through online searches of registries of surveillance systems (eg, governmental websites, UN databases), governmental reports and peer-reviewed publications, through referrals from experts in the field, and through data requests to relevant organisations including the UNODC. All authors had complete access to all data and all had final responsibility to submit for publication. Ethics approval was not required given that we relied exclusively on publicly available data.
Results
We identified seven government surveillance systems that met inclusion criteria. Of these, 3 (43%) reported on international data, 3 (43%) on data from the USA and 1 (14%) on data from Australia. One of the longest running surveillance system identified, the US-based Marijuana Potency Monitoring Project, is funded by the US National Institutes of Health and was established in 1975, while the most recent surveillance system was established in 2001 (eg, the US-based National Drug Threat Assessment). With respect to international surveillance systems, the UNODC administers two separate surveillance systems that collect data from all participating UN member states: the Annual Reports Questionnaire surveillance system that collects price and purity/potency data, and the Drug Seizures Database that collects seizure data. Finally, the European Monitoring Centre for Drugs and Drug Addiction administers the Reitox drug surveillance system network, which aggregates data from several country-level surveillance systems in Europe, as described below.24
Price and purity/potency
Table 1 presents surveillance systems that matched search criteria. An assessment of data provided by these surveillance systems demonstrated several broad trends. First, purity and/or potency of illegal drugs generally remained stable or increased overall during the study period. Second, the price of illegal drugs, with few exceptions, generally decreased. Third, seizures of cannabis, cocaine and opiates generally increased in major drug production regions and major domestic markets.
Major illegal drug data surveillance systems
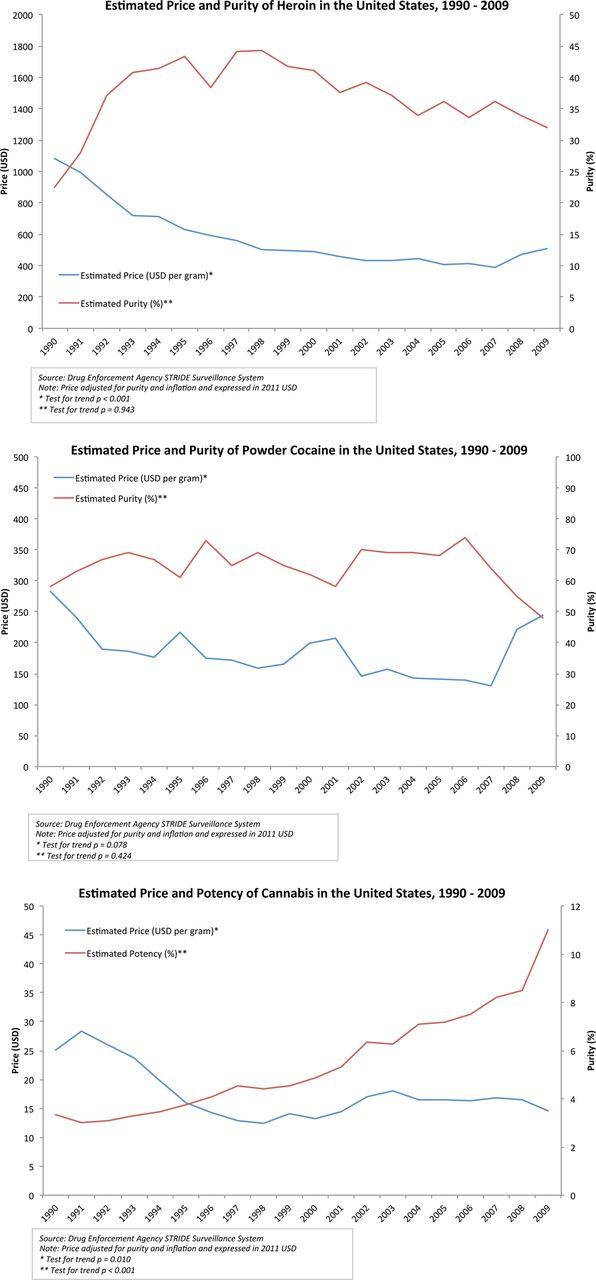
Figure 1 presents data from the US Drug Enforcement Administration's System To Retrieve Information from Drug Evidence (STRIDE). As can be seen, between 1990 and 2007 (the last year for which data are publicly available), the purity of heroin and cocaine, and the potency of cannabis herb in the US increased, while the inflation-adjusted and purity-adjusted retail street prices of these three drugs declined.25 Specifically, heroin purity increased by 60% (p=0.568), cocaine purity increased by 11% (p=0.181) and cannabis herb potency increased by 161% (p<0.001) during this time. During the same period, the prices of heroin, cocaine and cannabis decreased 81% (p<0.001), 80% (p<0.001) and 86% (p<0.001), respectively.

Estimated price and purity of heroin, cocaine and cannabis in the USA, 1990–2009.
Figure 2 presents data collected by the UNODC on the street price of cocaine and opiates in participating European countries (ie, Austria, Belgium, Denmark, Finland, France, Germany, Greece, Italy, Luxembourg, Netherlands, Norway, Iceland, Portugal, Spain, Sweden, Switzerland, UK and Ireland).26 In these countries, between 1990 and 2009, the aggregate average retail street price of cocaine decreased by 51%, from US$198/g to US$98/g (p<0.001). Similarly, the aggregate average price of opiates in Europe decreased 74%, from a high of US$295/g in 1990 to US$77/g in 2009 (p<0.001).

Average inflation-adjusted price of opiates and cocaine in Europe, 1990–2007.
Data from the Australian Illicit Drug Reporting System (IDRS) were available from 2000 to 2010. IDRS data suggest that the price of illegal drugs in Australia fluctuated substantially during this period. Specifically, after adjustment, the price of heroin decreased by 49%, from approximatelyUS$460/g to approximately US$235/g (p<0.001), despite the well-described heroin ‘drought’ of 2001,27 which saw a reduction in the supply and availability of heroin in Australia. Additionally, the price of cocaine decreased 14% from approximately $A255/g to $A220/g (p=0.477), and the price of cannabis decreased 49% from approximately $A25/g to $A13/g (p<0.001).28
Seizures
Domestic markets
Figure 3 presents data on cannabis and cocaine seizures in the USA between 1990 and 2010. As shown, data from the US Drug Enforcement Administration's STRIDE surveillance system demonstrate that the amount of cannabis herb seized by the Drug Enforcement Administration both in, and destined for, the USA increased 465%, from approximately 130 000 kg in 1990 to approximately 720 000 kg in 2010 (p<0.001). During this same period, despite fluctuations, the amount of cocaine seized by the US Drug Enforcement Administration decreased 49%, from approximately 57 000 kg in 1990 to 29 000 in 2010 (p=0.409), whereas the amount of heroin seized increased 29% from approximately 535 kg in 1990 to 690 kg (p=0.979, heroin seizure data not shown).29

Cocaine and cannab is seizures in the USA, 1990–2010.
Figure 4 presents data on cannabis, cocaine and heroin seizures in countries participating in the European Monitoring Centre for Drugs and Drug Addiction's Reitox surveillance network (ie, European Union member countries, as well as Croatia, Norway and Turkey), between 1995 and 2009. As can be observed, annual estimates of the quantity of both cocaine and cannabis herb seized fluctuated throughout this period; however, the quantity of heroin seized increased relatively steadily. Specifically, the number of kilograms of cannabis herb seized was at a low of approximately 57 000 kg in 1995, and peaked 1 year later in 1996 at approximately 138 000 kg (p=0.446). The number of cocaine seizures was at a low of approximately 21 000 kg in 1995, and peaked at approximately 121 000 kg in 2006 (p=0.018). Finally, the number of kilograms of heroin seized increased 380% from a low of approximately 5000 in 1995 to a high of approximately 24 000 in 2009 (p<0.001).

Cocaine, cannabis and heroin seizures in Europe*, 1990–2010.
Production regions
With respect to opiate seizures, the Golden Triangle includes parts of Thailand, Laos, Vietnam and Myanmar, and according to the UNODC, this region is the second largest supplier of heroin globally, although production has declined throughout the last decade, with opium production decreasing by approximately 60% and 90% in Myanmar and Laos, respectively.30 In this region, trends in seizures of opium have fluctuated; 3198 kg of opium were seized in 1990, with a high of 12 462 kg seized in 2007 before a steep decline to 1225 kg in 2010 (p=0.856). Similarly, seizures of heroin fluctuated, with a decrease of more than half, from 1337 kg in 1990, to 627 kg in 2010 (p=0.085), and a peak of 1565 kg seized in 2009. In Afghanistan, which is believed to supply more than 90% of the world's opium,30 seizures of raw and prepared opium increased by more than 12 000%, from 453 kg in 1990 to 57 023 kg in 2010, and seizures of heroin increased by more than 600%, from 1256 kg in 1990 to 9036 kg in 2010 (note: missing data prevented a trend test for annual opium and heroin seizures in Afghanistan).
With respect to cocaine seizures, according to the UNODC, Latin America's Andean region, which includes Peru, Bolivia and Colombia, is the primary global supplier of this drug, as coca leaf is grown exclusively in this region.31 While seizures of cocaine in the Andean region decreased 81%, from 97 437 kg in 1990 to 17 835 kg in 2007 (p=0.028), seizures of coca leaf increased 188% from 601 038 kg in 1990 to 1.73 million kilograms in 2007 (p=0.004). During the same period, the area of coca cultivation in this region declined slightly, from approximately 210 000 to 180 000 ha (p=0.004).
Finally, according to the UNODC, major areas of cannabis cultivation exist in North Africa, Afghanistan and North America. These areas are net exporters of cannabis, although most cannabis-producing countries also produce the drug for internal consumption.20 In North Africa (ie, Algeria, Morocco and Tunisia), seizures of cannabis herb increased by 208% from 67 930 kg in 1990 to 209 445 kg in 2007 (p=0.015). In North America (ie, Canada, the USA and Mexico), seizures of cannabis herb increased by 288% from 782 607 kg in 1990 to 3.05 million kilograms in 2007 (p<0.001). In Afghanistan, while data on cannabis herb seizures are not available, seizures of cannabis resin increased 630% from 5068 kg in 1990 to 36 972 kg in 2006 (p=0.061).
Conclusions
Longitudinal data from government surveillance systems demonstrate that during the past two decades there has been a general pattern of increased illegal drug supply as defined through lower price and higher purity of heroin, cocaine and cannabis. During the same period, patterns of drug seizures either increased or remained stable, although the trends detected in some of these indicators did not reach statistical significance. As such, we conclude, consistent with previous studies,19 that the global supply of illicit drugs has likely not been reduced in the previous two decades. In particular, the data presented in this study suggest that the supply of opiates and cannabis, in particular, have increased, given the increasing potency and decreasing prices of these illegal commodities. These results have implications for the development of evidence-based drug policies, particularly given the interest in novel drug policy approaches in a number of settings in Latin America, North America and Europe.32–34
As noted elsewhere,35 ,36 there are limitations of ecological analyses based on international surveillance systems. First, some states collect little or no data on indicators of illegal drug supply, whereas other states spend significant energy on monitoring drug availability. Second, even in states that closely track indicators of supply, the degree to which seized samples of illegal drugs reflect purity of retail drugs sold on the street is subject to variation, though where possible we presented purity-adjusted prices to address this limitation.23 Nevertheless, the long-term trends in increasing purity and decreasing price presented here likely reflect the overall trends in many regions, though it should be noted that in some regions (eg, Europe), indicators of price and purity may have been strongly influenced by a few countries such as the UK and Spain. In addition, some exceptions in the trends were observed. Australia for instance, while experiencing a significant decrease in the prices of heroin as well as cannabis, did not experience a significant decrease in the price of cocaine, which may reflect the geographic isolation of the region or other market factors. It is also of note that Australia's ‘heroin drought’,37 which saw a sudden drop in measures of the supply and availability of heroin, appears to have had a limited long-term impact on supply, though some experts suggest that it may have resulted in higher levels of polysubstance use among Australian heroin injectors.27 Third, limitations in longitudinal data collection precluded our ability to include amphetamine-type stimulants and other emerging synthetic substances, as this data is limited to certain countries and the focus of this study was on regional trends. It is noteworthy in this regard that the production of synthetic substances—as well as indoor cannabis cultivation—present particular challenges for supply reduction strategies, given that these drugs can be mass produced in clandestine locations regardless of climate or other factors that limit traditional drug production.20 ,38 Finally, while this review focused on patterns of price and purity of selected illegal drugs, these measures are only a marker of drug supply and do not measure other factors determining availability and concomitant rates of drug use. These limitations in assessing global drug supply using classic proxy measures such as price, purity and, to a lesser extent, seizures, suggest that there may be a need to expand the range of measures systematically collected by governments and international bodies such as the UNODC and the European Monitoring Centre for Drugs and Drug Addiction. In particular, meaningfully incorporating measures derived from street-level questionnaires of people who use drugs may provide a more reliable metric of supply and availability. Indeed, some bodies, such as Australia's IDRS, collect such data,28 and this methodological approach should be considered by those coordinating surveillance of illegal drugs. Other bodies have also prioritised emphasising measures of community health including reduced HIV infections, reduced drug-related violence and reductions in number of individuals incarcerated.39 ,40
In summary, longitudinal illegal drug surveillance systems demonstrate a general global pattern of falling drug prices and increasing drug purity and potency, alongside a relatively consistent pattern of increasing seizures of illegal drugs. Although source data have limitations and there are some exceptions to these trends, these findings should be useful given the current debates and drug policy experimentation under way in Latin America, North America and Europe.32–34 It is hoped that this study highlights the need to re-examine the effectiveness of national and international drug strategies that place a disproportionate emphasis on supply reduction at the expense of evidence-based prevention and treatment of problematic illegal drug use.
Acknowledgments
The authors would like to thank Deborah Graham, Peter Vann, Katherine Quayle, Samantha MacLean and Kevin Lutz for their administrative assistance.
References
Supplementary materials
Press release
Press release
Files in this Data Supplement:
Footnotes
-
Contributors All authors contributed substantially to the design and drafting of the manuscript. DW and EW designed the initial methodological approach and drafted the manuscript; TK, BN, SS and JM provided substantial revisions to the manuscript.
-
Funding This study received funding from the Open Society Foundations through the International Centre for Science in Drug Policy (OR2012-01945).
-
Competing interests DW, TK, BN, JM and EW have support from the BC Centre for Excellence in HIV/AIDS for their submitted work; SS has support from the Division of Global Public Health, Department of Medicine, University of California, San Diego. JM has received grants from, served as an ad hoc adviser to, or spoken at events sponsored by Abbott, Argos Therapeutics, Bioject Inc, Boehringer Ingelheim, BMS, Gilead Sciences, GlaxoSmithKline, Hoffmann-La Roche, Janssen-Ortho, Merck Frosst, Panacos, Pfizer Ltd, Schering, Serono Inc, TheraTechnologies, Tibotec (J&J) and Trimeris. DW is supported by the Trudeau Foundation and the Canadian Institutes of Health Research. TK is supported by the Canadian Institutes of Health Research and the Michael Smith Foundation for Health Research.
-
Provenance and peer review Not commissioned; externally peer reviewed.
-
Data sharing statement This study employed publicly available data, as described in the section above.