Article Text

Abstract
Objectives Missing laboratory data is a common issue, but the optimal method of imputation of missing values has not been determined. The aims of our study were to compare the accuracy of four imputation methods for missing completely at random laboratory data and to compare the effect of the imputed values on the accuracy of two clinical predictive models.
Design Retrospective cohort analysis of two large data sets.
Setting A tertiary level care institution in Ann Arbor, Michigan.
Participants The Cirrhosis cohort had 446 patients and the Inflammatory Bowel Disease cohort had 395 patients.
Methods Non-missing laboratory data were randomly removed with varying frequencies from two large data sets, and we then compared the ability of four methods—missForest, mean imputation, nearest neighbour imputation and multivariate imputation by chained equations (MICE)—to impute the simulated missing data. We characterised the accuracy of the imputation and the effect of the imputation on predictive ability in two large data sets.
Results MissForest had the least imputation error for both continuous and categorical variables at each frequency of missingness, and it had the smallest prediction difference when models used imputed laboratory values. In both data sets, MICE had the second least imputation error and prediction difference, followed by the nearest neighbour and mean imputation.
Conclusions MissForest is a highly accurate method of imputation for missing laboratory data and outperforms other common imputation techniques in terms of imputation error and maintenance of predictive ability with imputed values in two clinical predicative models.
This is an Open Access article distributed in accordance with the Creative Commons Attribution Non Commercial (CC BY-NC 3.0) license, which permits others to distribute, remix, adapt, build upon this work non-commercially, and license their derivative works on different terms, provided the original work is properly cited and the use is non-commercial. See: http://creativecommons.org/licenses/by-nc/3.0/
Statistics from Altmetric.com
Article summary
Article focus
-
Multianalyte Assays with Algorithmic Analyses (MAAA) are a relatively new approach to leveraging value from laboratory data to predict clinical outcomes. It is not known how robust MAAA models are when individual laboratory data points are missing.
-
Recent developments in machine learning have used laboratory data to build MAAA models to predict healthcare outcomes—these models can be sensitive to missing laboratory data. It is not known whether modern imputation methods can robustly address the problem of missing data, and whether predictive models will remain accurate when imputed values are used.
-
Multiple methods have been developed in order to deal with missing data, including single imputation, multiple imputation, multivariate imputation by chained equations (MICE), nearest neighbour estimation and missForest. Although these have been shown to be effective with other types of missing data, few data exist regarding the absolute or comparative effectiveness of these methods in accurately imputing missing completely at random laboratory data in predictive models. The aims of our study were (1) to compare the accuracy of four different imputation methods for missing laboratory data in two large data sets and (2) to compare the effect of imputed values from each method on the accuracy of predictive models based on these data sets.
Key message
-
We found that the missForest method consistently produced the lowest imputation error and had the smallest prediction difference when the models used imputed laboratory values.
-
The small absolute changes in predictions with these models, despite 10–30% missing laboratory data, speak of the robustness of these multianalyte assays with algorithmic analyses (MAAA).
-
With the increasing complexity of these models and the increasing numbers of analytes, the risk of missing values increases and methods to cope with missing values and preserve the accuracy of the model are needed. MissForest appears to be a robust and accurate approach to the issue of missing laboratory values when used in these two MAAA.
Strengths and limitations of this study
-
The main limitations of missForest as a solution to missing laboratory data for predictive modelling applications are a requirement for skilled R programming for implementation, and slightly more demanding computational needs, compared to NN or multivariate imputation by chained equations methods.
-
The simulations in this manuscript use data missing at random. The results presented here may not be generalisable to situations in which laboratory values are missing in a biased, non-random way.
-
The strength of this is that the missForest method consistently produced the lowest imputation error and had the smallest prediction difference when the models used imputed laboratory values and that it is a readily available freeware R package, making it a very convenient solution for any practical missing value problems.
Introduction
“You can have data without information, but you cannot have information without data.”
–Daniel Keys Moran
Missing data present a nearly ubiquitous problem when conducting research, particularly when using large data sets. Missing data can occur in the form of random or non-random patterns. Non-random missing data can introduce systematic error and make the study population less representative of the general population. Although random missing data do not introduce systematic error, they lead to significant loss in statistical power and predictive ability. Missing data are rarely completely at random and must be carefully managed. Multianalyte assays with algorithmic analyses (MAAA) are a relatively new approach to leveraging value from laboratory data to predict clinical outcomes. Several of these are now available with implemented CPT codes (ie, FibroSure, risk of ovarian malignancy (ROMA), PreDx Diabetes Risk Score), but it is not known how robust MAAA models are when individual laboratory data points are missing.
Recent developments in machine learning have used laboratory data to build MAAA models to predict healthcare outcomes.1–3 These models can be sensitive to missing completely at random laboratory data, which may result from haemolysed samples, clumped platelets or other uncommon sample or processing problems. It is not known whether imputation methods can robustly address the problem of missing data, and whether predictive models will remain accurate when imputed values are used.
Multiple methods have been developed in order to deal with missing data, including single imputation, multiple imputation, multivariate imputation by chained equations (MICE),3 nearest neighbour estimation (NN),4 and missForest.5 Although these have been shown to be effective with other types of missing data, little data exist regarding the absolute or comparative effectiveness of these methods in accurately imputing missing laboratory data in predictive models. The aims of our study were (1) to compare the accuracy of four different imputation methods for missing completely at random laboratory data in two large data sets and (2) to compare the effect of imputed values from each method on the accuracy of predictive models based on these data sets.
Methods
The University of Michigan (UM) Cirrhosis Cohort and Predictive Model for Hepatocellular Carcinoma
Between January 2004 and September 2006, consecutive patients with cirrhosis but no detectable hepatocellular carcinoma (HCC) were prospectively identified and entered into a surveillance programme using ultrasound and α-fetoprotein (AFP), as has been previously described in greater detail.6 Patients were enrolled if they had a Child-Pugh class A or B cirrhosis and absence of known HCC at the time of initial evaluation. Patients diagnosed with HCC within the first 6 months of enrolment (prevalent cases) were excluded. Other exclusion criteria included clinical evidence of significant hepatic decompensation (refractory ascites, grades 3 and 4 encephalopathy, active variceal bleeding or hepatorenal syndrome), comorbid medical conditions with a life expectancy of less than 1 year, prior solid organ transplant and a known extrahepatic primary tumour. Patients were followed until the time of HCC diagnosis, liver transplantation, death or until the study was terminated on 31 July 2010.
The following demographic and clinical data were collected at the time of enrolment: age, gender, race, body mass index (BMI), medical history, lifetime alcohol use and lifetime tobacco use. Data regarding their liver disease included the underlying aetiology and presence of ascites, encephalopathy or oesophageal varices. Laboratory data of interest at the time of enrolment included platelet count, aspartate aminotransferase (AST), alanine aminotransferase (ALT), alkaline phosphatase, bilirubin, albumin, international normalised ratio (INR) and AFP. This data set was used as the basis of a published predictive model to identify patients with hepatocellular carcinoma with a c statistic of 0.70.2
The UM Inflammatory Bowel Disease Cohort and Predictive Model for Thiopurine Clinical Response
The study sample included all patients who had thiopurine metabolite analysis, complete blood count, and a comprehensive chemistry panel drawn within a 24 hour period at the University of Michigan between 1 May 2004 and 31 August 2006 and is described in greater detail in the manuscript.1 This study was approved by the University of Michigan Medical Institutional Review Board with a waiver of explicit consent from the participants. The patient sample included 774 cases in a total of 346 individuals. For the analysis of the outcome of clinical response to thiopurines, 5 exclusion criteria were applied: exclusion of patients who did not have IBD, exclusion of patients who had not started on thiopurines at the time when the metabolites were measured, exclusion of patients on biological antitumour necrosis factor therapy, exclusion of patients without documentation of their clinical status at the time of laboratory measurement, and exclusion of patients who had an infection that confounded assessment of clinical response. This data set was used as the basis of a predictive model to identify patients with clinical response to thiopurine immune suppressant medication with a c statistic of 0.86.1
Description of imputation techniques
We compared missForest with three other commonly used imputation methods that can handle both continuous and categorical variables, namely, mean imputation, NN and MICE. We briefly introduce these methods below.
The recently proposed missForest method makes use of highly flexible and versatile random forest models7 ,8 to achieve missing value imputation. It creates a random forest model for each variable using the rest of the variables in the data set and uses that to predict the missing values for that variable. This is done in a cyclic fashion for all variables and the entire process is iteratively repeated until a stopping criterion is attained. The advantages of using the random forest model are that it can handle continuous as well as categorical responses, requires very little tuning, and provides an internally cross-validated error estimate. This was implemented via the ‘missForest’ package available in R.5 ,9
The nearest neighbour algorithms were originally proposed in the supervised pattern recognition literature. Troyanskaya et al4 proposed an imputation method based on the nearest neighbour search. The basic idea is to compute a distance measure between each pair of observations based on the non-missing variables. Then the k-nearest observations that have non-missing values for that particular variable are used to impute a missing value through a weighted mean of the neighbouring values. In order to accommodate both continuous and categorical variables, the Gower distance is used.10 For the categorical variables, we imputed the missing values by weighted mode instead of a weighted mean as used for continuous variables. Cross-validation error measures are used to select the optimal number of nearest neighbours denoted by k. The function ‘kNN’ in R package ‘VIM’ was used to implement this method.11
Mean imputation is one of the most naive and easiest methods for imputing missing values. The mean (for continuous variables) or mode (for categorical variables) of the non-missing values of each variable were used to impute the missing values. This method does not take advantage of any correlation among the variables and therefore can perform rather poorly when such correlations are present.
MICE was proposed by Van Buuren et al.3 It requires the user to specify a conditional model for each variable, using the other variables as predictors. By default, we used a linear regression model for continuous variables, a logistic regression model for binary variables and a polytomous logistic regression for categorical variables with more than two levels. The algorithm works by iteratively imputing the missing values based on the fitted conditional models until a stopping criterion is satisfied. In that way, it is very similar to the missForest algorithm, the main difference being that missForest uses more flexible decision trees for each conditional model. We implemented this in R using the package ‘mice’.12
Statistical analysis
We used two separate studies to perform the comparison between the methods of imputation described in the previous section. We describe the studies, implementation details and our results below. The structure of the statistical analysis is the same for both studies. We start with a published predictive model built with the training data set. The test set refers to observations that were not part of the training set; these were solely used for assessing the performance of the model. The test sets did not have any missing values, so we randomly removed a proportion of values to simulate data missing completely at random. We then imputed the missing values by the four previously discussed methods, and the imputed laboratory results were compared with the actual values that were removed from the data set. We then used the imputed data to make clinical outcome predictions with the published models, and the results were compared with the predictions made using the complete test data with no missing data. The prediction models were created using both logistic models and random forest models, as some might argue that using random forest imputation methods might favour the random forest prediction models. We use the average relative error (for continuous variables) and misclassification error (for categorical variables) to assess the imputation performance for both the logistic and random forest models. To quantify the effect of the imputation on predictive models, we compare the predicted classes from non-missing test data with predicted classes from imputed test data and compute the misclassification error for the logistic as well as random forest models. This is important because if a particular variable had very little influence on the predictive model, then larger imputation errors are tolerable, resulting in negligible loss of prediction accuracy. On the other hand, small imputation errors in very important variables might lead to a significantly different predicted class, which is of greater clinical concern. We varied the frequency of missing values to change the difficulty of the imputation problem. We report the average results over multiple random runs. We found that the nearest neighbour results are quite robust to the choice of number of nearest neighbours (k) if k is moderately large; therefore, we fixed the number of nearest neighbours at 5 in both studies.
Results
Cirrhosis cohort and HCC model
This study evaluated the effect of imputation on a published predictive model for HCC based on 21 predictor variables that included demographic, clinical and laboratory values using random forest modelling.2 The random forest model was developed on a data set of 446 patients collected at the University of Michigan (UM cohort). It proved to be more accurate than traditional logistic regression models. Of the 21 variables, 10 of them were categorical in nature while 11 were continuous. We used the first 200 observations from the publicly available data set from the HALT-C trial as our test set and randomly replaced 10%, 20% or 30% of the observations with missing values. The process was repeated for 1000 replications and we report the average results.
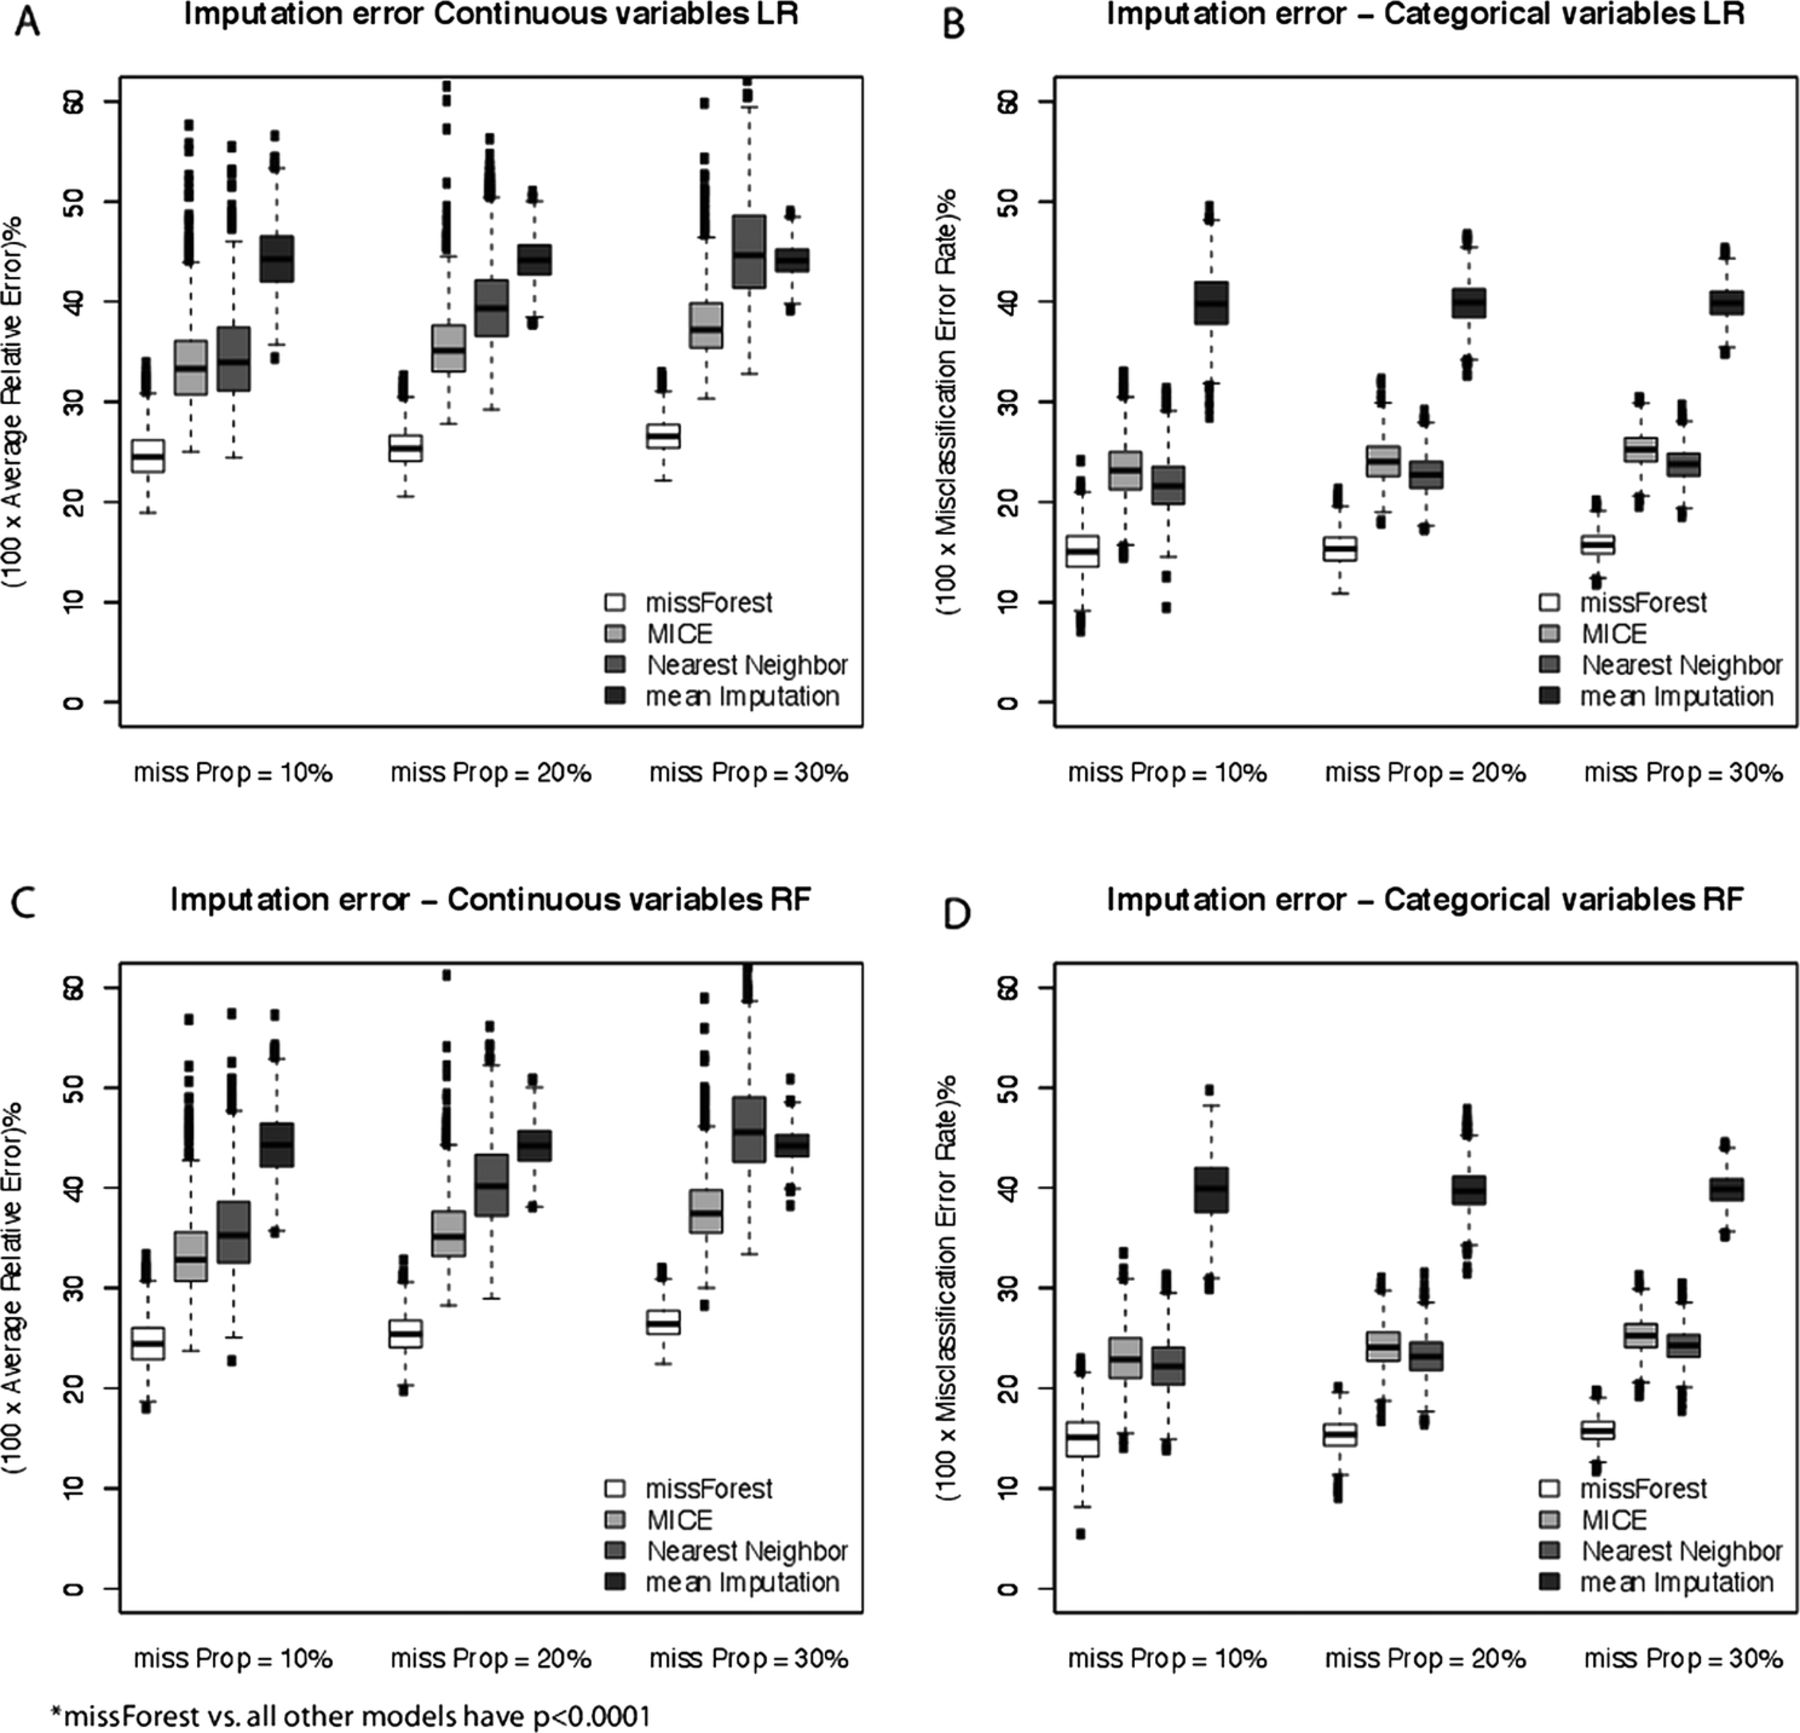
The accuracy of the four imputation methods for both continuous and categorical variables are compared in figure 1 for the cirrhosis cohort and HCC model. Figure 1A,B represents the logistic model and figure 1C,D reflects the random forest prediction model. The vertical axis plots the percentage relative error for continuous variables and percentage misclassification error for categorical variables, while the horizontal axis groups the results according to the proportion of missing values. Each boxplot represents the error measure over 1000 random replications. As expected, the imputation error increases on average as we increase the proportion of missing values in the test data, but the variation tends to reduce slightly, which is due to averaging over many more missing observations. MissForest has the least imputation error for continuous as well as categorical variables at each level of missing proportion, followed by MICE, NN and the mean imputation of continuous laboratory values. MICE and NN have similar imputation accuracy for categorical variables. MissForest works well using both logistic and random forest prediction models.

Imputation error comparison for categorical and continuous variables for four competing imputation methods at three levels of the proportion of missing values for the logistic prediction model (A and B) and random forest prediction model (C and D) in the hepatocellular carcinoma study.
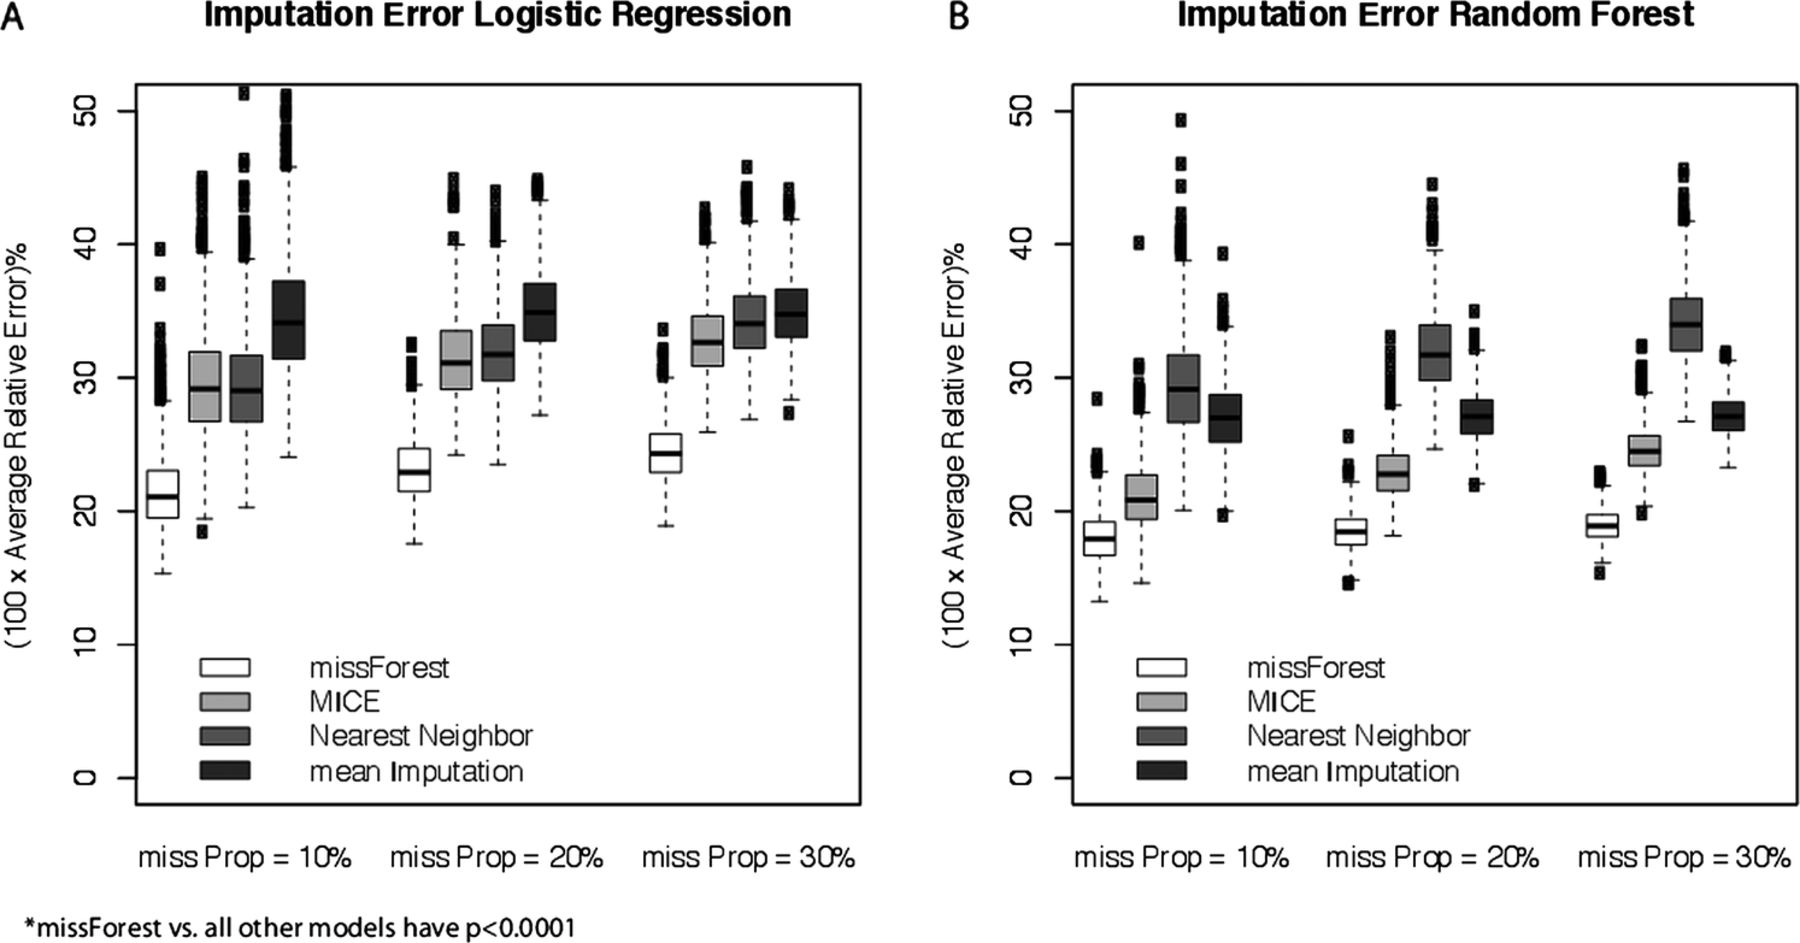
In figure 2A,B, which represents the logistic and random forest prediction models respectively, the vertical axis plots the error measure for imputation on the predictive model, obtained by comparing the predicted classes (Low Risk/High Risk) for each test observation with no-missing values against the predicted class after imputing the artificial missing values. Therefore, an error measure of 5 on the vertical axis implies that 5% of the test observations had their predicted classes wrongly switched (either low risk→high risk or high risk→low risk) due to the imputation. As above, each boxplot reflects the results of 1000 random runs. It is clear from the figure that missForest performs the best with NN and MICE following closely. The gap increases as we increase the proportion of missing observations, making the problem harder.

Percentage of wrongly predicted observations after missing value imputation by the four competing methods at three levels of missing value proportions in the test data for the logistic prediction model (A) and the random forest prediction model (B) in the hepatocellular carcinoma study.
Inflammatory bowel disease cohort and thiopurine clinical response model
Waljee et al1 showed that the random forest models using laboratory values outperform 6-thioguanine (6-TGN) metabolite tests as well as traditional logistic regression models in predicting clinical response to thiopurines. The analysis was carried out on a data set collected at the University of Michigan that included 395 patients. Twenty-six variables, which included 25 laboratory values and age, were used to predict the clinical response of each patient. In this study, all of the variables were continuous in nature. To create a separate test set, we split the data set randomly into a training set consisting of 250 observations and a test set of 145 observations, using stratified sampling to keep the ratio of the clinical responder to non-responders fixed. We then introduced random missing values into the test set as before and performed the same comparative study of the four imputation methods. The whole process was replicated 1000 times to obtain stable results. We summarise below our findings via boxplots.
Again in this study, missForest beats its competitors in both imputation accuracy and the effect of imputed values on the accuracy of clinical predictions based on the logistic model (figure 3A) and the random forest model (figure 3B). The trends remain the same for imputation error, figure 4A,B representing the logistic models and random forest models respectively, with MICE coming out second best followed by NN and mean imputation. For predictive accuracy, we find that the relative order becomes missForest>MICE>mean imputation>NN. This also shows that the best method with respect to imputation error need not be the best when we consider the effect of imputation on predictive models. The performance gap between missForest and MICE is considerably lower than in the previous study. This might be explained by the fact that, in the thiopurine study, both the training and test sets came from the same cohort, as we generated the training and test sets by random splits, while in the HCC study the training and test sets were completely different cohorts leading to an extra degree of variation.
Imputation error for four competing imputation methods at three levels of the proportion of missing values for the logistic prediction model (A) and random forest prediction model (B) in the Thiopurine response model.

Percentage of wrongly predicted observations after missing value imputation by the four competing methods at three levels of missing value proportions in the test data for the logistic prediction model (A) and the random forest prediction model (B) in the Thiopurine response model.
Discussion
We have performed an extensive simulation study using two clinical data sets and two published predictive models to compare the performance of four methods of missing value imputation for missing data completely at random. We included both local (randomForest) and global (logistic) modelling approaches to avoid bias that might favour a local (missForest) imputation approach. While the superiority of missForest for imputation of missing lab values will not be generalisable to all predictive models or data sets, this manuscript highlights the value of missForest to impute missing data. We compared four popular methods, namely missForest, nearest neighbour, MICE and mean imputation, in two studies simulating data missing completely at random. We found that these simulation methods consistently produced the lowest imputation error and had the smallest prediction difference when the models used imputed laboratory values. In addition, the ready availability of the freeware R package makes missForest and its simulations a very convenient solution for any practical missing value problems. The main limitations of these simulations as a solution to missing laboratory data for predictive modelling applications are: a requirement for skilled R programming for implementation, and slightly more demanding computational needs, compared to NN or MICE methods. An additional limitation in this study is that these simulations did not address the issue of data missing for non-random reasons. There could be an association between the clinical outcome of interest and the missingness of certain predictors. At this point, we cannot generalise these results to situation in which data are missing for non-random reasons.
The small absolute changes in predictions with these models, despite 10–30% missing laboratory data, speak of the robustness of these multianalyte assays with algorithmic analyses (MAAA). MAAA are currently a hot topic, and several have been released with CPT codes in 2012. One example is the HCV FibroSure (LabCorp, code 0001M), which uses ALT, α-2 macroglobulin, apolipoprotein A1, total bilirubin, GGT and haptoglobin to estimate fibrosis and necroinflammatory activity in the liver in patients with hepatitis C. With the increasing complexity of these models and the increasing numbers of analytes, the risk of missing completely at random values increases and methods to cope with missing values and preserve the accuracy of the model are needed. MissForest appears to be a robust and accurate approach to the issue of missing laboratory values when used in these two MAAA and may be applicable to other data sets with missing completely at random data sets.
Footnotes
AKW and AM contributed equally to this work and should be considered co-first authors.
-
Contributors AM was involved in the study concept and design, statistical analysis and interpretation of the data, drafting and critical revision of the manuscript. AKW was involved in the study concept and design, acquisition of the data, statistical analysis and interpretation of the data, drafting and critical revision of the manuscript and study supervision. AGS was involved in the acquisition of data, drafting and critical revision of the manuscript. YZ was involved in statistical analysis and interpretation of the data and critical revision of the manuscript. JW, UB and JM were involved in the study concept and design, and in the critical revision of the manuscript. JZ was involved in statistical analysis and interpretation of the data and critical revision of the manuscript. PDRH was involved in the study concept and design, acquisition of the data, statistical analysis and interpretation of the data, critical revision of the manuscript and study supervision. All authors have read and approved the final manuscript.
-
Funding AKW’s research is funded by a VA HSR&D CDA-2 Career Development Award 1IK2HX000775. AGS's was conducted with support from Center for Translational Medicine, NIH/NCATS Grant Number KL2TR000453 and an ACG Junior Faculty Development Award. PDRH’s research is supported by NIH R01 GM097117. The content is solely the responsibility of the authors and does not necessarily represent the official views of the Center for Translational Medicine, the University of Texas Southwestern Medical Center at Dallas and its affiliated academic and healthcare centers, the National Center for Advancing Translational Sciences, the Veterans Affairs, or the National Institutes of Health.
-
Competing interests None.
-
Ethics approval University of Michigan, IRB.
-
Provenance and peer review Not commissioned; externally peer reviewed.
-
Data sharing statement A prediction model using the cross-sectional data from the hepatocellular carcinoma cohort has been submitted to the American Journal of Gastroenterology.