Article Text

Abstract
Objective To estimate the association between centre volume and patient outcomes in peritoneal dialysis, explore robustness to residual confounding and predict the impact of policies to increase centre volumes.
Design Registry-based cohort study with probabilistic sensitivity analysis and Monte Carlo simulation of (hypothetical) intervention effects.
Setting 112 secondary-care centres in France.
Participants 9602 adult patients initiating peritoneal dialysis.
Main outcome measures Technique failure (ie, permanent transfer to haemodialysis), renal transplantation and death while on peritoneal dialysis within 5 years of initiating treatment. Associations with underlying risk measured by cause-specific HRs (cs-HRs) and with cumulative incidence by subdistribution HRs (sd-HRs). Intervention effects measured by predicted mean change in cumulative incidences.
Results Higher volume centres had more patients with diabetes and were more frequently academic centres or associative groupings of private physicians. Patients in higher volume centres had a reduced risk of technique failure (>60 patients vs 0–10 patients: adjusted cs-HR 0.46; 95% CI 0.43 to 0.69), with no changed risk of death or transplantation. Sensitivity analyses mitigated the cs-HRs without changing the findings. In higher volume centres, the cumulative incidence was reduced for technique failure (>60 patients vs 0–10 patients: adjusted sd-HR 0.49; 95% CI 0.29 to 0.85) but was increased for transplantation and death (>60 patients vs 0–10 patients: transplantation—adjusted sd-HR 1.53; 95% CI 1.04 to 2.24; death—adjusted sd-HR 1.28; 95% CI 1.00 to 1.63). The predicted reduction in cumulative incidence of technique failure was largest under a scenario of shifting all patients to the two highest volume centre groups (0.091 reduction) but lower for three more realistic interventions (around 0.06 reduction).
Conclusions Patients initiating peritoneal dialysis in high-volume centres had a considerably reduced risk of technique failure but simulations of interventions to increase exposure to high-volume centres yielded only modest improvements.
- Peritoneal dialysis
- Sensitivity analysis
- Intervention simulation
- Confounding
- Volume-outcome association
This is an open-access article distributed under the terms of the Creative Commons Attribution Non-commercial License, which permits use, distribution, and reproduction in any medium, provided the original work is properly cited, the use is non commercial and is otherwise in compliance with the license. See: http://creativecommons.org/licenses/by-nc/3.0/ and http://creativecommons.org/licenses/by-nc/3.0/legalcode
Statistics from Altmetric.com
Article summary
Article focus
-
An important goal in peritoneal dialysis is delaying the permanent transfer of patients to haemodialysis, known as technique failure, without a negative impact on patients’ risk of transplantation or death.
-
Previous research has reported a lower risk of technique failure in peritoneal-dialysis centres with higher patient numbers (‘volume’) but has not explored the robustness of these findings to residual confounding or the likely impact of interventions to change centre volumes on technique failure or transplantation and death.
-
We estimated the volume-outcome association in peritoneal-dialysis services in the French healthcare system, assessed robustness to unmeasured confounding factors and predicted the impact on patient outcomes of different policies aiming to increase centre volumes.
Key messages
-
Higher centre volumes were associated with a reduced risk of technique failure without any change in the risk of transplantation or death; the higher probability (cumulative incidence) of observing transplantation or death while on peritoneal dialysis resulted simply from patients staying longer on peritoneal dialysis in higher volume centres.
-
The reduced risk of technique failure in higher volume centres was robust to scenarios of unmeasured confounding.
-
However, the predicted impact of different interventions to increase patients’ exposure to high-volume centres was only modest, suggesting that such policies may have a lesser impact than that implied by research until now.
Strengths and limitations of this study
-
The large patient sample drawn from a registry with high coverage of peritoneal-dialysis patients in France, analytic methods adapted to competing outcomes necessary for data structures of this type, the use of probabilistic sensitivity analysis techniques to explore robustness of findings, and the exploration of plausible intervention effects from observational data.
-
The exclusion of patients treated by private-sector physicians owing to the limited range of volumes in this sector, the need to cap volume-outcome effects at the highest volume group to avoid extrapolating off data, and the lack of data on outcomes for patients after transfer to haemodialysis.
Introduction
Peritoneal dialysis is an alternative to haemodialysis for patients with chronic renal failure who require replacement of their kidney function. Peritoneal dialysis uses the peritoneal membrane, rather than an external artificial membrane, to remove fluid and solutes from the blood and thus allows patients to manage their dialysis sessions at home. Practice guidelines flag several clinical reasons for preferring peritoneal dialysis to haemodialysis1 and patients with certain lifestyle needs may also prefer peritoneal dialysis because of the relative autonomy it allows. There are therefore arguments for attempting to maintain patients initiating peritoneal dialysis on the modality for as long as medically appropriate.
One of the challenges in peritoneal dialysis is delaying permanent transfer to haemodialysis, known as ‘technique failure’. Technique failure can occur because of clinical complications, such as repeated peritonitis episodes, and non-clinical reasons such as patient or carer burnout,2 ,3 making it a potential target for efforts to maintain patients longer on peritoneal dialysis. This has led some researchers, inspired by favourable ‘volume-outcome’ associations in other areas of medicine,4–11 to look at whether the risk of technique failure differs according to the number (volume) of peritoneal-dialysis patients in treating centres. This work has been globally encouraging, with all five studies until now finding a reduced risk of technique failure in larger centres12–16 with either equivalent12 ,14 ,16 or lower15 mortality in larger centres. This has led some to suggest policies which promote high-volume peritoneal-dialysis services.14 ,17
However, it is not yet clear if the reduced risk of technique failure observed in high-volume centres is a causal effect or, rather, is due to unmeasured confounding. In fact, residual confounding at the centre level seems likely. In our experience, different clinical teams have different attitudes towards peritoneal dialysis, with ‘pro-peritoneal-dialysis’ teams plausibly starting more patients on the modality and handling technical difficulties better. This would increase centre volume and delay technique failure, thereby acting as a confounder which is not easily measured and addressed in epidemiological analyses. Sensitivity analyses may therefore be valuable in understanding robustness to unmeasured confounding before moving to policy recommendations.
Another knowledge gap to address before applying these results to policy is whether the association measures reported until now plausibly reflect the impact of interventions to change centre volumes. This may not be so for at least two reasons. First, studies have not explicitly addressed the competing nature of the different outcomes which peritoneal-dialysis patients face (transplantation and death, in addition to technique failure),18 ,19 although these should be modelled together to understand the net impact of centre volume on the probability (ie, cumulative incidence) of each outcome. Second, to our knowledge, mechanisms by which potential interventions plausibly affect centre volumes and outcomes have not yet been defined, even though the net effect of an intervention will depend on the strength with which it changes volumes, the mechanism by which it exerts its effect (eg, through centre experience and resources)13–16 and any additional pathways activated.
Inspired by recent calls to make epidemiological analyses more directly relevant to policy,20–23 we therefore aimed to estimate the volume-outcome effect in peritoneal-dialysis services in the French healthcare system, to assess robustness to residual confounding and to explore implications for policy decisions.
Methods
Data source
We used data from the Registre de Dialyse Péritonéale de Langue Française (RDPLF),24 a peritoneal-dialysis registry with an estimated 85% coverage of all patients in France, in 2011 (C Verger, personal communication, 2013). We identified all adult (≥18 years old) patients in the RDPLF database who started peritoneal dialysis between 1 January 2000 and 31 December 2009 in metropolitan France and determined their treatment status at 31 December 2010. We then excluded patients whose treating centre joined RDPLF less than 2 years before their date of starting treatment (to ensure sufficient data to calculate centre volume, described below); patients treated in private clinics as the volumes of these centres was restricted compared with other centre types and patients who changed centres during follow-up.
Centre volume measure
We calculated the number of patients on peritoneal dialysis per day in each patient's treating centre over the 12 months prior to each patient's date of starting peritoneal dialysis (‘prevalent measure’) and the total number of patients initiating peritoneal dialysis in each patient's centre over the same period (‘incident measure’). As the two measures were highly correlated (Pearson's r=0.82), we used the prevalent measure as the centre volume variable but included the incident measure in the missing-data imputation models, which are described below.
Patient outcomes
Patient outcome was the first to occur of technique failure, renal transplantation, death and partial recovery of renal function. Technique failure is defined in the RPDLF database as permanent transfer to haemodialysis as reported by the treating nephrologist. Recovery of renal function is not presented as it occurred rarely (1.5% of patients; results available upon request).
Covariables
For each patient, we extracted: sex; nephropathy; previous treatment for renal failure; age and Charlson comorbidity index minus the age component at peritoneal-dialysis initiation; diabetes status at last consultation; peritoneal-dialysis modality and type of assistance at 90 days after peritoneal-dialysis initiation25 ,26; and type of treating centre. We also extracted cause of death and reason for transfer to haemodialysis when appropriate.
Statistical analysis
We first described the data by presenting the count and percentage in each class for categorical variables; the median and IQR for continuous variables (all of which had mildly non-normal distributions) and the count and percentage of missing values for each variable. We then imputed five complete data sets using multivariate imputation by chained equations,27 ,28 including all the covariables listed above, as well as the prevalent and incident measures of centre volume and patient outcomes in the imputation model.29
Estimation of volume-outcome associations
To measure the association between centre volume and each patient's outcome, we calculated the cause-specific HRs (cs-HRs) using the Cox regression models and subdistribution HRs (sd-HRs) using the Fine and Gray regression models. In a competing-risk context, cs-HRs reflect the relative change in the hazard of each outcome associated with different exposure levels. sd-HRs reflect the relative association between the cumulative incidence (probability) of each outcome and the different exposure levels.30 ,31
We modelled centre volume as a categorical variable with seven classes since exploratory modelling with p-splines suggested non-linearity. We calculated the unadjusted HRs and HRs adjusted on a priori confounders of age, sex, comorbidity index, diabetes, previous treatment, type of assistance and type of treating centre at 5 years’ follow-up. The Cox models combined results from the five imputed data sets; the Fine and Gray models used one imputed data set. We reported HRs with 95% CIs calculated using robust variances to account for clustering of patients within centres. The supplementary material explains the choice of confounders and presents additional model results (30-day and 1-year follow-up) as well as the cs-HRs and sd-HRs at 5-year follow-up from a complete-case analysis (ie, excluding all patients with any missing data).
Sex, diabetes, previous treatment and assistance were included as stratification variables in the final Cox models as they appeared not to meet the proportional-hazards assumption based on the Schoenfeld residual plots. Age, sex and previous treatment showed small deviations from proportional hazards in the Fine and Gray models; however, the regression coefficients for centre volume did not change upon introducing time-interaction terms32 (data not shown), and therefore we only used main covariate terms in the final models. No influential points were identified on dfβ plots.
Sensitivity analysis for robustness to unmeasured confounding
To explore the robustness of the volume-technique-failure association to unmeasured confounding, we used methods for probabilistic sensitivity analysis to impute an unmeasured centre-level confounder variable.33 ,34 For this, we extracted the random effect for each centre from a mixed-effects Cox model regressing technique failure on volume and the prior confounders.32 The random effect reflected each centre's residual association with technique failure. Next, we attributed a probability for the presence of the confounder variable in each centre as:
where Pr(statement) is the probability that the statement is true, B is the binary unmeasured confounder, expit is the inverse-logit function and VSND and RSND are the volume and random effect after normalisation and standardisation.
We defined scenarios of low, mid and high residual confounding by setting βV=βR=0.5, βV=βR=1.0, and βV=βR=2.0, respectively. The low-confounding scenario meant that an increase (decrease) of 1 SD in these variables was associated with an OR of 1.6 (0.61) that B=1. Corresponding ORs were 2.7 (0.37) for the mid-confounding scenario and 7.4 (0.14) for the high-confounding scenario. B was then imputed as 0 or 1 for each centre by a Bernoulli trial. Finally, we re-estimated the cs-HRs adjusted on the a priori confounders and the imputed confounder. These models used one imputed data set only. We repeated the above steps 1000 times and calculated the summary cs-HRs and 95% CIs for each scenario using the median values of the regression coefficients and SDs.
Intervention estimates
Finally, we estimated the impact of four hypothetical interventions to change centre volumes on the cumulative incidence of each patient outcome. The interventions depended on a set of assumptions (presented in detail in the online supplementary material): an indirect causal effect of volume on outcomes through variables such as resources and experience13–16; an interaction between volume and these variables, requiring adequate resources and experience to improve technique survival; and a stable system without any large, sustained changes in centre volumes during the study period (supported by the data, not shown).
The interventions are described in table 1. The first three were ‘patient-diversion’ interventions which send patients from small centres to larger centres with different assumptions about the effect on volumes. Intervention #4 was a ‘prioritise peritoneal dialysis’ approach in which patients starting dialysis are preferentially started on peritoneal dialysis, rather than haemodialysis, within their existing centres.
Predefined effects of each hypothetical intervention on centre volume
The steps in simulating the interventions are in the flow chart in the web appendix. For each intervention, we defined probability distributions representing how variables would change (table 1) and drew a random value from these distributions for each simulation run.33 ,34 After 1000 runs, we calculated the difference in the mean predicted cumulative incidence at 5 years between the intervention and no-intervention groups for each outcome. We represented uncertainty by 95% central prediction intervals.
All analyses were performed with R V.2.15.1,35 including the packages survival, mice, pspline, cmprsk and timereg.
Results
Of the 11 068 patients identified, 700 were treated by private physicians, 532 were in centres without 2 years of registry participation at the time of initiating treatment and 125 changed centres during the study period. The analysis therefore included 9602 patients (86.8% of total eligible) in 112 centres. Of these patients, 3883 (40.4%) died; 2519 (26.2%) were permanently transferred to haemodialysis; 1609 (16.8%) were transplanted; 143 (1.5%) experienced a return of renal function; 1192 (12.4%) were administratively censored and 256 (2.7%) were censored lost-to-follow-up. Median follow-up time was 16.9 months (IQR 7.7–30.4).
Centre volume
Patients were exposed to centre volumes ranging from 0 to 76 patients, with a median of 25 (IQR 17–38). The most frequent volume category was 21–30 patients, closely followed by 11–20 patients (table 2). The three smallest volume categories included over 50 centres each, with a marked reduction in the number of centres in each volume category beyond 30 patients (table 2).
Patient characteristics by centre volume
Patient and centre characteristics
Patients in the different centre volume categories had similar demographic and clinical characteristics (table 2). There was no trend in sex, age, comorbidity index, type of peritoneal dialysis or type of assistance across volume categories, although the proportion of patients with diabetes mellitus and diabetic nephropathy tended to increase with increasing centre volume. In contrast, the type of treating centre varied considerably across volume groups: as volume increased, the proportion of patients initiating peritoneal dialysis in university hospitals increased and the proportion initiating treatment in general hospitals decreased.
Cause-specific HRs
Increasing centre volume was associated with a reduced risk of technique failure at 5 years of follow-up, with cs-HRs decreasing as centre volume increased in a dose–response pattern (figure 1). The cs-HRs showed no association between centre volume and death. Although there was no clear trend in the association with transplantation, the cs-HRs were smaller for mid-size centre groups (figure 1). Compared with the 0–10 patients volume group, the adjusted cs-HRs for technique failure for the 11–20, 21–30, 31–40, 41–50, 51–60 and >60 centre volume groups were 0.77 (95% CI 0.65 to 0.90), 0.70 (95% CI 0.57 to 0.87), 0.55 (95% CI 0.43 to 0.69), 0.54 (95% CI 0.40 to 0.73), 0.37 (95% CI 0.26 to 0.53) and 0.46 (95% CI 0.26 to 0.81), respectively. For death, the corresponding cs-HRs were 1.00 (95% CI 0.87 to 1.14), 1.06 (95% CI 0.91 to 1.24), 1.05 (95% CI 0.88 to 1.25), 0.99 (95% CI 0.80 to 1.23), 0.98 (95% CI 0.80 to 1.19) and 0.99 (95% CI 0.72 to 1.36). For transplantation, the corresponding cs-HRs were 1.00 (95% CI 0.80 to 1.27), 0.80 (95% CI 0.63 to 1.01), 0.80 (95% CI 0.62 to 1.02), 0.92 (95% CI 0.63 to 1.34), 0.99 (95% CI 0.71 to 1.40) and 1.08 (95% CI 0.73 to 1.61). The unadjusted and adjusted estimates for all outcomes were similar (see online supplementary material). These estimates were also similar to those from a complete-case analysis, noting some modest differences in the >60 volume group (see online supplementary material). These did not alter the overall pattern.

Cause-specific HRs for centre volume and technique failure transplantation and death within 5 years of initiating peritoneal dialysis according to centre volume.
Subdistribution HRs
Increasing volume was associated with a reduced cumulative incidence of technique failure at 5 years of follow-up (figure 2), again with a dose–response pattern. In contrast, increasing centre volume was associated with an increased cumulative incidence of death and renal transplantation (figure 2). Compared with the 0–10 patients volume group, the adjusted sd-HRs for technique failure for the 11–20, 21–30, 31–40, 41–50, 51–60 and >60 centre volume groups were 0.76 (95% CI 0.64 to 0.91), 0.74 (95% CI 0.60 to 0.93), 0.57 (95% CI 0.46 to 0.72), 0.56 (95% CI 0.41 to 0.76), 0.39 (95% CI 0.29 to 0.54) and 0.49 (95% CI 0.29 to 0.85), respectively. For death, the corresponding sd-HRs were 1.08 (95% CI 0.93 to 1.26), 1.18 (95% CI 0.99 to 1.40), 1.15 (95% CI 0.95 to 1.39), 1.20 (95% CI 0.98 to 1.47), 1.20 (95% CI 0.98 to 1.47) and 1.28 (95% CI 1.00 to 1.63). For transplantation, the corresponding sd-HRs were 1.24 (95% CI 0.95 to 1.62), 1.10 (95% CI 0.84 to 1.43), 1.21 (95% CI 0.90 to 1.62), 1.26 (95% CI 0.87 to 1.82), 1.44 (95% CI 1.04 to 2.00) and 1.53 (95% CI 1.04 to 2.24). The unadjusted and adjusted estimates for all outcomes were similar (see online supplementary material). These estimates were also similar to those from a complete-case analysis, noting a tendency towards higher sd-HRs for transplantation in the imputed data set (see online supplementary material). This did not alter the overall pattern.
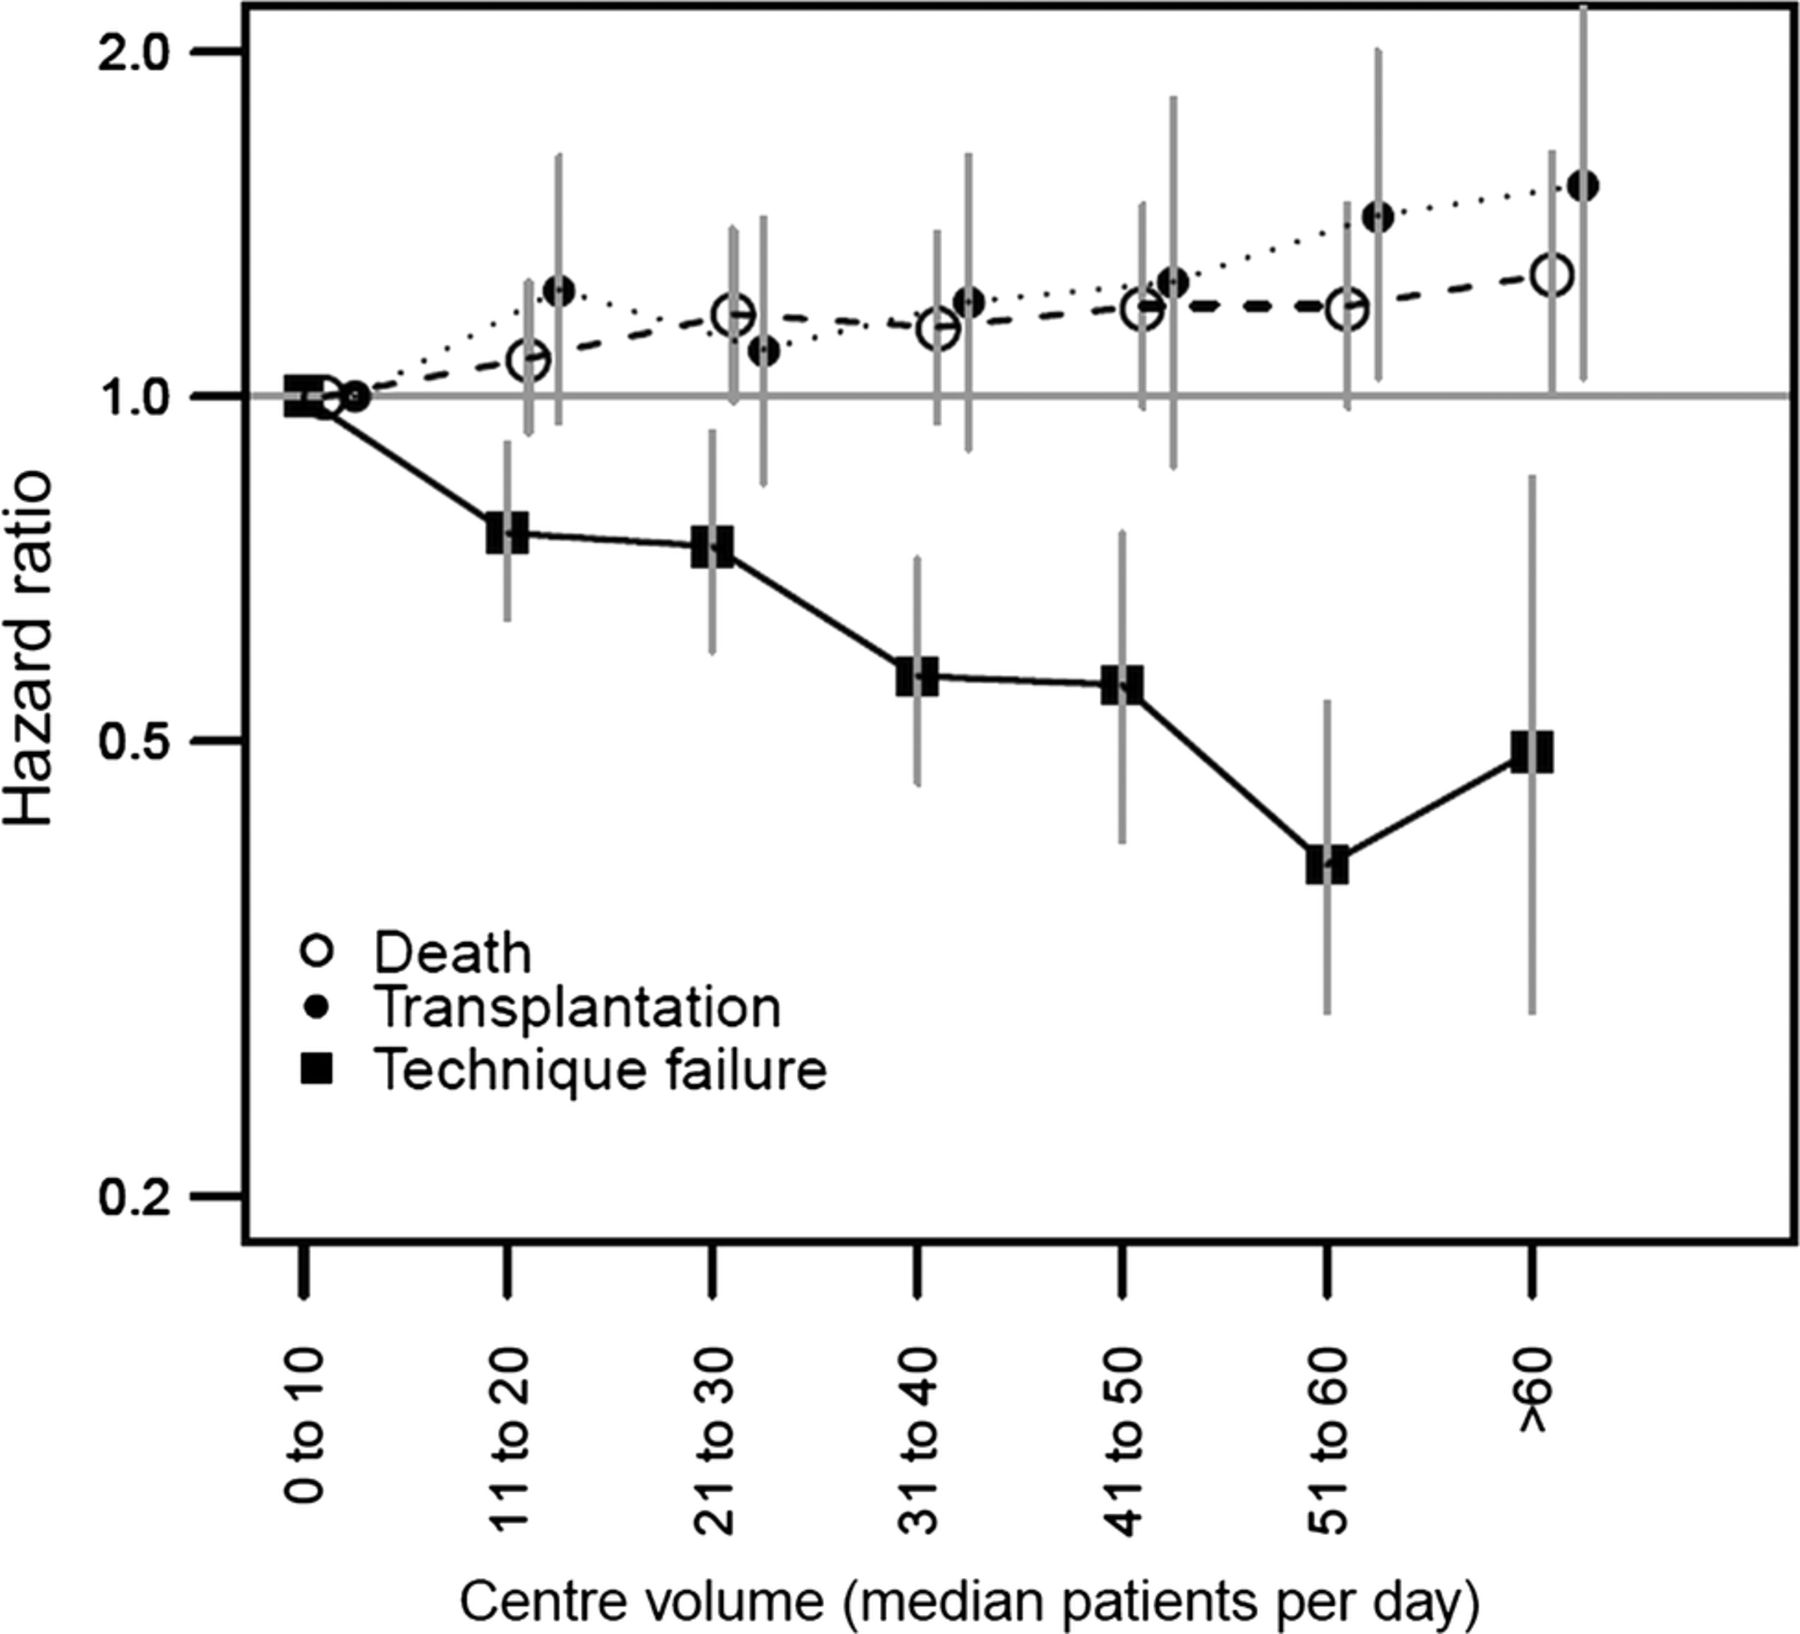
Subdistribution HRs for centre volume and technique failure transplantation and death within 5 years of initiating peritoneal dialysis.
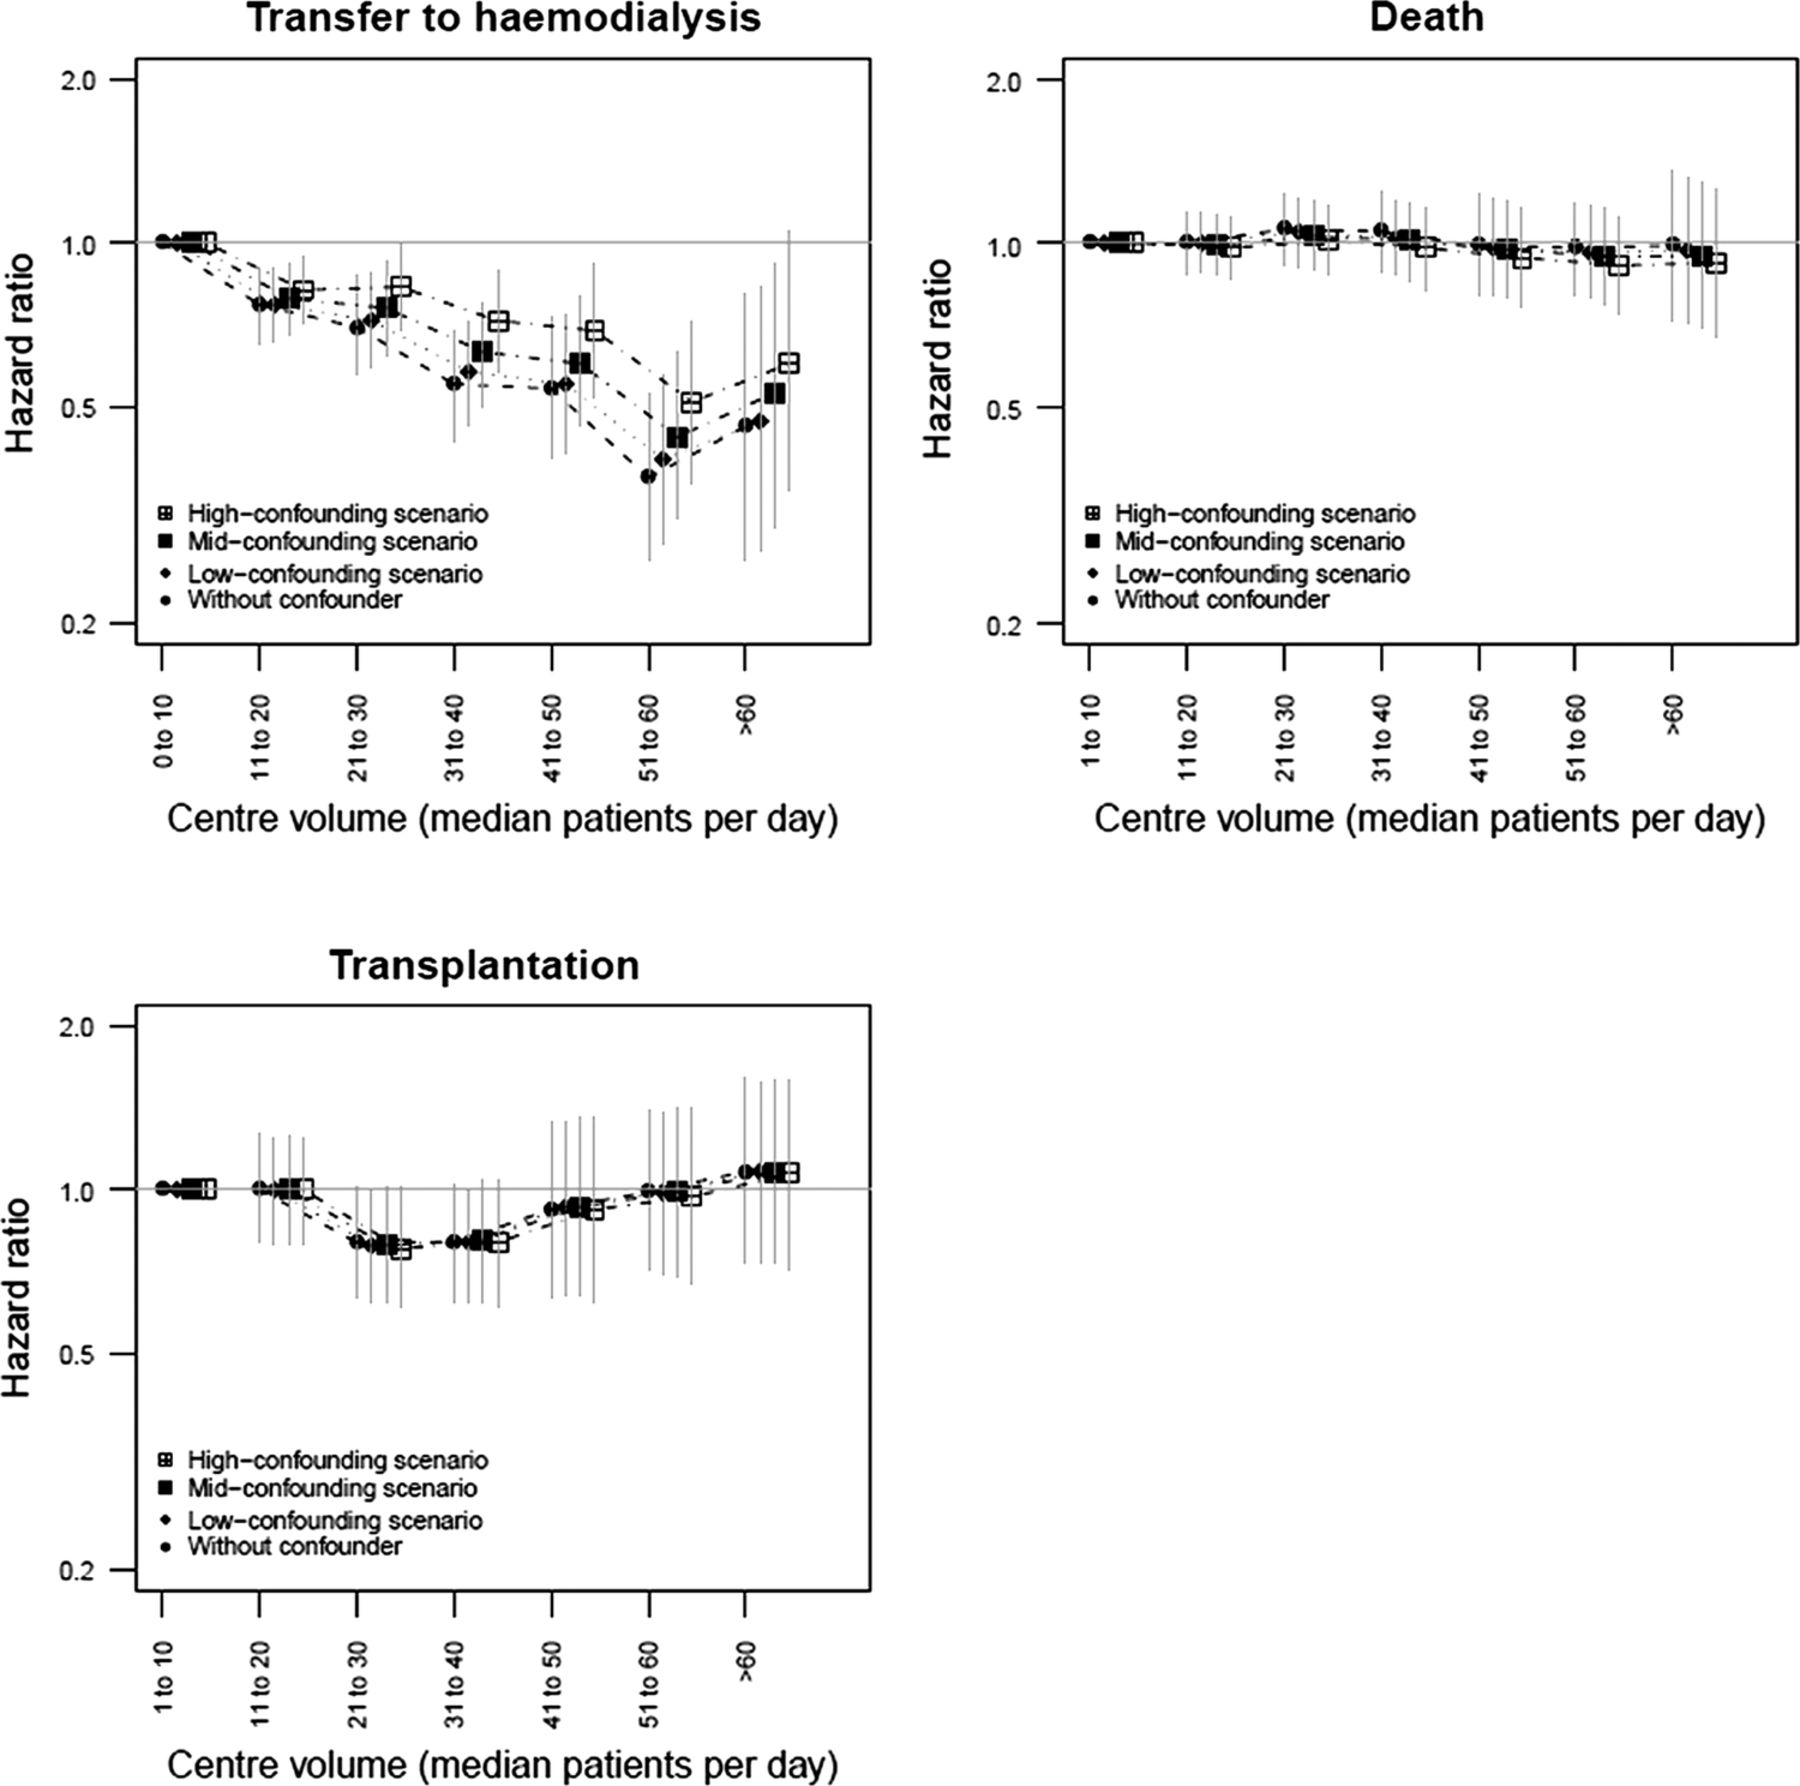
Sensitivity analysis for unmeasured confounding
As expected, adjusting on the imputed unmeasured confounder variable attenuated the cs-HRs for technique failure (figure 3), with an increasing shift towards 1.0 in moving from the low-confounding, to mid-confounding, to high-confounding scenarios. However, the cs-HR point estimates remained below 1.0 even in the high-confounding scenario. The cs-HR point estimates for death decreased slightly as the degree of unmeasured confounding increased. The cs-HRs for renal transplantation did not change (figure 3).

Cause-specific HRs for centre volume and technique failure transplantation and death within 5 years of initiating peritoneal dialysis under scenarios of low mid and high residual confounding of the association between volume and technique failure.
Predicted intervention effects
All the simulated interventions predicted a reduction in the cumulative incidence of technique failure, accompanied by a smaller increase in the cumulative incidence of death and transplantation (table 3). Intervention #1 yielded the largest reduction in cumulative incidence of technique failure; interventions #2, #3 and #4 all gave reductions of similar size. The 95% central prediction intervals were wider for intervention #4 than the other interventions. Almost 100% of the simulation runs for interventions #1, #2 and #3 predicted a reduced cumulative incidence of technique failure and increased cumulative incidences of death and transplantation (table 3). These proportions were smaller, but still greater than 90%, for intervention #4.
Predicted change in cumulative incidence of each outcome at 5 years after peritoneal-dialysis initiation under the intervention scenarios
Discussion
In this study, we found that patients initiating peritoneal dialysis in higher volume centres had a lower risk of technique failure than those in lower volume centres without any difference in the risk of transplantation or death, when risk was measured as the cause-specific hazard. These associations were robust to unmeasured confounding. When considering the probability of each outcome, there was a lower cumulative incidence of technique failure and an increased cumulative incidence of transplantation and death in higher volume centres. However, the reduction in the probability of technique failure under plausible interventions was modest.
Our results were consistent with previous studies when considering cs-HR as the measure of association. All five of these studies reported a lower risk of technique failure12–16 in higher volume centres; four found no difference in the risk of death,12–14 ,27 the fifth finding a reduced risk15 and the one study also examining the risk of transplantation found no risk difference.12 There are methodological differences and gaps in these studies, as discussed below; however, the coherent trend across countries (the USA,13 ,14 Canada,12 the Netherlands16 and now France) with different health systems is noteworthy. Further, the mechanisms linking centre volume and technique failure are plausible since technique failure occurs for many reasons, including patient or carer burnout and patients’ or perhaps clinical teams’ difficulties in handling technical difficulties, which larger volume centres with more experience and resources may be better able to address.
Our study extended this previous work in several ways. One of the difficulties in interpreting studies until now has been the variability in volume measurement used, including prevalent patients in a given month13 ,14 or on a given day,16 cumulative patients ever started by a given date15 and average prevalent patients per centre over the study period.12 Further, volume has frequently had different arbitrary cut-offs (eg, 20,16 2514 and 50 patients)13 and has sometimes been calculated at a time-point after patients had started peritoneal dialysis.13 ,14 To circumvent these issues, we chose a volume measure defined at the time of initiating peritoneal dialysis for each patient, based on the 12 months preceding the date of initiation, and modelled volume in categories of 10-patient size without setting a single size threshold.
This study also improved knowledge about the robustness of the volume-outcome effect to confounding. Some earlier studies were not able to adjust on a number of patient characteristics,14 ,16 leaving open the possibility of residual confounding at this level. We were able to address this by adjusting on a range of sociodemographic and clinical variables. However, there were few differences in patient characteristics across the volume groups and the unadjusted and adjusted measures were similar, suggesting that patient-level confounding (at least by measured variables) was small.
We considered residual confounding at the centre level to be the biggest threat to the validity of our findings and, indeed, to the findings of previous studies. This confounding would arise if clinicians tended to have pro-peritoneal-dialysis or pro-haemodialysis attitudes (consistent with our observations in clinical practice), in which pro-peritoneal-dialysis clinicians start more patients on peritoneal dialysis, are more determined to work through technical difficulties, and thus are less ready to transfer patients to haemodialysis. This would lead to a positive correlation between centre volume and technique survival. The very low cs-HRs with increasing volume for early technique failure found in this study are consistent with this hypothesis (see supplementary material); however, the sensitivity analysis showed that the association persisted even under a scenario of strong residual confounding, suggesting that there is a true, protective effect.
Finally, our analysis extended previous work by explicitly applying methods for competing-risk outcomes. Peritoneal-dialysis patients face several outcomes which compete with each other in the sense that observing one precludes observation of the others.18 ,19 ,36 ,37 In data with this structure, we can best understand an exposure effect by modelling both the cause-specific hazards and the subdistribution hazards of each outcome.30 The cause-specific hazard reflects the underlying association of the exposure with each outcome, whereas the subdistribution hazard reflects the association with the cumulative incidence of the outcome, that is, the probability of the occurrence of the outcome as observed. This can be thought of as the net effect on the outcome of interest of the change in the cause-specific hazards of all the competing outcomes associated with a change in the exposure.38
The results of this study neatly demonstrated the difference between these two measures when the competing outcomes are common. The Cox models showed that larger centre volumes reduced the cs-hazard for technique failure, but did not change the cs-hazards for death or transplantation. The Fine and Gray models showed that larger centre volumes also reduced the sd-hazard for technique failure but, in contrast, increased the sd-hazards for death and transplantation. This means that the cumulative incidence of patients dying and being transplanted was higher in larger centres, even though centre volume did not change the underlying (cause-specific) hazard of these outcomes. The explanation is that patients in higher volume centres were less likely to be transferred to haemodialysis and therefore spent more time on peritoneal dialysis, when they could be observed to be transplanted or to die on the treatment method. This is important since in real life we observe cumulative incidences, not cause-specific hazards, and therefore may acquire incorrect impressions about the causal effect of volume on mortality or transplantation.
The relevance of this (and other) volume outcome research ultimately lies in its ability to guide interventions to change centre volumes and thus improve patient outcomes. This view fits with recent initiatives to make epidemiological analyses more directly relevant to policy questions.20 ,21 Unsurprisingly, intervention #1 gave the greatest predicted reduction in the cumulative incidence of technique failure, but the assumption of shifting all patients to the two highest volume groups was very optimistic. The other three interventions gave similar predicted effects, despite different approaches and assumptions, but the effect size was modest. The main difference between these three interventions was that intervention #4 had a wider 95% central prediction interval, which appeared to be due to a low-volume trap in which patients in some of the very low volume centres could not escape into the higher categories.
Two points from the simulation results may be surprising. First, the reduction in the cumulative incidence of technique failure was small compared with the large reductions in the cs-HRs and sd-HRs (approximately 0.5), using the smallest volume group as the reference category. This was because the intervention did not move patients from the smallest volume group only; the benefit to patients moving from other volume groups was smaller. Second, the interventions predicted an increase in the cumulative incidence of death and transplantation. However, as noted above, this was simply the consequence of the reduced cumulative incidence of technique failure.
Another point to consider is that interventions to change centre volumes are likely to activate additional paths not reflected in this study's data set, which we did not address in the intervention simulations (see online supplementary material). For all intervention scenarios, we made the optimistic assumption that centres would be adequately resourced after an intervention to increase volume; under the ‘prioritise peritoneal dialysis’ scenario, we assumed that patients initiating peritoneal dialysis instead of haemodialysis were as clinically, psychologically and socially appropriate for peritoneal dialysis as the patients choosing this modality (ie, our data set); and under the ‘patient-diversion’ interventions, we did not model any impact of the increase in patients’ travel time to reach larger, but more distant, peritoneal-dialysis centres.39
These factors would probably mitigate the small but favourable predicted impact of interventions to increase centre volume on technique failure. We speculate that increased volumes in relatively under-resourced centres would negatively impact the quality of patient education and support; patients for whom peritoneal dialysis is less socially appropriate may cope less well with the modality, and patients having to travel further for care may experience more rapid burn-out and need transfer to haemodialysis. On this last point, there is some empirical evidence for differences in peritoneal-dialysis outcomes according to distance from care. One Australian study reported an increased risk of peritonitis and differences in peritonitis management among patients living far from their treating centres,40 and a Canadian study reported an increased risk of death but a lower risk of technique failure among patients living far from care.41 However, another Canadian study found no association between distance to care and outcomes.12 These data are from countries where distance to care can be considerable (>10040 and >300 km41), different from the French (and most European) settings, and we have doubts about whether the distance-outcomes association can be estimated from observational data in European settings (see arguments in online supplementary material). Overall, we therefore consider the predicted change in cumulative incidence of the outcomes in the intervention simulations to be an upper limit of the impact of a real-life implementation.
Several limitations of this study must be borne in mind. Approximately 15% of peritoneal-dialysis patients in France are not included in the RPDLF database and 13.2% of eligible patients were excluded from the study, both of which may have introduced bias and limited the generalisability if these patients or their treating centres differed from those included in the analysis. We had relatively few centres in the largest volume group, despite the large numbers of patients treated by these centres, and capped the volume effect at that of the >60-patient group to avoid extrapolating beyond the data. We also excluded patients cared for in the private sector, where the volume range was relatively small: a separate analysis comparing private and public centres may therefore be of interest. A notable proportion of patients had missing values for the Charlson comorbidity index and this proportion varied across different centre volume groups. This may have led to bias in the analyses which the multiple-imputation approach did not redress, as in the case of an incorrectly specified imputation model or data which were ‘missing not at random’. Additional limitations are that we did not model volume as a time-varying exposure to avoid endogeneity (whereby patients could contribute to their own volume exposure after initiating peritoneal dialysis); we constrained the HR to be constant over time (despite some evidence to the contrary),42 meaning that our HRs are nonetheless validly interpreted as averages over the follow-up period;30 and we assumed that peritoneal-dialysis patients have the same risk of death and transplantation after transfer to haemodialysis, which the literature supports43 but not unequivocally.44 Further work could relax these latter assumptions through alternative modelling approaches, such as patient-level simulation techniques able to combine results from multiple studies.45
Overall, our findings suggest that patients initiating peritoneal dialysis in high-volume centres have a reduced risk of technique failure without any change in the risk of death but that policies and interventions to increase patients’ exposure to high-volume centres in routine care may yield only modest improvements in technique failure.
Acknowledgments
The authors thank the centres participating in RDPLF.
References
Supplementary materials
Supplementary Data
This web only file has been produced by the BMJ Publishing Group from an electronic file supplied by the author(s) and has not been edited for content.
Files in this Data Supplement:
- Data supplement 1 - Online supplement
Footnotes
-
Contributors All authors contributed to developing the research question, defining the methods, interpreting the results and reviewing the manuscript. The authors’ particular focus areas were: analysis and writing (DE); critical review of epidemiological analysis (AF and TL) and simulation methods (AF); critical review of clinical elements and interpretation (CV and TL). CV and TL also contributed to data acquisition through their involvement in RDPLF. All authors approved the final manuscript for publication.
-
Funding This research received no specific grant from any funding agency in the public, commercial or not-for-profit sectors. The Registre de Dialyse Péritonéale de Langue Française receives untied financial support from various pharmaceutical and medical devices companies (for details, please see http://www.rdplf.org/financement.html).
-
Competing interests None.
-
Ethics approval RDPLF has received approval from France's Commission nationale de l'information et de l'informatique.
-
Provenance and peer review Not commissioned; externally peer reviewed.
-
Data sharing statement The R code used for the analysis is available from the authors on request.