Article Text

Abstract
Objectives The influence of neighbourhood deprivation on the risk of harmful alcohol consumption, measured by the separate categories of excess consumption and binge drinking, has not been studied. The study objective was to investigate the effect of neighbourhood deprivation with age, gender and socioeconomic status (SES) on (1) excess alcohol consumption and (2) binge drinking, in a representative population survey.
Design Cross-sectional study: multilevel analysis.
Setting Wales, UK, adult population ∼2.2 million.
Participants 58 282 respondents aged 18 years and over to four successive annual Welsh Health Surveys (2003/2004–2007), nested within 32 692 households, 1839 census lower super output areas and the 22 unitary authority areas in Wales.
Primary outcome measure Maximal daily alcohol consumption during the past week was categorised using the UK Department of Health definition of ‘none/never drinks’, ‘within guidelines’, ‘excess consumption but less than binge’ and ‘binge’. The data were analysed using continuation ratio ordinal multilevel models with multiple imputation for missing covariates.
Results Respondents in the most deprived neighbourhoods were more likely to binge drink than in the least deprived (adjusted estimates: 17.5% vs 10.6%; difference=6.9%, 95% CI 6.0 to 7.8), but were less likely to report excess consumption (17.6% vs 21.3%; difference=3.7%, 95% CI 2.6 to 4.8). The effect of deprivation varied significantly with age and gender, but not with SES. Younger men in deprived neighbourhoods were most likely to binge drink. Men aged 35–64 showed the steepest increase in binge drinking in deprived neighbourhoods, but men aged 18–24 showed a smaller increase with deprivation.
Conclusions This large-scale population study is the first to show that neighbourhood deprivation acts differentially on the risk of binge drinking between men and women at different age groups. Understanding the socioeconomic patterns of harmful alcohol consumption is important for public health policy development.
- EPIDEMIOLOGY
- PUBLIC HEALTH
- PREVENTIVE MEDICINE
This is an open-access article distributed under the terms of the Creative Commons Attribution Non-commercial License, which permits use, distribution, and reproduction in any medium, provided the original work is properly cited, the use is non commercial and is otherwise in compliance with the license. See: http://creativecommons.org/licenses/by-nc/3.0/ and http://creativecommons.org/licenses/by-nc/3.0/legalcode
Statistics from Altmetric.com
Article summary
Article focus
-
A recent systematic review found little evidence that living in neighbourhoods of high socioeconomic deprivation is associated with a higher risk of harmful alcohol consumption.
-
The important distinction between excess alcohol consumption and binge drinking has not previously been investigated.
Key messages
-
A higher risk of binge drinking was found in residents living in deprived neighbourhoods, particularly in young and middle-aged men.
-
A higher risk of excess consumption, but less than binge, was found in residents of less deprived neighbourhoods.
-
Neighbourhood socioeconomic deprivation is an important factor to consider in public health alcohol policy development.
Strengths and limitations of this study
-
The main strength is the large representative dataset of over 58 000 respondents, or around 1 in 50 of the socially diverse Welsh adult population. The ordinal alcohol consumption outcome measure was based on a widely used definition published by the UK Department of Health.
-
The cross-sectional analysis used the administratively defined census lower super output areas as a proxy for ‘neighbourhood’ and cannot investigate the possibility of causal relationships. Social desirability bias may result in under-reported alcohol consumption, although it is not known whether this varies between neighbourhoods.
Introduction
Excess alcohol consumption causes a major global burden of disease, injury and social and economic cost.1 Binge drinking, typically defined as consuming at least double the guideline limits in a single day during the previous week,2 is an increasing problem which is rising particularly in young women.3 It is associated with antisocial behaviour4 and around half of all violent crimes in the UK.5 Binge drinking causes an extra burden on health services; between 20% and 40% of people presenting to accident and emergency departments are intoxicated, increasing to 80% after midnight.4 Recent data show that around 37% of men and 29% of women exceeded the current UK guidelines for safe levels of alcohol consumption of ≤3 units/day for women and ≤4 units/day for men in the past week; and 20% of men and 13% of women engaged in binge drinking, defined as >6 units/day for women and >8 units/day for men.6 Given the wide range of harm resulting from this substantial level of consumption, the potential impact on health at the population level from a reduction in consumption is considerable.
Research investigating the socioeconomic patterning of harmful alcohol consumption has generally found that lower socioeconomic status (SES) groups drink more heavily and higher SES groups drink more frequently,7 consistent with binge drinking being found to be more prevalent in the economically disadvantaged.8 However, subtle variations in cut-points based on units have led to prevalence estimates for binge drinking in young men to differ by 22%,2 and these summary SES relationships have been found to vary substantially with age, gender, educational level, employment status and the measure of consumption.2 ,7–12
In addition to the socioeconomic effects found at the individual level, it is theorised that small-area, or neighbourhood, socioeconomic deprivation might exert an independent effect on harmful alcohol consumption. However, a recent systematic review which included multilevel studies of neighbourhood deprivation and alcohol consumption found little evidence to support this hypothesis.13 Of the four multilevel studies which were classified as rigorous in a quality assessment, one study set in the West of Scotland, UK, found no significant association between neighbourhood deprivation and drinking above guideline limits or the number of units consumed in the past week.14 A second study set in California, USA, found that the odds of heavy alcohol consumption (>7 drinks/week for women and >14 for men) was significantly higher for people living in the least deprived neighbourhoods with no significant variation with individual SES.15
The two other studies described an association between high neighbourhood deprivation and high consumption.16 ,17 Data from the nationally representative Third National Health and Nutrition Examination Survey (NHANES III, USA) found that a composite neighbourhood deprivation measure at the level of the census tract was associated with heavy alcohol use, defined as consuming five or more drinks almost every day (OR 1.18; 95% CI 1.01 to 1.38), but it was not reported whether this association varied with age, gender or SES.16 A second US study found that higher mean income and income inequality at the larger community district level was significantly associated with a higher number of drinks per month among drinkers.17 Four subsequent papers reporting small studies found no significant association between alcohol consumption and neighbourhood income,18 ,19 neighbourhood unemployment20 or a composite measure of relative socioeconomic disadvantage,21 while a further large-scale study of over 90 000 subjects set in Canada found a small effect of neighbourhood deprivation on the number of drinks consumed per week in men, but not in women.22
Possible explanations for these inconsistencies in neighbourhood associations found between studies may result from different methods of defining excess, or harmful, consumption, with some choosing definitions based on national guidelines for ‘safe’ consumption or units,14 number of drinks15–19 ,21 ,22 or frequency of consumption.19 ,20 Additional explanations for inconsistent neighbourhood associations may result from different measures of area deprivation, sizes of neighbourhood and adjustment for different individual-level risk factors for excess alcohol consumption.14–22
Despite the substantial public health consequences of alcohol consumption and the possible importance of neighbourhood in explaining the patterns of consumption, no previous study to our knowledge has investigated multilevel associations with neighbourhood deprivation which distinguish between excess consumption and binge drinking as distinct categories. Little is known on whether any associations vary within population groups. The aim of the present study was to investigate the effect of neighbourhood deprivation with age, gender and SES on (1) excess alcohol consumption above guideline limits and (2) binge drinking, in a representative sample of the adult population of Wales, UK.
Methods
Participants
Data were drawn from four successive cross-sectional waves of the Welsh Health Survey 2003/2004–2007, an interviewer-led household and individual survey of the adult population resident in Wales, UK.23–25 The adult population of Wales is approximately 2.2 million (2001 Census) and the dataset available included a total of 60 555 adults aged 18 years and over. The sampling methods and the survey process are described in detail elsewhere.24 ,25 Briefly, the sampling frame used was the Post Office's Postcode Address File. Private household addresses were randomly selected in a two-stage design, sampling addresses within primary sampling units that were selected within the 22 unitary authority local government areas in Wales. Each adult member of the household was invited to complete a questionnaire. Response rates were high; in 2003/2004, the adjusted household survey response was 74% with 85% of individuals responding within households,24 with little change at 74% and 82%, respectively, in 2007.25
Alcohol outcome measure
Participants were asked to state the highest number of units they had drunk on any 1 day in the previous 7 days, using a standard prompt to convert different types and quantities of alcoholic drinks into units. The dataset provided the classification of units into ordinal categories of maximal daily consumption based on the UK Department of Health definitions (table 1), with categories for ‘none/never drinks’, ‘within guidelines’, ‘excess consumption but less than binge’ and ‘binge’.26
Categorisation of the alcohol consumption outcome variable
Neighbourhood deprivation measure
The Welsh Index of Multiple Deprivation 2005 was used as the measure of neighbourhood deprivation.27 The Index includes seven weighted domains of deprivation: income (25%), employment (25%), education (15%), health (15%), geographical access to services (10%), housing (5%) and physical environment (5%). These neighbourhood deprivation scores are available for lower super output areas (LSOA), a unit of statistical geography defined by the 2001 UK Census.28 There are 1896 LSOAs in Wales which have a mean population size of around 1500. Since the data included in each neighbourhood deprivation domain are measured on different scales, each domain score is transformed to have a range of 0–100 and the overall index is calculated using a weighted average,27 taking a range of 1.4–78.9. This measure of neighbourhood deprivation is highly correlated with the well-established Townsend index,29 Spearman's r=0.86, n=1896, p<0.001.
We used the LSOA as the closest available proxy for neighbourhood. Neighbourhood characteristics vary widely within Wales, from high to low levels of socioeconomic disadvantage, including deprived urban inner-city areas, less deprived city suburban residential areas, postindustrial valley towns, market towns and rural, farming areas. Respondents were linked to their neighbourhood of residence by the data owners (the Welsh Government) and the dataset included individuals living in 1839 LSOAs, nested within the 22 unitary authorities (UA) in Wales. Each LSOA was assigned to one of five ordinal categories of neighbourhood deprivation with equal counts of LSOAs in each quintile.
Measures of individual SES and potential confounding variables
The principal measure of SES defined for the analysis was the National Statistics Socio-economic Classification variable for the head of household. This is a measure of occupational social class with the following categories: professional/managerial, intermediate, routine and manual occupations and never worked/long-term unemployed. Age was analysed in 10-year bands by gender. We considered other available measures of SES that were associated with alcohol consumption in the dataset as confounding variables: individual employment status (employed, seeking work, training/student, retired, permanently sick or disabled or at home), highest educational qualification (degree, intermediate or none), ethnicity (White, Black and minority ethnic) and housing tenure (owner occupier, social and private renting; table 2).
Excess alcohol consumption and binge drinking by socioeconomic status
Of the 60 555 respondents, 58 282 individuals living within 32 692 households completed the questions on alcohol consumption and 50 641 had complete covariate information recorded in the dataset.
Statistical analysis
Since the outcome measure is an ordered categorical variable, the data were analysed using a continuation ratio model,30 which allowed the estimation of the association between neighbourhood deprivation and the likelihood of moving up one category of alcohol consumption, y, (eg, from excess consumption but less than binge to binge drinking). This continuation ratio approach used a linear predictor, ηk, to explain the probability of continuing to a higher category, conditional on reaching a certain ordinal level. The linear predictor was modelled by covariates xk and fixed effects β:
This extends naturally to the multilevel framework, where we adopted the random effects model:
where the linear predictor now has two components: xkβ are the fixed effects and zkb described the multilevel structure in the data. Again, in principle, the influence of both fixed and random effects may vary according to the level k.
We estimated the regression coefficients β and the covariance matrix Var (b) and we derived p(y=k | b=0), the predicted probabilities of membership of ordinal category k for the median geographical context b=0 for each quintile of deprivation and category of SES.
To model the variation in the four-category ordinal alcohol consumption outcome using a continuation ratio model, we defined three additional binary explanatory variables, one for each transition between the alcohol outcome categories to indicate the level at which the transition was occurring. The sequential modelling strategy started with the ‘null’ four-level variance components model, with category-specific intercepts and random effects for households, LSOAs and UAs. The neighbourhood deprivation categorical variable was fitted to estimate the unadjusted neighbourhood deprivation fixed effects in model 1. To allow a better understanding of the effects of deprivation on alcohol consumption, we fitted interactions between the neighbourhood deprivation quintiles and each additional explanatory variable indicating the relevant binary transition. The predicted probabilities of excess consumption and binge drinking were derived from the sum of these main effects and relevant interaction coefficients.
Social class, age group, gender, the interaction between age group and gender and the potential confounders were then added to form model 2. The final model 3 was fitted with cross-level interactions in separate models for neighbourhood deprivation interacting with age group and gender and neighbourhood deprivation with social class. Multiple imputation of five datasets using chained equations in R software was used to account for missing covariates.31 ,32
The magnitude of the variation between LSOAs and between UAs was estimated using the SD of their random effects, since these are measured on the same scale as the fixed effects for observed covariates. The quartiles of a standard normal variable lie at ±0.67, and the differences between LSOA and between UA quartiles were computed by 1.34×SD to compare with the magnitude of the estimated fixed effects for social class.
Results
Descriptive analysis
Overall, 22 218 (38.1%) of the total 58 282 respondents reported their levels of alcohol consumption as ‘none or never drinks’, 16 059 (27.6%) reported ‘within guidelines’, 9664 (16.6%) reported ‘excess consumption but less than binge’ and 10 341 (17.7%) reported ‘binge’ drinking. Both excess consumption and particularly binge drinking were higher in men than women. Excess consumption was the highest in the 35-year to 64-year age groups and binge drinking was the highest in 18-year-olds to 34-year-olds, declining with increasing age (table 2). The ‘never worked and long-term unemployed’ group and respondents with no educational qualifications showed substantially lower levels of both excess consumption and binge drinking than the three higher social class groups and those with some educational achievement. For employment status, the economically active who were employed or seeking work had higher levels of excess and binge consumption than economically inactive respondents. The proportion of respondents drinking to excess decreased with increasing neighbourhood deprivation, but binge drinking showed the opposite pattern of increasing with higher deprivation (table 2).
Multilevel models
The model 1 parameter estimates for the neighbourhood deprivation fixed effects and the interaction effects are shown in table 3, together with the unadjusted model-predicted probabilities for the five neighbourhood deprivation quintiles. The probabilities of excess consumption and binge drinking were computed from the sum of the fixed and interaction estimates for each neighbourhood deprivation quintile. As we found in the descriptive analysis, the probability of excess consumption was higher in less deprived neighbourhoods with decreasing probability across the quintiles of deprivation. Binge drinking showed the opposite pattern of increasing probability with higher deprivation. The differences in magnitude between the model-predicted probabilities and the descriptive data shown in table 2 are explained by the addition of the random effects in model 1.
Model parameter estimates and predicted probabilities (%) for excess alcohol consumption and binge drinking for neighbourhood deprivation and SES
Table 3 then shows the estimates for the neighbourhood deprivation fixed and interaction effects from model 2, which included social class, age group, gender, the interaction between age group and gender and the other confounding variables. The sum of the estimates for the fixed and interaction effects for the neighbourhood deprivation quintiles were used as in model 1 to compute the probabilities of excess consumption and binge drinking. In this adjusted model, the difference between the deprivation quintiles for the probability of binge drinking increased with less effect on the excess consumption category. Respondents in the most deprived neighbourhoods were more likely to binge drink than in the least deprived (adjusted estimates: 17.5% vs 10.6%; difference in proportions=6.9%, 95% CI 6.0 to 7.8), but were less likely to report excess consumption (17.6% vs 21.3%; difference in proportions=3.7%, 95% CI 2.6 to 4.8).
Table 3 finally shows the predicted probabilities of consumption for the SES categories in the fully adjusted model 2. There was little variation in excess consumption with SES. The descriptive analysis finding of a higher probability of binge drinking in the three higher social class groups compared with the never worked/long-term unemployed category remained after adjustment.
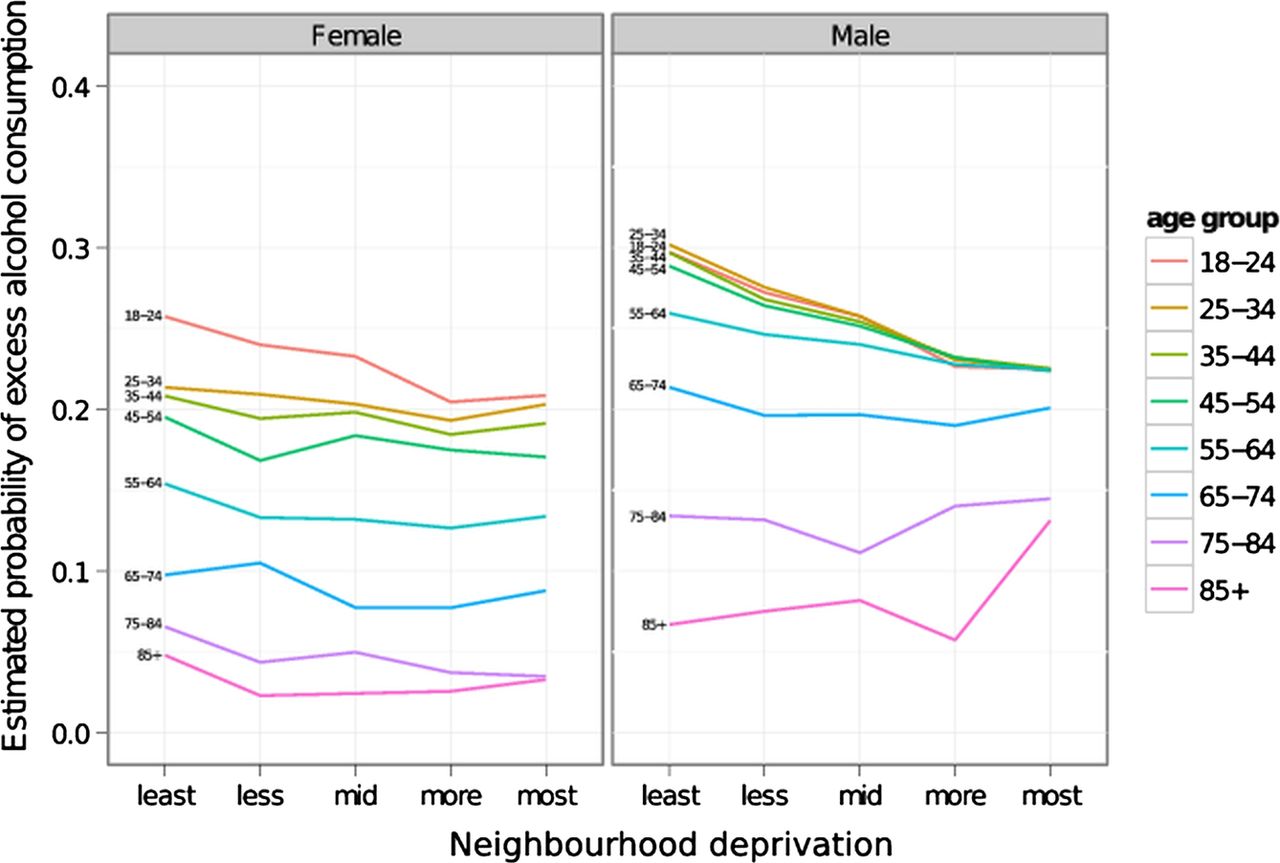
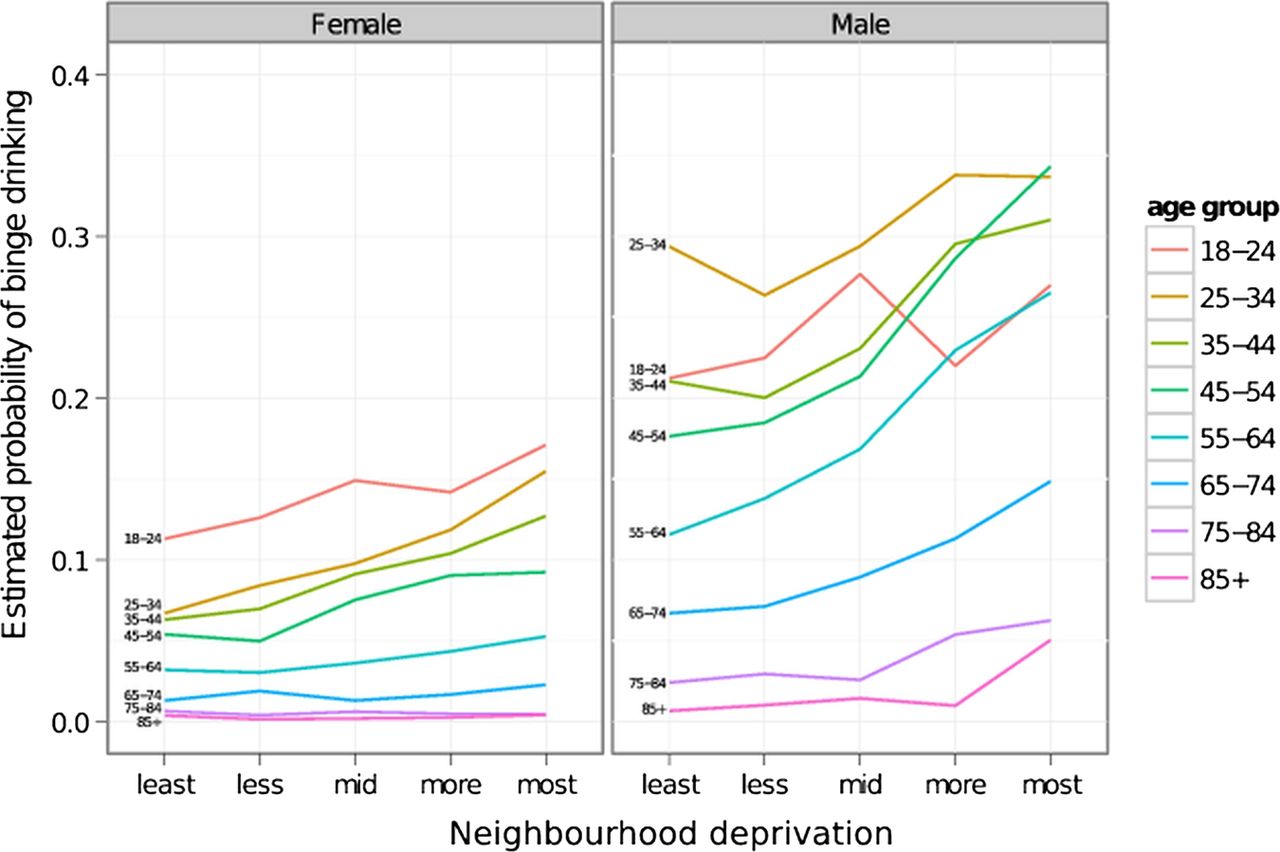
The two-way cross-level interaction between neighbourhood deprivation, age group and gender showed the effect of neighbourhood deprivation on the probability of excess consumption and binge drinking varied significantly between age group and gender. These model outputs are shown on the probability scale for ease of interpretation in figures 1 and 2. Little evidence of a cross-level interaction in women or older age groups was found for either excess consumption or binge drinking. Men had a higher probability of excess consumption in less deprived neighbourhoods than women. Although the probability of binge drinking in women increased with increasing deprivation quintile, the gradients were significantly steeper in men. The probability of binge drinking was the highest at all levels of neighbourhood deprivation in men aged 25–34. The interaction effects suggested that men in the 35-year to 64-year age groups showed the steepest increase in the probability of binge drinking associated with increasing neighbourhood deprivation, while the interaction effect in the 18-year to 24-year age group suggested a weaker association of increasing binge drinking with increasing deprivation. The cross-level interaction between neighbourhood deprivation and social class was not significant suggesting that the association of excess consumption and binge drinking with neighbourhood deprivation did not vary with SES.

Estimated probabilities of excess alcohol consumption by age group and gender within neighbourhood deprivation quintiles.

Estimated probabilities of binge drinking by age group and gender within neighbourhood deprivation quintiles.
Random effects variance
The values for the intraclass correlation coefficients (%) given in table 4 show that the majority of the unexplained random variation occurred at the household level, suggesting that, as expected, drinking behaviour tends to cluster more within households than within neighbourhoods or within the larger-area UA. To examine the magnitude of the variation between neighbourhoods in comparison to the fixed-effect estimates for SES, the SD for LSOAs in model 2=0.156, giving the IQR of the distribution of the LSOA variance=0.21. This compares to a parameter estimate of −0.33 for the ‘never worked’ category of social class, of −0.15 for ‘routine’ occupations and −0.10 for the ‘intermediate’ category, compared with the professional/managerial category (table 3). The size of this variation is of similar magnitude to the social class estimates, which suggests that there is important unexplained variation that can be attributed to LSOAs. Similarly, for UAs, the IQR=0.16, suggesting that the magnitude of the UA random variation, although smaller than LSOA, remains important in explaining the spatial pattern of alcohol consumption.
Random effects variance in sequential multilevel models
Discussion
Main results
The current study has investigated the difference in associations between neighbourhood deprivation and excess alcohol consumption and binge drinking as ordinal categories, based on the UK definition.26 This is because it has been suggested that it is more appropriate to set benchmarks for daily than for weekly consumption of alcohol following greater concern about the health and social risks associated with single episodes of intoxication.6 Excess consumption was more common in less deprived neighbourhoods. In contrast, binge drinking was more common in deprived neighbourhoods. These findings add to the previous US and Canadian studies which showed a significant neighbourhood effect16 ,17 ,22 by further assessing the complex interacting effects of neighbourhood deprivation with consumption category, age and gender and social class. The interaction effect of neighbourhood deprivation with age and gender showed the steepest increase in binge drinking with deprivation in middle-aged men with no significant interaction with social class. We also found a substantial variation between neighbourhoods, since the magnitude of the unexplained variance in alcohol consumption was similar to the effect sizes of individual SES.
Possible mechanisms linking neighbourhood deprivation to harmful alcohol consumption
Three mechanisms have been proposed to explain how neighbourhood deprivation might exert an independent effect on the risk of harmful alcohol consumption, and a differential effect on middle-aged men.16 First, the contagion hypothesis suggests that health behaviours are spread by social exchange and particularly social networks of personal friends.33 Thus, binge drinking may be more acceptable in middle-aged men resident in deprived neighbourhoods than in the non-deprived. Second, the stress of living in areas of high neighbourhood disadvantage may make men more vulnerable to psychological distress.34 ,35 This then increases the risk that alcohol is used as a coping mechanism.
Third, the structural hypothesis argues that neighbourhood social norms and institutions define the pattern of health behaviours.36 Greater availability of cheap alcohol measured as higher alcohol outlet densities might influence harmful drinking rates, although the evidence summarised in systematic reviews of both cross-sectional and longitudinal studies is inconsistent.37 There is some evidence that high deprivation neighbourhoods have a higher density of alcohol outlets,15 ,38 ,39 and this might provide a mechanism to explain higher consumption in deprived neighbourhoods. However, two studies which found higher outlet densities in more deprived areas found that levels of consumption were the highest in less deprived areas.15 ,38 A third study found the spatial association between outlet density and deprivation did not vary systematically, suggesting that the relationship between deprivation and outlet density may be different in different locations.39 This deprivation-density hypothesis could not explain the findings of higher rates of excess consumption in the least deprived neighbourhoods in the current study. One possibility is the acceptance of social norms of regular drinking to excess, but not episodic binge drinking, in less deprived areas compared with a different set of social normative binge drinking behaviour in the most deprived areas.
Strengths and limitations
Since 2003/2004, the Welsh Health Survey has been an annual source of robust population survey data. It has the important strength of a large sampling fraction resulting in a representative response dataset that includes around 1 in 50 of the socially diverse Welsh adult population, with detailed exposure data linked to the small-area neighbourhood. The study findings from such a comprehensive dataset should be widely generalisable. Several limitations should be considered. The alcohol consumption outcome measure was based on a widely used definition published by the UK Department of Health.26 However, the possibility of social desirability bias resulting in under-reported alcohol consumption should be considered,40 ,41 although it is not known whether under-reporting varies between neighbourhoods. The questionnaire responses were consistent year-on-year from four different successive samples, suggesting that responses were reliable. Non-response bias was a possibility, but the surveys had a consistently good overall response to the interviewer-led method.24 ,25
The administratively defined census LSOA was used as a proxy for ‘neighbourhood’. However, the direction of bias from using non-homogeneous administrative areas is towards conservative estimates.42 ,43 Therefore, it is unlikely that the current study overestimated the associations between alcohol consumption and neighbourhood deprivation. Finally, no inferences about causal processes can be made. Reverse cause, for example, could suggest that binge drinking causes a decline in social position, but this explanation seems unlikely for excess alcohol consumption in which the associations were in the opposite direction to binge drinking. A further limitation was that the dataset did not permit investigation of the possible mechanisms for our study findings.
In conclusion, the socioeconomic patterning of excess alcohol consumption and binge drinking was complex. The study findings have implications for enhancing public health alcohol policy development, emphasising the importance of neighbourhood deprivation, as measured primarily by levels of low income and unemployment, as a determinant of harmful levels of consumption. Further longitudinal research on the spatial relationships between alcohol consumption, outlet density and socioeconomic deprivation at individual and neighbourhood levels is necessary to further understand the underlying processes and provide further evidence for local and national policies to reduce alcohol-related harm.44
References
Footnotes
-
Contributors All authors contributed to the design of the study. DLF is principal investigator and wrote the first draft of the paper with JW. DMF carried out the statistical modelling, supported by FDD. JW carried out the literature reviews. All authors contributed to the critical revision of the manuscript and read and approved the final version.
-
Funding This work was supported by the Office of the Chief Social Research Officer (OCSRO), Welsh Government (grant number 081218 SAP). The work was undertaken at The Centre for the Development and Evaluation of Complex Interventions for Public Health Improvement, a UKCRC Public Health Research: Centre of Excellence. Funding from the British Heart Foundation, Cancer Research UK, Economic and Social Research Council (RES-590-28-0005), Medical Research Council, the Welsh Assembly Government and the Wellcome Trust (WT087640MA), under the auspices of the UK Clinical Research Collaboration, is gratefully acknowledged.
-
Competing interests None.
-
Provenance and peer review Not commissioned; externally peer reviewed.
-
Data sharing statement No additional data are available.