Article Text

Abstract
Objectives The possible occurrence of a highly pathogenic influenza strain is of concern to health authorities worldwide. It is known that during past influenza pandemics developing countries have experienced considerably higher death rates compared with developed countries. Furthermore, many developing countries lack appropriate pandemic preparedness plans. Mathematical modelling studies to guide the development of such plans are largely focused on predicting pandemic influenza spread in developed nations. However, intervention strategies shown by modelling studies to be highly effective for developed countries give limited guidance as to the impact which an influenza pandemic may have on low-income countries given different demographics and resource constraints. To address this, an individual-based model of a Papua New Guinean (PNG) community was created and used to simulate the spread of a novel influenza strain. The results were compared with those obtained from a comparable Australian model.
Design A modelling study.
Setting The towns of Madang in PNG (population ∼35 000) and Albany (population ∼30 000) in Australia.
Outcome measures Daily and cumulative illness attack rates in both models following introduction of a novel influenza strain into a naive population, for an unmitigated scenario and two social distancing intervention scenarios.
Results The unmitigated scenario indicated an approximately 50% higher attack rate in PNG compared with the Australian model. The two social distancing-based interventions strategies were 60–70% less effective in a PNG setting compared with an Australian setting.
Conclusions This study provides further evidence that an influenza pandemic occurring in a low-income country such as PNG may have a greater impact than one occurring in a developed country, and that PNG-feasible interventions may be substantially less effective. The larger average household size in PNG, the larger proportion of the population under 18 and greater community-wide contact all contribute to this feature.
- Epidemiology
this is an open-access article distributed under the terms of the creative commons attribution non-commercial license, which permits use, distribution, and reproduction in any medium, provided the original work is properly cited, the use is non commercial and is otherwise in compliance with the license. see: http://creativecommons.org/licenses/by-nc/2.0/ and http://creativecommons.org/licenses/by-nc/2.0/legalcode.
Statistics from Altmetric.com
Article summary
Article focus
-
This modelling study investigated the impact of an influenza pandemic on a community in Papua New Guinea (PNG) and compared it with that in a similar-sized community in Australia.
-
The effectiveness of social distancing interventions was determined using the PNG model and contrasted with the Australian model.
Key messages
-
A moderately transmissible pandemic occurring in PNG may be expected to result in a larger illness attack rate compared with that in a developed country setting.
-
Feasible social distancing intervention strategies may be significantly less effective in PNG compared with the Australian setting.
-
Compared with Australia, the larger household sizes contribute both to the larger attack rates in PNG and to the lower effectiveness of the interventions.
-
The larger proportion of children in PNG and the fact that 50% do not attend school lessen the effectiveness of school closure interventions.
Strength and limitations of this study
-
The findings are a first step in understanding how an influenza pandemic will impact on a low-income country.
-
As with all modelling studies obtaining high-quality field data with which to ‘populate’ models is crucial and accessing such data in countries such as PNG is a challenge.
-
These results and those from future research will permit better pandemic planning and allow intervention strategies to be tailored to the specific demographics and resource constraints found in developing countries.
Introduction
Novel influenza virus strains have resulted in pandemics costing millions of lives1 and the possible occurrence of a highly pathogenic virus strain is of concern to health authorities worldwide.
It has been shown under laboratory conditions that the highly pathogenic H5N1 avian influenza strain may reassort or mutate to become readily transmissible between humans.2 In response to the threat of influenza pandemics, most countries have developed pandemic preparedness plans.3–8 However, the level of completeness of these plans with regard to WHO guidelines9 varies dramatically between developed high-income countries and developing low-income countries.7 ,8
Low-income countries suffer the highest rates of morbidity and mortality from influenza pandemics. Data from the 1918/1919 pandemic suggest much higher death rates in India compared with Europe and the USA. While in northern Europe and the USA death rates were consistently below 1%, over 4.3% average mortality was reported from India, with some Indian provinces exceeding death rates of 7%.10 ,11 Even in the mild H1N1 pandemic of 2009, 59% of the estimated 284 500 deaths occurred in Africa and South-East Asia.2 These differences are most likely due to the significant association of influenza mortality with comorbidities usually absent in the developed countries (such as chronic malnutrition, malaria, tuberculosis, pneumonia and HIV).12 Furthermore it has been shown that the increased death rate due to an influenza pandemic is strongly associated with per capita income.11 It is apparent that the burden of the next pandemic will also be focused overwhelmingly on the developing world, a point made by the WHO and others.5 ,11 ,13–15
A substantial number of pandemic influenza models have been constructed in the past decade. A key goal of this effort is to determine the effectiveness of interventions, in terms of their ability to reduce infection and consequential death rates. Although it has been recognised that the major burden of mortality from influenza pandemics is suffered by low-income countries,5 ,11 ,16 the primary focus of the vast majority of these models is on examining intervention effectiveness in developed (eg, the USA and European countries17–20) and middle-income countries (eg, Thailand21 ,22). Given the markedly different demographic and community structure, as well as resource and infrastructural constraints in comparison with developed countries, these models have limited capability to predict the impact of an influenza pandemic on low-income countries.23 In addition, many low-income countries are located in tropical or subtropical regions where the timing and impact of influenza epidemics are more poorly understood than in temperate regions, where they are known to have a well-defined winter season.15
To address this ‘modelling gap’ an individual-based disease transmission model of pandemic influenza has been developed for Papua New Guinea (PNG), based on the methods used previously to develop a pandemic influenza model of Albany, Western Australia.20 ,24 ,25 The chosen location of Madang, a town of approximately 35 000 on the northern coast of the island of New Guinea has, along with all of PNG, different demographics and individual-to-individual contact patterns compared with those in developed countries. PNG has an annual per capita income of about US$2500—and is thus at a similar level of development as many African nations.26
The model was used to describe the spread of a novel influenza strain after introduction into the community. The resulting illness attack rate was determined together with data indicating where person-to-person transmission occurred. An unmitigated outbreak and two outbreaks with PNG-feasible intervention strategies activated were simulated and the results compared with those obtained using the Albany, Australia model.
Methods
Census and country-wide data from the PNG National Statistics Office27 together with data collected in a field survey in Madang were used to construct the Madang model. Following the methodology used to construct the Albany model, each household is explicitly represented, with occupants in one of seven age categories. Schools, workplace and other mixing hubs were also explicitly represented. Individuals were allocated to these mixing hubs according to their age category, so connecting households and hubs as shown in figure 1. Using virus intrinsic transmission characteristics calibrated with the Australian model, simulations were performed using the Madang model. These simulations captured the day-to-day susceptible, exposed, infectious and recovered/immune infection profile of the population following introduction of a novel strain of influenza into the modelled community, assuming no existing immunity.28

Schematic diagram of the Madang model.
Madang demographics
Madang model development used the most recent census data from 2001, other PNG government data and additional data collected in our field survey.29Census data provided the location groups of approximately 50 adjacent households, known as the census unit (CU). The specific demographics of each household in Madang in terms of number of individuals, their ages and occupation of adults was also provided by the census and each individual is uniquely identified in the model.
From July to September 2011 we also conducted a survey in Madang to obtain data on the number of people working in smaller workplaces, school class sizes, market sizes and the number of people attending the major tertiary education centres in Madang (Divine Word University (DWU), Madang Teachers College, Madang Technical College and Madang Maritime College). We asked the headmasters of schools and colleges, the human resource department at DWU and business owners of small-to-medium scale businesses about the respective numbers and, if no records existed relied on their estimates. We also obtained estimates on the size of informal settlements within the town boundaries from the Madang provincial government. The data obtained in the survey are presented in online supplementary table A1.
These data allowed for the construction of an explicit contact network linking households, schools, workplaces and other meeting places by allocating individuals to workplaces and schools, as with the Albany model.10
Contact network
The model captures explicit person-to-person contact with the contact network describing population mobility occurring between households, schools, workplaces and the wider community as shown in figure 1. The virus spreads through the community due to this mobility, as transmission occurs between individuals when they are co-located, possibly following a move from one location to another.
The number of contacts made by each individual each day in school, work and community settings were adjusted to reproduce the proportion of cases occurring in different settings as reported by empirical studies, specifically 40% of infections occurred in households, 30% in schools and workplaces and 30% in the wider community.30–32 Contacts within schools and workplaces occurred in fixed-size mixing groups of maximum size 10. Within mixing groups contact was assumed to be homogeneous. Community contacts occurred between randomly selected individuals, weighted towards pairs of individuals located in neighbouring households.
Each household contains uniquely identified individuals. Children and adults are assigned by an allocation algorithm to school classes and workplaces according to age based on class sizes and employee numbers obtained in the field survey. The field survey described above revealed that 50% of school-age children do not attend school, and this percentage is thought to be similar to most urban areas in PNG, with still lower rates in rural areas. Of those children not attending school 50% are allocated to neighbourhood hubs, as described below. In addition to contact occurring in households and mixing hubs, community contact is introduced to capture mixing which occurs out with these locales and in the wider community. The community contact occurs at a fixed rate, similarly to the Albany model.
Madang-specific contact locations
Census data provided the occupation/activity of individuals, namely ‘wage-job’, ‘garden’, ‘business’ and ‘unemployed’. This was used to locate individuals denoted as wage-job with known workplaces. The numbers in this census category exceeded those found in the survey of major workplaces and knowledge of Madang suggested the creation of small, local workplaces to locate these additional adults and those in the business category. Adults with gardening as their occupation work in family-owned gardens, subsistence farming and generating produce for sale. For each household containing a garden worker, a garden workplace was created whose members matched those of the household.
Three significant populations in Madang were not counted in the 2001 census, namely, those in settlements (unofficial housing areas also found in other parts of the developing world), those in the University and Chinese workers at a mine/processing site on the edge of the town. The field survey provided numbers resident in each of these locations: the two settlement areas in Madang with ∼750 inhabitants each; ∼3000 students and staff living in hostels at the DWU (a further ∼280 live in households in town and appeared in the census) and ∼650 overseas workers accommodated in hostels at the mine/processing site.
To model the settlements new households were created and individuals allocated to mixing hubs to match overall Madang demographics. The populations at the University and the mine-site had virtual households created to replicate friendship groups of average size 7, and these locations were also designated as the workplace for these individuals. Contact between the wider Madang population and those at the University involved household and neighbourhood contacts for local students and staff living in town while resident staff and students were restricted to community contact. Contact between the mine-site and the town was also restricted to community contact.
Census data classified a significant proportion (16.2%) of adults as unemployed and not attending a designated workplace.27 Knowledge gathered from the field survey in Madang indicated that these adults do have daytime contact with others outwith the home, such as working or visiting the two informal markets. To address this feature an additional daytime contact location (neighbourhood hubs) was introduced, with unemployed adults in each CU allocated to neighbourhood hubs of 10 individuals. In addition, these hubs also have 25% of all local school age pupils allocated to them, accounting for half of the 50% of school age children which do not attend school.
The introduction of neighbourhood hubs, which do not exist in the Albany model, give a model which the field survey and local knowledge indicate is representative of the contact patterns found in urban PNG. A Madang model which omits neighbourhood hubs, called Madang-nnh (no neighbourhood hubs), is also used in the simulation experiments and the resulting attack rates are presented in table 1. This allows influenza spread dynamics within the three models to be compared and indicates the sensitivity of the Madang model to the presence of the neighbourhood hubs.
Simulation outcomes of no intervention, school closure and rigorous social distancing (School Closure+WR+CCR) scenarios
The number of individuals in each of the daytime locations for the Albany, Madang and Madang-nnh models are presented in online supplementary table A1. Additional information on the data used to construct the Madang model is given in.33
Influenza transmission
Each individual has their influenza infection history modelled using an SEIR approach and are in one of four infection states, namely susceptible, exposed, infectious or recovered and thus immune.28 The passage of infection in each individual reflects the known time-changing infectiousness profile (ie, virus shedding34) of influenza at two discrete points-of-time every 24 h, during a day-time and a night-time period.
Disease transmission is realised using a probabilistic transmission function, implemented by the simulation algorithm. Together with mobility data, the transmission function captures disease spread throughout the modelled community and may be adjusted to reflect pandemics with various transmission characteristics, corresponding to the basic reproduction number R0 of a particular influenza strain, as discussed further in.20 ,24 ,25
It is assumed that infection transmission may occur when an infectious and a susceptible individual come into contact, in a stochastic fashion. Once infected, an individual progresses through a series of infectious states according to a fixed timeline, taking them from susceptible, to exposed state, to infectious and then to an immune, recovered state.28
The probability that an infectious individual infects a susceptible was calculated using the following function.
The factors which determine probability of transmission from an infectious individual (Ii) to a susceptible individual (Is) are the basic virus transmissibility (βv), the age-based susceptibility of Is the current level of infectiousness of Ii, and, if the contact between Ii and Is occurs in a household, the household size Household(Ii, Is). Details of the household size factor are given below; further details of the influenza transmission model can be found in ref. 35.
To achieve simulations for a particular basic reproduction number R0, βv was adjusted; details of the procedure for estimating βv and R0 are given in ref. 20. A pandemic with a basic reproduction number of 1.5 is used in this study, and corresponds to some estimations of the 2009 H1N1 pandemic36–39 and the 1957 and 1968 pandemics.40 ,41 Since it is virus intrinsic, we assumed that βv was similar in Madang and thus calculated R0 in the Madang and Madang-nnh models using the βv corresponding to an R0 of 1.5 in the Albany model. Details of parameter settings used in each model are given in online supplementary table A2.
Simulation
A simulation algorithm, realised in the C++ programming language, manipulates the underlying demographic model and captures both population mobility and the time-changing infectivity profile of each individual. Each individual has their infectivity status denoted by one of the four (S, E, I, R) states at any time point during the duration of the simulated period. The simulation algorithm captures the state of the whole population twice per day, a daytime point-in-time snapshot and an evening snapshot, with individuals (possibly) moving locations between successive day or night periods, such as household to school or workplace for the day phase, returning home for the night period. Individuals come into contact with other individuals on a one-to-one basis in each location, with possible influenza transmission then occurring.
Individuals in each household and contact hub make contacts within a close-contact mixing group, taken to be the entire household or a subset of larger hubs, and also make additional non hub-based random community contacts. The individual-to-individual transmission probability in larger households was moderated by household size using data from a study by Cauchemez et al42 The reduction of the probability of within-household transmission with household size is also shown in online supplementary figure A1. This reflects the assumed reduction in pairwise contact in households with greater than three members and is significant in the Madang context, where the average household size is 6.32 compared with 2.54 in Albany.
Using the contact, mobility and transmission features described above, stochastic simulations of influenza spread in Madang were conducted. All simulations were repeated 40 times with random numbers controlling the outcome of stochastic events (the locality of seeded infected individuals and the probability of transmission) and the results were averaged. Analysis of this simulation model has shown that the 40-run mean attack rate is highly unlikely (95% CI) to differ by more than 1.2% from the mean attack rate of a much larger set of experiment repeats.20 Where 95% CIs are reported in the results, these were calculated from the mean and SD of 40 randomly seeded simulation runs, using the normal approximation method.
One new infection per day was introduced into the population during the whole period of the simulations, and randomly allocated to a household.
This seeding assumption of one case per day was chosen to reliably begin a local epidemic in every stochastic simulation. For the transmission characteristics described above, analysis shows that seeding at this rate for 7 days results in a sustained epidemic in >97% of the simulation runs and 100% with 2 weeks of seeding, with higher percentages for the higher transmissibility scenarios. Seeding at this rate is continued throughout the simulation to capture the case where an epidemic may be initially suppressed by a rigorous intervention strategy, but may subsequently break out if intervention measures are relaxed.
After the beginning of a sustained local epidemic, any subsequent variation in the amount of seeding has very little effect on the progress of the local epidemic, as the number of imported cases is much smaller than those generated by the local epidemic. Preliminary analyses using the present model have shown that even if the seeding rate is increased to five infections per day, after 7 days the number of infections generated from the self-sustained local epidemic is twice the number of imported infections, and by 14 days local infections outnumber imported infections by a factor of 8.
The simulation period was divided into 12 h day/night periods and during each period a nominal location for each individual was determined. This took into consideration the cycle type (day/night, weekday/weekend), infection state of each individual and whether child supervision was needed to look after a child at home. Individuals occupying the same location during the same time period were assumed to come into potential infective contact. Details of the simulation procedure are presented in ref. 20.
Interventions
The effectiveness of social distancing interventions, such as school or workplace closure, may be quantified by comparing the passage of the influenza virus in the community with and without interventions activated, and presented as the reduction in the daily and cumulative illness attack rates. Pharmaceutical-based interventions were not considered as antiviral agents may only be available in limited quantities in a PNG setting, while a vaccination campaign would face significant delay, supply and delivery constraints. Two intervention strategies considered feasible in a PNG setting were examined. These were: school closure involving all schools, with home isolation of all affected children; and a more rigorous strategy involving school closure coupled with 50% reductions in community-wide contact, workplace participation and contact in neighbourhood hubs.
Both Madang models, (with and without neighbourhood hubs), were used to compare a pandemic in PNG with one occurring in Albany, Australia. Simulations were conducted involving: no interventions; only school closure applied; and rigorous social distancing, for each of the three models.
Results
Synopsis
General comparative trends are presented in table 1, were the Albany and Madang models are compared. For a pandemic in a developed country setting having a basic reproduction number R0 of 1.5 and an illness attack rate of 31.7%, the same pandemic characteristics applied in a PNG setting with no interventions activated resulted in higher rates of influenza transmission, with an attack rate of 46.6% and reproduction number R0=1.88 (table 1). Comparing the attack rates when interventions were activated, both intervention strategies (solely school closure and rigorous social distancing) were much less effective in the PNG setting compared with the Australian one. The mitigated illness attack rates in the PNG model were approximately three times higher than those in the Australian model with the interventions being 60–70% less effective. Table 2 indicates where transmission that resulted in illness occurred, showing a significantly higher number and proportion of transmissions occurring in households, as opposed to other contact/transmission locations, in the Madang compared with the Australian model (table 1). The average household size in the PNG model is 2.5 times larger than that in Albany and this had a significant impact on the overall infection rate, making it noticeably higher in the PNG model.
Number of symptomatic influenza cases at different locations
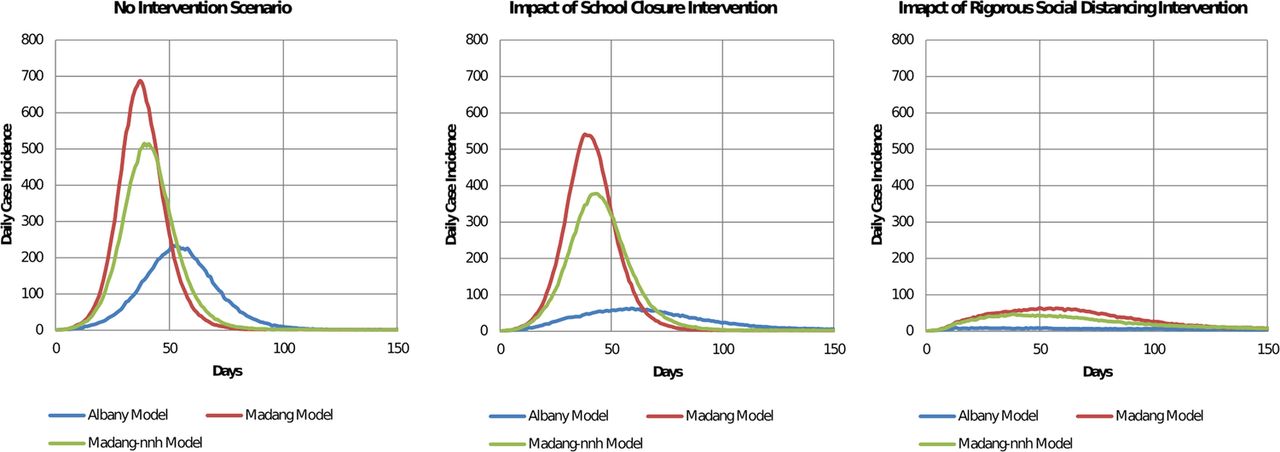
We also conducted experiments with the Madang-nnh model, where neighbourhood contact hubs were omitted, to contrast the transmission characteristics with and without these contact hubs. The results of these simulation experiments are included in tables 1 and 2. It should be noted that the Madang model with neighbourhood hubs included is believed to be more representative of population mixing characteristics in PNG, following local knowledge. Neighbourhood hubs were introduced to reflect the known mixing patterns occurring with adults not working in designated workplaces, such as those found in the regular contact which may occur among individuals in marketplaces. The addition of such contact hubs increased individual-to-individual contacts and hence infection transmission opportunities (see table 2) with approximately 2000 additional symptomatic infections resulting, for all three (mitigated and non-mitigated) scenarios. In terms of cumulative illness attack rate, the Madang model gave a basic reproduction number R0 of 1.88 and an illness attack rate of 46.6%, compared with that of the Madang-nnh (no neighbourhood hub) model with R0=1.74 and an illness attack rate of 40.8%. The daily case incidence resulting from simulating the Albany, Madang and Madang-nnh models is presented in figure 2 for the three scenarios.

Daily case incidence for different intervention scenarios. Daily case incidence for the no intervention, school closure and rigorous social distancing (school closure and workplace and community contact reductions) scenarios is shown. The blue, red and green curves represent the Albany, Madang and Madang-nnh models, respectively.
No intervention scenario
The results given in table 1 show that there is an approximately 47% increase in the illness attack rate in the Madang setting compared with that resulting from the Albany model; from 31.7% to 46.6%. If no neighbourhood hub contact occurs, as with the Madang-nnh model, there is still an increase in illness attack rate compared with that resulting from the Albany model, with an approximately 29% increase in the attack rate; from 31.7% to 40.8%.
It is apparent from the results presented in table 1 that there is a greater proportion of influenza cases occurring within households in both Madang models compared with that of the Albany model. This arises from the average Madang household size being larger than that in Albany. The number of cases occurring in Madang due to household transmission is ∼8000 compared with ∼3500 in Albany; note that Madang has a total population of ∼35 000 compared with ∼30 000 in Albany.
School closure scenario
The school closure intervention in the Madang model is found to be approximately five times less effective compared with that of the Albany model. Simulation results suggest a 9.4% reduction (46.6% to 42.2%) in the illness attack rate can be achieved in Madang due to school closure whereas a 48.6% reduction (31.7–16.3%) can be achieved in Albany (see table 1). For the Madang-nnh (no neighbourhood hub) model, school closure is approximately 3.5 times less effective compared with the Albany model.
Table 2 (middle panel) indicates an illness attack rate of ∼15 000 in Madang compared with ∼4800 in Albany. Much higher case numbers occur in households, workplaces and the wider community (including neighbourhood hubs) than in Albany, highlighting the poorer efficacy of this intervention strategy in a PNG setting. The Madang-nnh model also results in higher household and workplace transmission than the Albany model. Note that while there is a significantly higher proportion of under 17-year-old children in Madang (40%) compared with Albany (28%), our field survey indicates that 50% of school age children in Madang do not attend school, hence school closure is less effective in disrupting the transmission chain (ie, household 1-to-school-to-household 2) compared with Australia. This feature is also present in the rigorous social distancing intervention.
Rigorous social distancing scenario
Previous simulation studies 20 ,43 ,44 show that rigorous social distancing interventions involving school closure coupled to contact reductions in other locations may be highly effective in reducing the attack rate within a developed country setting. Comparing the effectiveness of rigorous social distancing between the Albany and Madang models, an ∼83% reduction (from 31.7% to 5.4%) reduction may be achieved in Albany whereas a smaller ∼62.7% reduction (from 46.6% to 17.4%), is achieved in the Madang model; see table 1. In the Madang-nnh model a ∼69.4% reduction in the attack rate (40.8–12.5%) can be achieved by this rigorous social distancing intervention.
Table 2 (bottom panel) indicates an illness attack rate of ∼6000 in Madang (and ∼4400 for Madang-nnh) compared with ∼1600 for the Albany model. Much higher case numbers occur due to household transmission, ∼4200 in Madang versus ∼670 in Albany (and ∼3000 in Madang-nnh). Workplace and community-wide transmission are also higher in the two Madang models compared with Albany.
These results suggest that both social distancing strategies are much less effective in a PNG setting compared with what might be achieved in a developed country. Figure 2 also reveals this clear trend, with peak case incidence and the area under the curves (the attack rate) being higher in both Madang models compared with the Albany model.
Sensitivity analysis
The sensitivity of key model parameters, such as school contact group size, illness withdrawal rates and intervention duration have been extensively examined for the Albany model.44 ,45 These indicate that while the model is sensitive to some parameter settings, the relative effectiveness of social distancing interventions remains unchanged, a feature also shared by the Madang models.
The major difference between the Albany and Madang models is the presence of neighbourhood hubs. We have included a Madang model which has no neighbourhood hubs (Madang-nnh) and present comparative results for all three models in tables 1 and 2, figure 2 and online supplementary tables A3–A6. Simulations comparing neighbourhood mixing group sizes 10 (baseline), 20 and 30 indicate that for hubs of size 20 and 30, the increased transmission results in higher attack rates, as expected (see online supplementary table A3).
The effect of varying compliance with home isolation of school children following school closure on attack rate was examined. Compliance was reduced from 100% to 50%. Reduced compliance increased the attack rate in Albany as those children affected made additional daytime contacts with other children. In Madang, the reduction in compliance had only minimal effect since approximately 50% of school age children do not attend school and continue to make daytime contacts in neighbourhood hubs (see online supplementary table A4).
The effect of using different probabilities of voluntary withdrawal to the home of symptomatic adults and children is presented in online supplementary table A5. Lower rates of voluntary withdrawal lead to higher attack rates in all three models. Voluntary withdrawal from work or school has a more pronounced effect in the Albany model, as a significant proportion of children in Madang still transmit through daytime contacts in neighbourhood hubs.
The effects of variation of the timing of intervention initiation are presented in online supplementary table A6. In the school closure scenario, delayed response had the most severe impact on the attack rates in Albany, whereas for the Madang models the changes in attack rate were marginal. This is again due to a large fraction of children not attending school and the existence of neighbourhood hubs. Similarly, in the rigorous contact reduction scenario the effect of delayed response on attack rate was more pronounced in the Albany model, due to lower effectiveness of interventions in a PNG setting.
Discussion
Introduction of a pandemic influenza strain with identical transmissibility characteristics results in a significantly higher infection and illness rate in a PNG setting when compared with that of a developed country. Social distancing intervention strategies suitable for a developing country may be significantly less effective in reducing the attack rate when compared with the outcomes expected in an Australian setting. Substantially more infections occurred in PNG households compared with that of the Australian model. The significantly larger size of households, a feature shared by many developing countries, together with higher community-wide contact in PNG, contributed to the higher infection rates. Interventions are less effective in a PNG setting since they are not targeted at household transmission, and given the larger household sizes, are applicable to a smaller proportion of transmissions compared with the Australian scenario. In addition, as only half the school-age children in Madang attend school, the two school closure based interventions impact fewer individuals.
While care was taken to obtain detailed data used to populate the Madang and Albany models, government data was found to be more limited in PNG. While a field survey was conducted in Madang to fill in missing data and make the models as directly comparable as possible, there is still scope for conducting further data collection. As with all modelling studies, the accuracy of results is limited by the quality of data used to construct the model. In the case of influenza epidemic modelling, outcomes are dependent on assumptions about the number, duration and physical closeness of contacts between people and how these attributes of contact affect transmission probability. These data are very difficult to estimate, with the best data source available being.46 In the absence of high-quality reliable data, we have made plausible assumptions regarding interpersonal contact, and, in the Albany case, these are reflective of the data in.46
The lack of similar low-income modelling studies prevents comparison with related studies, and suggests that this is an area requiring further attention. Research studies expanding on that reported here suggest themselves: the construction and use of a number of additional PNG models capturing different population structures, such as rural villages and island communities; and the determination of health outcomes following a moderately severe influenza pandemic, taking into account comorbidities with extant diseases such as malaria and tuberculosis, diseases common to many low-income countries.
The interventions used in the present study are based on social distancing. Surveys have shown that a higher proportion of low-income countries have social distancing interventions planned in the case of a pandemic, compared with high-income European countries due to their feasibility and cost-effectiveness.3 ,4 ,6 ,8 ,47 ,48 Pharmaceutical-based interventions were not considered in this study due to cost and delivery issues found with low-income countries.4 ,8
Consideration may need to be given to some form of antiviral agent use, possibly for case treatment, given the poor performance of purely social distancing interventions in developing countries as suggested by this study. The advantage of antiviral use is that it may be targeted at reducing within-household transmission, a location of transmission otherwise not impacted by social distancing interventions. The present study shows that larger numbers of transmissions occur within households due to the larger household sizes in countries such as PNG. Furthermore, low-income countries generally have population health profiles not seen in developed countries, including the prevalence of diseases such as malaria, tuberculosis and HIV.49 Antiviral treatment of influenza cases coinfected with such diseases may be an appropriate intervention strategy given the poorer health outcomes which comorbidity may impose.12 The provision and use of antiviral agents will have challenges not faced by industrialised countries, due to the cost of providing an antiviral stockpile and subsequent distribution of antivirals in countries which have health systems already stretched to capacity.15
The importance of suitable pandemic influenza preparedness plans for low-income countries is recognised by the WHO.50 ,51 Disease transmission models will play a role in guiding policy makers in determining the effectiveness of possible pandemic countermeasures. History tells us that low-income countries are likely to be more affected, yet almost all models deal with mitigation strategies for developed nations with good health infrastructure and low prevalence of endemic diseases. These countries have poorer access to antiviral drug and vaccine-based interventions and higher extant disease burdens, compared with developed countries. For the reasons, development of appropriate intervention strategies focused on countries such as PNG needs to occur.
References
Supplementary materials
Supplementary Data
This web only file has been produced by the BMJ Publishing Group from an electronic file supplied by the author(s) and has not been edited for content.
Files in this Data Supplement:
- Data supplement 1 - Online supplement
Footnotes
-
Contributions GJM conceived the study. GJM, PB, SK and JK designed the model. PB and NH conducted the experiments. SK supervised data collection. All authors analysed the results and contributed to drafts of the manuscript.
-
Funding Australian National Health and Medical Research Council (grant number 1004415).
-
Competing interests None.
-
Provenance and peer review Not commissioned; externally peer reviewed.
-
Data sharing statement Demographic dataset available to researchers from the corresponding author at milne@csse.uwa.edu.au.