Article Text

Abstract
Objective To assess if the Agency for Healthcare Research and Quality patient safety indictors (PSIs) could be used for case findings in the International Classification of Disease 10th revision (ICD-10) hospital discharge abstract data.
Design We identified and randomly selected 490 patients with a foreign body left during a procedure (PSI 5—foreign body), selected infections (IV site) due to medical care (PSI 7—infection), postoperative pulmonary embolism (PE) or deep vein thrombosis (DVT; PSI 12—PE/DVT), postoperative sepsis (PSI 13—sepsis)and accidental puncture or laceration (PSI 15—laceration) among patients discharged from three adult acute care hospitals in Calgary, Canada in 2007 and 2008. Their charts were reviewed for determining the presence of PSIs and used as the reference standard, positive predictive value (PPV) statistics were calculated to determine the proportion of positives in the administrative data representing ‘true positives’.
Results The PPV for PSI 5—foreign body was 62.5% (95% CI 35.4% to 84.8%), PSI 7—infection was 79.1% (67.4% to 88.1%), PSI 12—PE/DVT was 89.5% (66.9% to 98.7%), PSI 13—sepsis was 12.5% (1.6% to 38.4%) and PSI 15—laceration was 86.4% (75.0% to 94.0%) after excluding those who presented to the hospital with the condition.
Conclusions Several PSIs had high PPV in the ICD administrative data and are thus powerful tools for true positive case finding. The tools could be used to identify potential cases from the large volume of admissions for verification through chart reviews. In contrast, their sensitivity has not been well characterised and users of PSIs should be cautious if using them for ‘quality of care reporting’ presenting the rate of PSIs because under-coded data would generate falsely low PSI rates.
- EPIDEMIOLOGY
This is an Open Access article distributed in accordance with the Creative Commons Attribution Non Commercial (CC BY-NC 3.0) license, which permits others to distribute, remix, adapt, build upon this work non-commercially, and license their derivative works on different terms, provided the original work is properly cited and the use is non-commercial. See: http://creativecommons.org/licenses/by-nc/3.0/
Statistics from Altmetric.com
Article summary
Strengths and limitations of this study
-
To our knowledge, this is the first validation of the International Classification of Disease 10th revision (ICD-10) data in recording the Agency for Healthcare Research and Quality (AHRQ) patient safety indictors (PSIs).
-
We validated 5 of 20 PSIs.
-
Chart data were used as the reference standard; conditions not documented in the chart were missing.
Introduction
Patient safety is a critical component of healthcare quality. Assessments of patient safety are traditionally carried out through chart reviews, surveys and voluntary reporting of adverse events and medical errors.1 ,2 These data collection methods focus on a specific type of event, collect data from non-random and biased populations, cover limited geographic areas or are too labour-intensive for widespread use. Therefore, researchers have paid great attention to routinely collected hospital discharge abstract administrative data for population-based studies of adverse events.3 Therefore, the Agency for Healthcare Research and Quality (AHRQ) conducted pioneering work to develop patient safety indicators for use with the International Classification of Disease, 9th version, Clinical Modification (ICD-9-CM) administrative data, which cover large geographic areas and are readily available and relatively inexpensive to use.
AHRQ patient safety indicators (PSIs) were developed through a literature search, review of the ICD-9-CM manuals, consultation with physician panels and empirical data analyses. Over 200 ICD-9-CM codes representing potential patient safety problems were identified and 48 indicators were labelled as the most promising PSIs by the AHRQ research team. Of these, 20 hospital-level and 7 area-level PSIs were recommended by one or more multispecialty panels as a set of ‘accepted’ indicators.4 To facilitate the utilisation of PSIs, AHRQ developed and distributed (at no cost) SAS and SPSS software tools. PSIs can be used to help hospitals identify potential adverse events that might need further study and also provide an opportunity to assess the occurrence of adverse events and inhospital complications using routinely collected administrative data.
The AHRQ PSIs have been broadly used to assess the occurrence of adverse events and inhospital complications by many international and national agencies, including the Organisation for Economic Co-operation and Development. Drosler et al5 ,6 analysed hospital discharge abstract administrative data from multiple countries and found that the PSI rates varied across countries. The variation in the PSI estimate could be caused by true quality of care differences or by differences in data quality.
Administrative data have possible limitations for identifying complications that represent medical error or may be, at least in some way, preventable.4 First, administrative data are unlikely to capture all cases of a complication, regardless of the preventability, without false positives and false negatives. Second, when the ICD codes are accurate in defining an event, the clinical vagueness inherent in the description of the code itself may lead to a highly heterogeneous pool of clinical states represented by that code. Third, incomplete reporting may compromise the accuracy of any data source used for identifying patient safety problems, as medical providers might fear adverse consequences of ‘full disclosure’ in potentially public records such as discharge abstracts. Fourth, the ability of these data to distinguish events in which no error occurred from true medical errors is uncertain.
Data quality is commonly evaluated using four statistical parameters. Sensitivity is a measure of the accuracy of recording the presence of PSIs in administrative data when these are truly present according to reference data (ie, gold standard). Specificity is to determine the accuracy of reporting the absence of these PSIs in the administrative data when these PSIs are absent in the reference data. Positive predictive value (PPV) and negative predictive value (NPV) are to determine the extent to which PSIs present in the administrative data are also present in the reference data or the extent to which a condition absent in the administrative data is truly absent according to the reference data.
PSIs could be used for case finding or/and quality of care reporting. When PSIs are used for case finding and PPV is low, chart review or investigation is required to verify the true case status after identification of cases from the administrative data. When PSIs are used to generate the ‘quality of care report’ presenting rates, all these four statistical parameters of validity (ie, sensitivity, specificity, NPV and PPV) should be high.
PSIs have been validated using chart data as the ‘gold standard’ or ‘reference’ in the USA ICD-9-CM data only (see online supplementary appendix 1). Many countries have employed the International Classification of Disease 10th revision (ICD-10) for coding hospital discharge abstract data.7 However, the validity of PSIs in the ICD-10 data has not been studied. Therefore, we conducted this study to estimate PPV or ‘true positives’ of PSIs derived from the Canadian ICD-10 hospital discharge abstract data with a flag of presence on admission using chart reviews as a reference standard.
Methods
Identify patients at risk for each of the five PSIs from ICD-10 data
Of the AHRQ PSIs, we assessed PPV for five PSIs, which are quite likely to have high PPVs based on the literature (see online supplementary appendix 1), including a foreign body left during the procedure (PSI 5—foreign body), selected infections (IV site) due to medical care (PSI 7—infection), postoperative pulmonary embolism (PE) or deep vein thrombosis (DVT; PSI 12—PE/DVT), postoperative sepsis (PSI 13—sepsis) and accidental puncture or laceration (PSI 15—laceration).
Our study sample was composed of patients discharged in the years 2007 and 2008 from all three adult acute care hospitals in Calgary, Canada, a city with a population of just over 1 million. Professionally trained health records coders in Calgary code up to 50 diagnosis codes and 20 procedures for each patient using ICD-10-CA/CCI (Canadian ICD-10 and the Canadian Classification of Intervention).8 One coordinator supervises and manages the coding practice at the three sites to establish a consistent approach to coding.
We developed an ICD-10 PSI algorithm9 based on the AHRQ ICD-9-CM PSI definition manual as the blueprint (see the ICD-10 codes in online supplementary appendix 2). PSIs in the data were defined using the ICD-10 codes in the 49 secondary diagnosis coding fields. We included patients with those ICD-10 codes. The earliest admission date was assigned to patients as the index date for those with multiple admissions in the study period. Adverse events (eg, PE) are quite likely coded in the index admission as adverse events. Sometimes adverse events are not coded in the index admission but could be coded as the most responsible diagnosis for a subsequent admission. We missed these cases because the timing of adverse events was not recorded for the primary diagnosis. The indexed patients were stratified by the three hospitals and 50 patients were randomly selected per hospital for each PSI when there were more than 50 patients available. We aimed to review 40 patients at each hospital for each PSI, since at least 30 patients should be reviewed for calculating PPV.10 Because PSI 5, a foreign body left in during the procedure, occurs rarely, we expanded the observation period for this PSI to 2006–2009 to increase the number of patients. However, we did not reach the target sample size for PSIs 5 and 7. An operating room procedure was defined using the code for inpatient procedure room type: ‘1’ for the main operating room, ‘8’ for the cardiac catheterisation laboratory or ‘9’ for the ambulatory care operating room. Patients who underwent surgeries on the same day of the discharge (ie, day-surgery) or emergency room were not included because our administrative data do not capture these services.
Review charts to determine the presence and absence of PSIs
Corresponding patient charts for the sampled patients were located using a combination of the patient chart number and personal health number, which uniquely identifies each patient and admission. Two chart reviewers underwent training and practice in the data extraction process using the PSI data collection tools developed by AHRQ.11 In the training session, the definition of study variables was discussed. Then the reviewers extracted data independently for evidence of PSIs through an examination of the entire chart, including the cover page, discharge summaries, pathology reports (including autopsy reports), trauma and resuscitation records, admission notes, consultation reports, surgery/operative reports, anaesthesia reports, interdisciplinary progress notes and physician daily progress notes. The reviewers followed the AHRQ definitions to determine the presence or absence of the five PSIs, and specified whether these events were present at the time of admission or arose during hospitalisation. In the period of data collection, they discussed cases with uncertainty in determining conditions to ensure the consistency between them.
Statistical analysis
The ICD-10 administrative data and chart review data were linked, and the linked data were analysed using statistical software of SAS V.9.2. Study populations were characterised using descriptive statistics. As mentioned above, we calculated PPV and its 95% CI for each PSI recorded in the ICD-10 hospital discharge data accepting the chart review data as a ‘reference standard’. PPV determines the extent to which a PSI present in the ICD-10 data was also present in the chart review data. The unit of analysis is patient because one discharge abstract record and chart was assigned to each patient. Extra or additional information on data is available by emailing the lead author HQ.
Results
A total of 490 patients were included from the ICD-10 hospital discharge abstract data. There were 334 patients after excluding non-surgical patients for PSI 12—EP/DVT and PSI 13—sepsis (see figure 1) and 163 patients after excluding those with PSIs present on admission. We reviewed all charts of 490 patients.
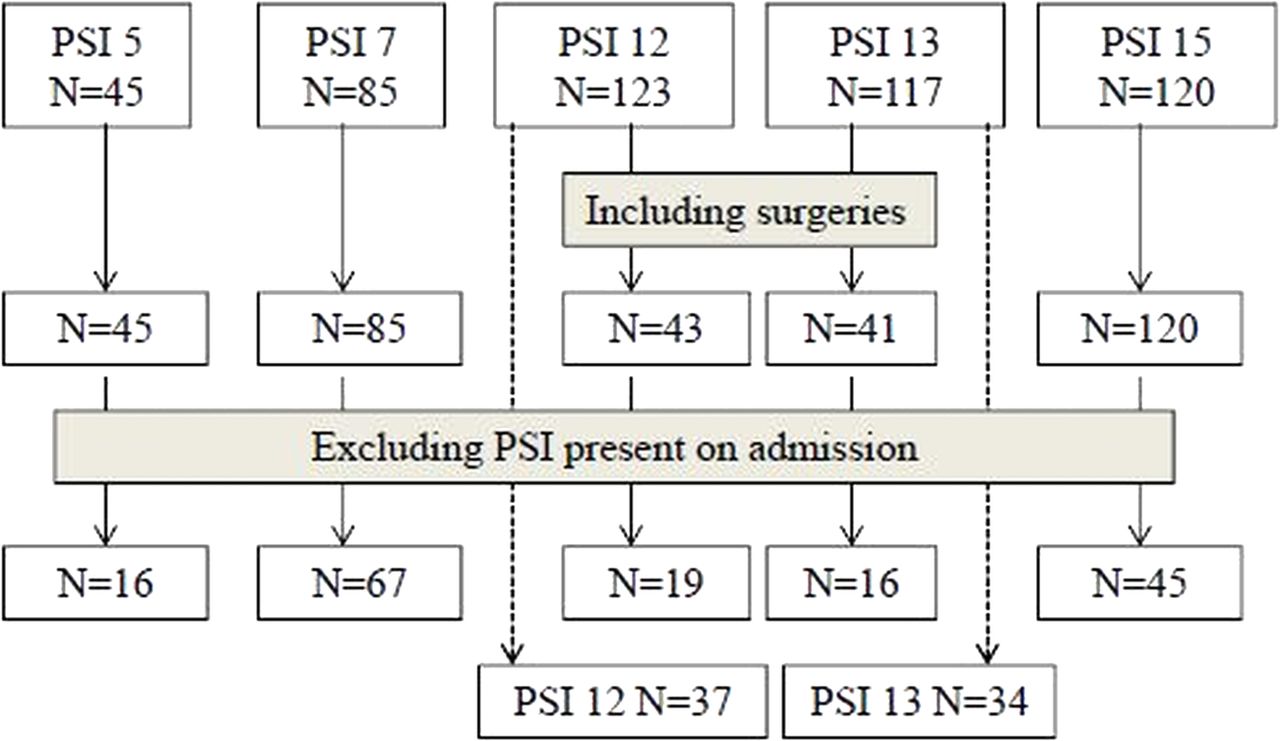
Sample size by patient safety indicator.
Among the 334 patients, the mean age ranged from 57.9 to 67.2 years across the five PSIs (see table 1). The proportion of male patients was lowest for PSI 13—sepsis (36.6%) and highest for PSI 7—infection (55.3%). Patients with PSI 7—infection, 12—PE/DVT or 13—sepsis stayed in hospital 32.7, 41.3 and 43.9 days on average.
Characteristics of patients by the Agency for Healthcare Research and Quality patient safety indictor (PSI)
Some countries do not code whether the condition was present at admission or arose during the hospital stay. When conditions present on admission were included (see table 2), PPV was 35.6% for PSI 5—foreign body, 70.6% for PSI 7—infection, 79% for PSI 12—PE/DVT, 9.8% for PSI 13—sepsis and 90.8% for PSI 15—laceration. When conditions present on admission were excluded from the analysis, PPV increased for PSI 5—foreign body (62.5%), 7—infection (79.1%), 12—PE/DVT (89.5%) and 13—sepsis (12.5%) but decreased for PSI 15—laceration (from 90.8% to 86.4%).
Positive predictive value and 95% CI for the Agency for Healthcare Research and Quality patient safety indicators (PSI) recorded in the International Classification of Disease (ICD)-10 hospital discharge abstract administrative data comparing the chart data
Considering that some countries may not code procedures in administrative data, we evaluated PPV among 123 PSI 12—PE/DVT patients and 117 PSI 13—sepsis patients ignoring surgical status. PPV was 25.2% for PSI 12—PE/DVT and 27.4% for PSI 13—sepsis. When present on admission was considered, PPV increased to 27% for PSI 12—PE/DVT and 47.1% for PSI 13—sepsis. The reasons for misclassification of PSI conditions in administrative data varied across PSIs (see table 3). The most common reason was that the condition was present on admission.
Reasons for false positives of AHRQ PSI in the ICD-10 hospital discharge abstract administrative data when the indicator of presence on admission was ignored
Discussion
Like previous PSI validation studies in the ICD-9-CM data, we focused on PPV in the ICD-10 administrative data as the foremost of our interests. Our study revealed that PSI PPVs in most instances are sufficiently high to support the widespread use of case findings. The low PPVs for some PSIs, such as sepsis, do not support utility of PSIs for quality of care reporting for comparisons across jurisdictions.
The validity of the ICD-10 data varied by PSI. PSI 5—foreign body and 13—sepsis had low PPV but PSI 7—infection, 12—PE/DVT and 15—laceration had high PPV. The high PPV for PSI 12—PE/DVT (89.5%) is supported by one US study12 (PPV=79%), but is higher than four other US studies (PPV=22–55%).13–16 In contrast to our finding for PSI 13—sepsis (PPV=9.8%), Romano et al15 reported a higher PPV for PSI 13—sepsis (45%). Similar to our finding PPV for PSI 15—laceration (PPV=90.8%), Kaafarani et al16 and Utter17 et al reported high PPV for PSI 15—laceration (91% and 85%, respectively).
Because low prevalence PSIs with reasonable precision (ie, 95% CIs) require many charts to be reviewed for calculating sensitivity, all previous studies, except the study conducted by Koch et al,18 evaluated data quality using PPV. The PPV value depends on the prevalence of PSI and varies greatly across PSIs and studies. For example, the PPV for PSI 12—PE/DVT ranged from 22% to 79% across studies conducted in the USA.12–16 Koch et al18 compared the agreement between the ICD-9-CM data, National Surgical Quality Improvement Program (NSQIP) and Cardiovascular Information Registry (CVIR) in PSIs. The agreement was substantial for PSI 12—PE/DVT and poor for PSI 9—haemorrhage, PSI 11—respiratory failure and PSI 13—sepsis. Sensitivity was very low; for example, it was 0.13% for PSI 9—haemorrhage, 1.35% for PSI 11—respiratory failure, 1.6% for PSI 12—PE/DVT and 0.13% for PSI 13—sepsis when ICD-9-CM and NSQIP were compared.
Variation in validity across PSIs is determined by factors related to physicians (ie, chart documentation) and coders (ie, coding guidelines and coders’ practice). Coders code medical events after discharge based on chart documentation. We used chart reviews as our reference standard; therefore, completeness of chart documentation could not be evaluated. Physicians might not document consequences of medical care in charts, leading to under-coding in hospital discharge abstracts. In addition, coders at hospitals are allotted a specific amount of time per chart on average, for example, 30 min in Alberta. Thus, they might focus on coding diagnoses and procedures that contribute significantly to length of stay such as PE/DVT and ignore minor conditions such as infection or laboratory results that indicate sepsis, to follow Canada national coding guidelines. Our reviewers focused on determining the presence or absence of conditions based on all documented information in the chart, including diagnostic imaging and laboratory results. This is in contrast to general coding guidelines8 that instruct coders to confine their coding to clinical problems, conditions or circumstances that are identified in the record by the treating physicians as the clinically significant reason for the patient's admission or that require or influence evaluation, treatment, management or care. Coders do not typically code problems that do not meet these requirements, whereas the reviewers who conducted our ‘reference standard’ chart review included them regardless of the significance of the condition on resource use during hospitalisation. Coders are instructed that when a condition is suggested by diagnostic test results, they should only code the condition if it has been confirmed by physician documentation. Our previous studies demonstrated that hospital discharge abstract data quality is not related to coders’ employment status (full-time/part time and length of employment) but to physician documentation quality.19 ,20
Excluding conditions present on admission improves PSI validity. For example, the PPV for PSI 12-PE/DVT increased from 79% to 89.5% by including or excluding the presence of the condition on admission. Canada has a long history of flagging timing of condition occurrence. Some US and Australian states currently have similar data elements in their discharge abstract data, and the USA has recently begun coding the timing of conditions nationwide. Timing of condition occurrence is not aimed at judging causal relationships between medical care and complications, just flagging whether the condition occurred or was diagnosed during the hospitalisation. To capture complications, Japan has specified fields for coding complications in its hospital discharge data, in addition to diagnoses and procedures.
Could AHRQ PSIs derived from hospital discharge abstract data be utilised for comparing quality of care across countries and/or jurisdictions or for monitoring system performance in an institution? Because data quality contributes to the magnitude of PSIs, data validity has to be similar across comparison groups (such as countries, regions or jurisdictions) and over time. Thus, PSIs should not be compared across jurisdictions without validation because adjustment for data validity is necessary. Our findings suggest that PSIs could be used to screen potential cases with adverse events using administration data. Confirming the presence of these events needs additional clinical information such as chart reviews. If PSIs are used for comparison, validity of data has to be adjusted and considered in the analysis.
While PSIs are used for monitoring quality of care improvement over time, the assumption of temporal consistency of data validity has to be met. Unfortunately, we did not evaluate PSI validity over time. Quan et al21 evaluated the impact of ICD-10 implementation on data quality through the chart review of 32 conditions. Canadian ICD-10 data had significantly higher sensitivity for one condition and lower sensitivity for seven conditions relative to the ICD-9-CM data. The two databases had similar sensitivity values for the remaining 24 conditions. Walker et al22 compared coding practices between ICD-9-CM and ICD-10 and reported that the number of diagnoses coded decreased in four Canadian provinces and remained similar in other five provinces after implementation of ICD-10. Januel et al23 reported that of the 36 conditions assessed in Switzerland, κ values for the ICD-10 and chart data increased for 29 conditions and decreased for seven conditions compared with the ICD-9-CM and chart data.
Our study has limitations. First, of the 20 AHRQ PSIs, we intentionally evaluated five conditions that might have a high validity. The remaining PSIs should be evaluated in future studies. Second, we used chart data as the reference standard; conditions not documented in the chart were missing. Prospective data collection through clinical examination on these events should be conducted to establish near gold standard. Third, this study was conducted in one urban area; the validity of PSIs might vary by institutions or regions. Fourth, we evaluated the validity using PPV alone. Sensitivity, specificity and NPV should be assessed for all the PSIs. Ascertainment of sensitivity requires a large sample size and involves expensive and time-consuming resources due to the low prevalence rate of PSIs. Fifth, the sample sizes for certain PSIs are small and a 95% CI is relatively wide.
In conclusion, our study supports that PSIs could be used for case findings in the ICD-10 hospital discharge abstract data. Even PSIs with low PPVs could be used to identify potential cases from the large volume of admissions for verification through chart reviews. In contrast, their sensitivity has not been well characterised because of the inherent challenges of reviewing the huge number of charts for properly testing sensitivity. Therefore, users of PSIs should be cautious if using these for ‘quality of care reporting’ presenting the rate of PSIs because under-coded data would generate falsely low PSI rates.
References
Supplementary materials
Supplementary Data
This web only file has been produced by the BMJ Publishing Group from an electronic file supplied by the author(s) and has not been edited for content.
Files in this Data Supplement:
- Data supplement 1 - Online appendix
Footnotes
-
Contributors HQ, WF, CDC and WAG contributed to conception and design, acquisition of the data, analysis and interpretation of the data and to the final approval of the version to be published. CE and CTC contributed to acquisition of the data, interpretation of the data, critical revision and to the final approval of the version to be published. ML contributed to acquisition of the data, analysis and interpretation of the data, critical revision and to the final approval of the version to be published.
-
Funding This work was supported by the Canadian Institutes of Health Research grant number 172490.
-
Competing interests HQ and WAG are supported by the Alberta Innovates-Health Solutions salary awards. WAG is supported by the Government of Canada Chairs. IMECCHI investigators are listed at http://www.IMECCHI.org.
-
Ethics approval Conjoint Health Research Ethics Board at the University of Calgary.
-
Provenance and peer review Not commissioned; externally peer reviewed.
-
Data sharing statement HQ will provide aggregated statistical data, not individual and raw data.