Article Text

Abstract
Objectives Muscle volume in patients with muscle disease is an index of disease progression. The aim of this study was to demonstrate a new method of muscle volumetry using CT of thigh muscles.
Design Observational study.
Participants (1) For muscle volumetry using CT and dual-energy X-ray absorptiometry (DXA), 13 patients with muscle disease participated. (2) For prospective CT volumetry, 12 patients participated over 4 years.
Primary and secondary outcome measures To establish the new CT volumetry, the results of which were correlated with the muscle mass calculated from DXA (primary outcome). To show the decrease in muscle volume using our method over 4 years (secondary outcome)
Methods (1) Helical CT imaging of the thigh was performed. CT images were analysed by applying estimated functions, and the accumulation of outcomes resulted in muscle volumes. We refer to this method as ‘net muscle volumetry’. Simultaneously, DXA was performed in these patients, and the muscle mass of the thigh was calculated with vendor-provided software. (2) To evaluate longitudinal changes in muscle volume, net muscle volumetry at the 14 cm section of the middle part of the thigh was performed repeatedly over a 4-year period.
Results (1) Volumes of the thigh muscle on one side were calculated to be 300–3400 cm3 using CT. Muscle mass of the thigh was calculated from DXA to be 1100–5000 g. These results correspond closely, with a Pearson correlation coefficient of 0.993. (2) Thigh net muscle volumes of seven patients with gait disturbance decreased over the 4-year study period (p<0.01).
Conclusions A method of measuring net muscle volume using CT, which was validated by muscle mass calculated from DXA, was developed. Decrements in net muscle volume over 4 years support the reliability of this method. This less arbitrary method is suitable for assessment of muscle volume in patients with muscular dystrophy.
This is an Open Access article distributed in accordance with the Creative Commons Attribution Non Commercial (CC BY-NC 3.0) license, which permits others to distribute, remix, adapt, build upon this work non-commercially, and license their derivative works on different terms, provided the original work is properly cited and the use is non-commercial. See: http://creativecommons.org/licenses/by-nc/3.0/
Statistics from Altmetric.com
Strengths and limitations of this study
-
CT is capable of acquiring muscle images in all patients within a short time, and can be adapted for patients who cannot remain still in MRI scanners, such as mentally retarded patients and those with claustrophobia.
-
There are problems with X-ray exposure for patients.
-
We cannot evaluate net muscle volumes of <300 cm3.
-
We cannot accurately distinguish muscle from connective tissue.
Introduction
Muscle volume in patients with muscle disease is an index of disease progression and the efficacy of therapy. Although muscle volume can be measured in healthy people using CT,1 MRI,2 dual-energy X-ray absorptiometry (DXA)3 and bioimpedance analysis,4 muscle volumetry in patients with muscular dystrophies has not been conducted.
The respiratory dysfunction and spinal scoliosis of patients has made it difficult to establish muscle volumetry using underwater weighting5 or bioimpedance analysis.4 Furthermore, muscle tissue in which muscle fibres are mixed with fat presents difficulties in distinguishing between the two components using imaging methods.
An increase in signal intensity of T1-weighted images, suggesting increased fat in the muscle of patients with Duchenne muscular dystrophy, has been reported,6 and the qualified MR grades and grades of clinical functional progression correlate closely.7 Several groups have performed muscle volumetry in patients with muscular dystrophy on either a single muscle or as whole-body trials; however, none of these trials included longitudinal measurements of muscle volume.8 ,9
Estimation of the concentration of fat using the Dixon sequence on MRI has been reported, but the concentration of muscle was not calculated using this method and muscle volume was not estimated.10–12
Cross-sectional area analysis (CSA)13 ,14 using CT showed that the muscular CSA of the middle section of the thigh corresponded well to muscle power and volume; however, muscle volume could not be accurately estimated because of the coexistence of muscle fibres and fat tissue in the same muscle bundles of patients with muscular dystrophies.
Although the histogram of CT values in the thigh muscle showed peaks in muscle CT values in patients with non-neuromuscular disease or very mild muscular dystrophy, the peak of the histogram shifted to fat CT values according to disease progression.15 Intermediate CT values between those of fat and muscle corresponded to the concentration ratio of muscle fibres and fat in muscle tissue. Previously, the main objective of muscle volumetry has been to distinguish muscle from fat,14 ,15 and voxels that showed intermediate CT values were not investigated.
The method used to distinguish the two tissues by standard CT values may underestimate muscle volume, because muscle tissue that was mixed with fat tissue and represented lower CT values than standard muscle CT values was completely lost1,4 (figure 1). The method used to separate muscle from fat anatomically also did not deal with muscle tissue mixed with fat because the method was developed for healthy people or athletes.15

Estimation of muscle volume using only standard CT values. The voxels, the CT values of which were 40–65, were estimated for muscle tissue according to a previously reported method.7 This patient with progressive muscular dystrophy was able to walk with a cane, but he would not be able to according to this presumed muscle tissue image obtained by the previous method.
In this study, we proposed a method of estimating muscle volume in muscle tissue mixed with fat tissue using CT in patients with muscular diseases. We determined standard CT values of muscle and fat in helical CT and developed a new method for measuring muscle volume using our estimation function in patients’ thigh muscles, where skeletal muscle mainly contributes to daily functions such as walking and could be imaged easily using CT. We referred to this new method as ‘net’ muscle volumetry. We compared results from this method with DXA analysis and the disability classification of the muscle disease. Finally, we modified the method to a long-term applicable method by calculating constant zones. To ascertain the usefulness of this novel method of volumetry of diseased muscle, we prospectively followed 14 patients with muscular dystrophy and observed progressive decreases in net muscle volume over 4 years.
Subjects
Standard CT values of muscle
Abdominal CT images of 114 patients with non-neuromuscular disease, who had been scanned using CT for abdominal pain using a Toshiba multi-detector CT scanner (Aquilion 8 and 64) and were 20–30 years old (mean±SD 24 ± 3.52), were used to evaluate muscle and fat CT values at Yokohama Rosai Hospital. They were studied according to the Human Research Guidelines of the Internal Ethics Review Board of Yokohama Rosai Hospital. Abdominal organs and muscles surrounding the abdominal cavity were not obviously impaired in these images. We evaluated the CT image at a constant level referred to the umbilicus of each patient.
Muscle volumetry using CT and DXA
All patients with muscular dystrophy presenting in 2007 at Yokohama Rosai Hospital, NHO Suzuka Hospital, NHO Shimoshizu Hospital and NHO Higashisaitama Hospital were asked to participate in the study, and 13 patients (four with facioscapulohumeral muscular dystrophy (FSH), six with type l myotonic dystrophy (MyD), two with limb-girdle muscular dystrophy (LGMD), one with inclusion body myositis (IBM); 11 male, two female; aged between 19 and 67 years (mean±SD 52.7 ± 14.7)) agreed. All patients were clinically or pathologically diagnosed. They were studied according to the Human Research Guidelines of the Internal Ethics Review Board of Yokohama Rosai Hospital and the National Hospital Organization. The patients gave written informed consent. Their clinical disability stage was determined using Ueda's Motor Disability Classification, which is widely used in patients with muscular dystrophies in Japan.16 The original report of this classification was published in Japanese and was not listed on the PubMed database; therefore we show corresponding lists of Ueda's functional disability stages and the leg grading scale of the Vignos Functional Rating Scale (table 1).17 The a priori number of patients analysed by correlation coefficient was estimated using G*power (http://www.psycho.uni-duesseldorf.de/abteilungen/aap/gpower3/; effect size=0.5, α error probability=0.05, power=0.8); it was calculated to be 26 limbs of 13 patients.
Ueda's Motor Disability Classification based on Japanese lifestyle and the leg grading scale of the Vignos Functional Rating Scale
Prospective net muscle volumetry using CT
Twelve patients (three with FSH, three with MyD, two with bulbospinal muscular atrophy, two with IBM, one with LGMD, and one with periodic paralysis; nine male, three female; aged between 31 and 66 years (mean±SD 50.67±13.1)) participated for 4 years (2007–2010) at Yokohama Rosai Hospital and NHO Suzuka Hospital. They all gave written informed consent.
Methods
Standard CT values of muscle
To determine standard CT values for muscle and fat, muscle CT values of paravertebral and iliopsoas muscles and fatty CT values of subcutaneous fat were obtained. Regions of interest (ROIs) were drawn at a prespecified level including the whole muscle, and mean ROI values were reported.
Muscle volumetry using CT
CT data acquisition
Data were acquired with a Toshiba multi-detector CT (Aquilion 8, 16 and 64) and an Hitachi multi-detector CT (ROBUST, from 4 to 64 detectors). CT imaging was performed between the greater trochanter and patella with a 1 cm slice thickness 512×512 matrix, and 120 kV tube voltage.
CT analysis
-
DICOM files between the greater trochanter and patella were obtained from the image server. DICOM is a standard medical file format, and DICOM files contain patient data and images.
-
According to our standard CT values for muscle and fat, the minimum (min) standard CT value, which was the mean minus 2 SDs, and maximum (max) standard CT value, which was the mean plus 2 SDs, were determined for each tissue. Voxels with CT values between the min and max standard muscle CT value and between the min and max standard fat CT value were assumed to be muscle and fat tissue, respectively. The other voxels with CT values between the max standard fat CT value and min standard muscle CT value, or between the max standard muscle CT value and max standard muscle CT value plus (the min standard muscle CT value minus max standard fat CT value) were assumed to be the complex tissue of muscle and fat, or muscle and other tissues, respectively. We estimated muscle density function as below (figure 2).
 where F=mean fat CT value, M=mean muscle CT value, F_SD=standard deviation of fat CT value, M_SD=standard deviation of muscle CT value, A=(M−2×M_SD)−(F+2×F_SD), M−2×M_SD=min standard muscle CT value, M+2×M_SD=max standard muscle CT value, F−2×F_SD=min standard fat CT value, F+2×F_SD=max standard fat CT value.

Using MATLAB, we applied the estimated function to the DICOM image, assigned the obtained muscle density to an 8-bit scale, and wrote an 8-bit grey scale TIFF image file (figure 3). MATLAB is a numerical computing environment and programming language developed by MathWorks.
-
Obviously different structures from muscle were eliminated on the density map using Adobe Photoshop.
-
Post-processing density map files were collected using MATLAB, and muscle volume was calculated from a total summation of muscle density multiplied by voxel size. We referred to this muscle volume as net muscle volume.

Estimation of muscle volume from voxels. Estimation of muscle volume from voxels where muscle and fat coexist is shown. CT values of voxels, composed of muscle and fat, depend on the ratio of the two components. The histogram shows CT values of the thigh, and the two peaks corresponding to fat and muscle are shown. At a CT value of −75, the pixel includes 0% muscle, and at a CT value of 45, the pixel includes 100% muscle. The two points were connected with a linear function, this was then fitted to the histogram, and, as a result, muscle density was obtained. This linear function was linearly symmetrically transferred to the other side of the muscle peak of the CT value.

Process of calculating muscle volume. These images were calculated from DICOM data. Muscle is shown. We deleted obvious vessels and skin tissues manually from the density map, leaving a muscle volume map of the thigh. Accumulation of outcomes results in muscle volume.
Muscle volumetry using DXA
DXA data acquisition
Data were acquired with Lunar pencil beam type DXA scanners (DPX-LIQ, GE Lunar), and whole-body DXA scans were performed.
DXA analysis
Muscle mass was calculated from manually segmented thigh parts of data on attached software with DXA (DPX-L software V.1.3). We calculated fat, lean mass, and bone and regarded the lean mass as the muscle mass, as described in a previous report.3
We statistically compared the two results by Pearson correlation coefficient and Bland–Altman plot. We referred to this muscle volume calculated by our new method as net muscle volume. We also compared Ueda's Motor Disability Classification of the lower extremities of the patients with their standardised net muscle volume (muscle volume of thigh divided by square of body height)18 and statistically tested them by Spearman correlation coefficient.
Simultaneously, the correlation between the ratio of net muscle volume divided by the distance from the trochanter to the patella and the muscle square at the centre of the thigh was tested by Pearson correlation coefficient and regression analysis.
Prospective net muscle volumetry using CT
To compare results over several years, we measured muscle volumes of the 14 cm section of the middle part of the thigh (between 7 cm above and below the midpoint of the trochanter and patella) over 4 years. We performed a scan once a year over the 4-year period.
We used SPSS V.20 for statistical analysis.
Results
Standard CT values of muscle
Standard CT values for muscle and fat were found to be 56.3 ± 11.3 (2 SD) and −98.3 ± 22.8 (2 SD), respectively.
Muscle volumetry using CT and DXA
The volume of the thigh muscle on one side was calculated to be 300–3400 cm3 by CT, and these volumes correlated with the muscle strength of these legs. Muscle mass of the thigh from DXA was calculated to be 1100–5000 g. A regression line between muscle mass and muscle volume estimated that: muscle mass (g)=1.23×muscle volume (cm3)+731 (g). The two results correspond closely, with a Pearson correlation coefficient of 0.993 (p=0.000), an interclass correlation coefficient (ICC(3,1)) of 0.970, and an SE of measurement of 79.06 cm3 in a Bland–Altman plot (figure 4).
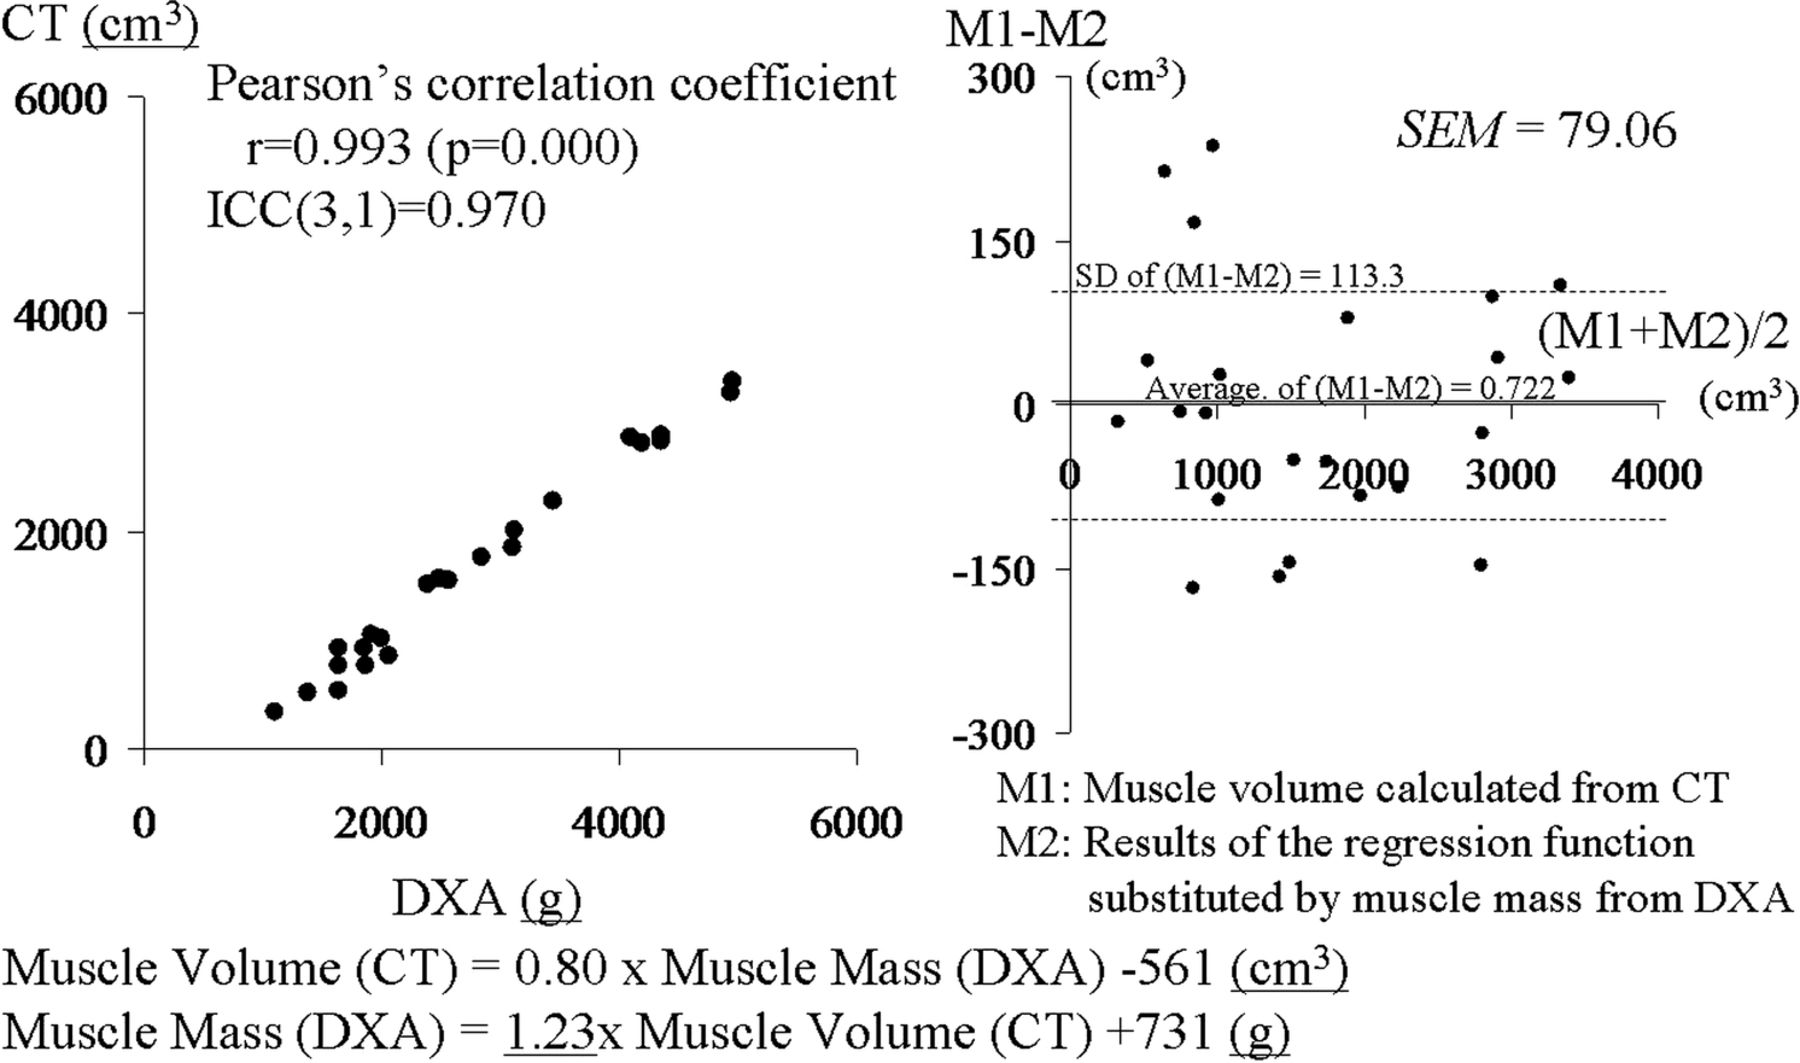
Correlation between muscle volumes calculated from CT and muscle mass obtained from dual-energy X-ray absorptiometry (DXA). Results from DXA and CT are plotted. These results correspond closely, with a Pearson correlation coefficient of 0.993 and interclass correlation coefficient (ICC(3,1)) of 0.970. The regression line was: muscle volume (CT)=0.80×muscle mass (DXA)−561 (cm3), muscle mass (DXA)=1.23×muscle volume (CT)+731 (g). A Bland–Altman plot between the results of the regression function replaced by muscle mass from DXA and the muscle volume calculated from CT showed no additional or proportional error and an SE of measurement of 79.06 cm3.
As Ueda's Motor Disability Classification of the lower extremities worsened, the standardised muscle volume (volume of thigh muscle divided by square of body height16) decreased, with a Spearman correlation coefficient of 0.767 (p=0.000) (figure 5).

Correlation between muscle volume and disability stage. As Ueda's Motor Disability Classification based on Japanese lifestyle in the lower extremities deteriorates, the standardised muscle volume (muscle volume divided by square of body height) decreases, with a Spearman correlation coefficient of 0.767. The leg grading scale of the Vignos Functional Rating Scale is also shown.
In addition, the ratio of muscle volume divided by the distance between the trochanter and patella correlated highly with the muscle square at the centre of the thigh, with a Pearson correlation coefficient of 0.978 (p=0.000). A regression line between volume of the thigh muscle and the central muscle area estimated that: muscle volume of the thigh (cm3)=(12.1×central cross-sectional muscle area−9.66)×distance between the greater trochanter and the patella.
Prospective net muscle volumetry using CT
The net thigh muscle volume in seven patients with gait disturbance decreased in this period, but their functional classification did not change. The rate of decrease was 8.54%/year (p=0.000 by a paired t test) (figure 6). At this rate, a reduction in muscle volume of 41.0% would be expected over a 10-year period. The net thigh muscle volume in five patients who did not have gait disturbance did not decline (p=0.372 by a paired t test; reduction rate was 0.39%/year).

Prospective net muscle volumetry over 4 years. Over these 4 years, thigh muscle volumes in seven patients with gait disturbance decreased (p=0.000). The rate of decrease was 8.54%/year. The volume in five patients who did not have gait disturbance did not decline significantly (p=0.372). Samples of muscle density maps of patients with and without gait disturbance are shown on the right.
Discussion
We have developed a method for measuring muscle volume based on CT, which was validated by muscle mass calculated using DXA. In addition, we demonstrate that the decrease in muscle volume is closely related to decline of muscle functional classification. The inclination of the regression line between muscle volume from CT and muscle mass from DXA was calculated to be 1.23 and represented the density of the muscle. It closely followed the specific gravity of the muscle, which was 1.17,19 and also supported the probability of the calculation results. The demonstration of muscle volume decrease or consistency over 4 years also supports the reliability of this method.
The CT scanner is a widely used imaging tool, and muscle images can be obtained in a short time. Although there are problems with X-ray exposure for patients, we can obtain muscle CT images of patients who cannot remain still in MRI scanners, such as mentally retarded patients and those with claustrophobia. MRI would be preferable in children because of the radiation dose. However, in adults with muscular dystrophy and a low life expectancy because of the natural course of the disease, CT might be a valuable alternative.
In this study, muscle was not anatomically or manually distinguished from other tissues, but was mostly automatically differentiated, with the estimating function applying CT values of image pixels. In contrast, in DXA analysis, it is easy to make an error during manual procedures of segmentation of the thigh from the trunk. It has been suggested that our approximately automatic process is superior to DXA analysis. Furthermore, this method can be automated in a simple way and might therefore be superior to MRI evaluations, where extensive manual segmentation is necessary. This less arbitrary method is suitable for assessment of muscle volume in patients with muscular dystrophy under clinical treatment trials and will become a strong clinical outcome measure for disease progression of patients with muscular dystrophies. However, there are limitations to this net volumetry. We cannot evaluate net muscle volumes of <300 cm3, because in the images of the patients whose net muscle volumes were <300 cm3, muscle tissue was almost completely changed to fat.
In this prospective net muscle volumetry, we calculated a 14 cm section of the middle part of the thigh, between 7 cm above and below the midpoint of the trochanter and the patella, thereby minimising spatial errors. For muscle volume, when measuring all sections between the trochanter and patella, the elimination of genital organs and tendons may lead to manual errors between examiners. On repeat examination, a difference in the number of slices between scans may occur, and a difference in the number of slices may cause fluctuations in muscle volume by several per cent (1/30–1/20, ie, 3–5%). On the other hand, the summation of a few slices will lead to positional differences between scans; therefore, we confirmed the number of slices as far as possible from experience. In addition, we decided to calculate the sections, because the diameter of the thigh was not so different between the upper and bottom slices at the middle part of the thigh.
Slice thickness was determined to be 10 mm, similarly to cadaver thigh MRI and CT scans20 and proportionally to the 3 mm slice thickness in mice volumetry using CT.21 To minimise manual procedures, the numbers of slices should be reduced, and slice thickness should be as large as possible.
We determined the estimating linear function in the form of linear symmetry and as a median with muscle CT values on the histogram of CT values of images, because muscle and fat peaks on the histogram of CT values of patients with non-muscular disease seemed to be normally distributed.22
Although decreases in, or consistency of, net muscle volume was measured by our method, accurate separation of muscle from connective tissue was impossible for similar CT values of muscle and connective tissue. It was supposed that muscle tissue experiences fatty changes, but intramuscular connective tissue may not significantly increase within a year.
In addition, for child patients, evaluation of disease progression can be estimated from the residual muscle ratio: net muscle volume divided by net muscle volume+intrafascial fat volume in the middle part of the thigh, where muscle CSA correlates closely with volume of the thigh muscle.14
Finally, as muscle volume differs between patients according to their height, weight and other factors, muscle volumes cannot be used for comparison between patients, but only as an index of the efficacy of therapies or of the progression of disease in one patient.
References
Footnotes
-
Contributors TN, SK, YM and MK contributed to all of this study. MO contributed to the muscle volumetry using DXA.
-
Funding This study was supported by the Research Program on Neurological Diseases of the Japan Ministry of Health, Labour, and Welfare (grant number 20B-12).
-
Competing interests TN, SK, YM and MK did not receive any research support fees from TANITA Body Weight Scientific Institute.
-
Patient consent Obtained.
-
Ethics approval Yokohama Rosai Hospital, NHO Suzuka Hosipital, NHO Higashisaitama Hospital, NHO Shimoshizu Hospital.
-
Provenance and peer review Not commissioned; externally peer reviewed.
-
Data sharing statement No additional data are available.