Article Text

Abstract
Objective To evaluate the changes in body mass index (BMI) and waist circumference (WC) and their associations with the prevalence of hypertension and type 2 diabetes mellitus (T2DM) in Chinese adults.
Design 2 consecutive population-based cross-sectional surveys.
Setting A total of 12 districts and seven counties in Shanghai, China.
Participants 12 329 randomly selected participants of the survey in 2002–2003, and 7423 randomly selected participants of the survey in 2009. All participants were residents of Shanghai aged 35–74 years.
Outcome measures Measured BMI and WC. Previously diagnosed and newly identified hypertension and T2DM by measured blood pressure, fasting and postload glucose.
Results While the participants of the two surveys were comparable in BMI in each age group, the participants of the 2009 survey had significantly larger WC than those of the 2002–2003 survey, with an annual percentage change being higher among participants aged 45–49 years in men and women. The increase in prevalence of T2DM was observed in all age groups and also appeared more evident in participants aged 45–49 years. The prevalence of hypertension was observed to increase more rapidly in elderly men and middle-aged women. Obesity, both overt and central, was associated with the risk of the two diseases, but BMI was more strongly linked to hypertension while WC appeared more evidently related with T2DM.
Conclusions The prevalence of central obesity and related chronic diseases has been increasing in Shanghai, China. Our findings provide useful information for the projection of the growing burden of T2DM and hypertension in Chinese adults.
- Epidemiology
- Public Health
This is an Open Access article distributed in accordance with the Creative Commons Attribution Non Commercial (CC BY-NC 3.0) license, which permits others to distribute, remix, adapt, build upon this work non-commercially, and license their derivative works on different terms, provided the original work is properly cited and the use is non-commercial. See: http://creativecommons.org/licenses/by-nc/3.0/
Statistics from Altmetric.com
Article summary
Strengths and limitations of this study
-
The strict process of multistage sampling in the adult population of Shanghai, anthropometric measurement according to a standardised protocol and fasting and postprandial blood glucose tests for the participants.
-
The nature of the cross-sectional study design limits our ability to directly evaluate the influence of overall and central obesity as well as the change of their prevalence on the risk of hypertension and type 2 diabetes mellitus.
-
The differences in several demographic characteristics between the participants of the two surveys indicate the possibility of selection bias.
Introduction
A rising worldwide prevalence of chronic disease, manifested primarily as hypertension and type 2 diabetes mellitus (T2DM), has been well documented.1–4 In Chinese people aged 15–74 years, the prevalence of hypertension increased from 5.11% in 1959, 7.73% in 19795 and 13.58% in 19916 to 17.65% in 2002.7 The prevalence of T2DM tripled between 1980 (about 1%) and 1996 (3.2%),8 ,9 and reached 9.7% in 2008 among adults at 20 years of age or above.10 It is estimated that over 92 million people in China have T2DM. This represents approximately half of the world's diabetic population, and places China at the ‘global epicenter of the diabetes epidemic’.4
Both hypertension and T2DM are associated with obesity.11 ,12 Obesity is often measured by body mass index (BMI). Across the entire range of BMI, the risk of hypertension and T2DM increases, making a higher BMI a strong predictor of hypertension and T2DM.4 ,12–14 However, a significant proportion of Asian adults diagnosed with T2DM are with the normal BMI of that is, 18.5–25 kg/m2.15 ,16 BMI is a general indicator of overt obesity, but does not give information about the distribution of obesity. Central obesity, often assessed through waist circumference (WC), is also strongly correlated with T2DM in European and Asian adults.11 ,17 While changes in BMI have been well documented in China over the past decades,2 ,18 changes in WC, and thus central obesity, are not well described.
In this study, we took advantage of the data from population-based cross-sectional surveys conducted in Shanghai in 2002–2003 and in 2009. We used data from the two surveys to evaluate correlations between shifts in BMI and WC with the prevalence of hypertension and T2DM in Chinese adults. Our results may help to better understand the contribution of overall obesity and central obesity in the increasing burden of chronic disease in China.
Materials and methods
Study participants
A representative sample of the general population was randomly selected through a multistage sampling process in the 2002–2003 survey. First, 4 districts and 2two counties were randomly selected from a total of 12 districts and 7 counties in Shanghai, China. And then, 1–2 subdistricts or towns were randomly selected from each selected district or county. Next, 1–2 communities or villages, usually 1000–2000 residents each, were randomly selected from each selected subdistrict or town. Finally, eligible participants (permanent residents of Shanghai, 15–74 years old and having been in the city for at least 5 years) were randomly selected from the selected communities and villages and were invited for participation. Pregnant women, individuals with type I diabetes, and physically or mentally disabled persons were excluded from the participation. During the period of May 2002–October 2003, a total of 17 526 eligible participants were recruited, and 14 401 (82.17%) participated the survey.
The 2009 survey used a similar sampling method except that only 7seven communities and villages were randomly selected in the third stage of sampling. The inclusion and exclusion criteria of the 2009 survey were also similar to those of the 2002–2003 survey, except that only those at the age of 35–74 years were eligible for the 2009 survey. Among 7627 eligible adults contacted during the period of May–July 2009, 7414 (97.21%) were interviewed and donated blood samples.
To make the two surveys comparable, we excluded 1071 participants younger than 35 years from the 2002–2003 survey. After further excluding participants with missing information, the final analysis included 5050 men and 7279 women in the 2002–2003 survey and 3461 men and 3962 women in the 2009 survey. Informed consent was obtained from each participant before data collection and laboratory measurements.
Data collection
A similar survey approach was followed by the two investigations. In both surveys, information on demographic and socioeconomic factors, diagnosis of diabetes, tobacco and alcohol use, physical activity and family history of diabetes was collected by trained interviewers with a structured questionnaire at community clinics located in the residential areas of the participants.
At the interview, each participant's blood pressure, body weight, standing height and WC were measured by trained staff. Blood pressure was measured on the right arm in the sitting position using standard mercury sphygmomanometer after at least 5 min of rest. The first and fifth Korotkoff sounds were recorded. Body weight and height were recorded while the participant was in light clothing and without shoes. Body weight was measured with electronic scales to the nearest 0.1 kg. Body height was measured to the nearest 0.1 cm by using a stadiometer. WC, recorded to the nearest 0.1 cm, was taken with a cloth tape and was measured on bare skin at the midline between the lower border of the ribs and the iliac crest in the horizontal plane after a normal expiration. Two measurements were taken and the mean of the replicates was used in the following analyses. BMI was calculated as weight in kilograms divided by height in metres squared (kg/m2) using direct measurements.
Laboratory measurements
After at least 10 h of overnight fasting, 1–1.5 mL venous blood specimen was collected in a vacuum tube containing sodium fluoride. All participants with no history of diabetes and having a fasting plasma glucose level <7 mmol/L were then asked to have an oral glucose-tolerance test. Blood samples were drawn at 0 and 120 min after a standard 75 g glucose load. Plasma glucose was measured with the glucose oxidase-peroxidase method.
Diagnosis of T2DM and hypertension
Previously diagnosed T2DM and hypertension was identified by a positive response from the participant to the question of “Have you ever been diagnosed with T2DM/hypertension by a doctor?” and confirmed by medical records in which prescriptions of antihypertensive or hypoglycaemic medications were presented. The consistent rate was 100%. For those who had a negative response, the T2DM was diagnosed with measured glucose level by using the 1999 WHO diagnostic criteria (Department of Noncommunicable Disease Surveillance. Definition, diagnosis and classification of diabetes mellitus and its complications: report of a WHO consultation. Part 1. Diagnosis and classification of diabetes mellitus. Geneva: WHO, 1999 (accessed 5 July 2010, at http://www.staff.ncl.ac.uk/philip.home/who_dmg.pdf.) and hypertension referred to the participants with measured systolic blood pressure ≥140 mm Hg or diastolic blood pressure ≥90 mm Hg and confirmed by clinical visits. Total T2DM and hypertension included both previously diagnosed and newly diagnosed patients. In total, 42.7% (1110 of 2598) patients with diabetes and 10.3% (694 of 6735) patients with hypertension were newly diagnosed in the two surveys.
Statistical analysis
SAS software 9.2 was used for all statistical analyses. Characteristics of the subgroups were described using summary statistics (median, 25th and 75th centiles, frequencies and percentages) separately for men and women. The differences between two surveys were compared using χ2 test (category variables) and Wilcoxon tests (continuous variables). The annual percentage changes in prevalence between two surveys were calculated as (prevalence in 2009−prevalence in 2002–2003)/number of years using logarithms for each age group. Percentile curves were constructed for BMI and WC values in the two surveys by gender using the LMS (lambda, mu, sigma) method. Restricted cubic splines (RCSs) were used to model a potential curvilinear relationship of BMI and WC with hypertension and diabetes using the 5th, 25th, 75th and 95th centiles as fixed knots and the 50th centile as the reference. Polynomial logistic regressions were used to estimate the ORs and 95% CIs of BMI and WC with T2DM and hypertension. Meta-analysis was applied to obtain the combined ORs and 95% CI considering the potential heterogeneity of the populations in the two surveys. The residual method was used to derive the independent effect of BMI and WC with each other in the models. p Value less than 0.05 was considered as a test of significance based on two sides.
Results
The male participants in two studies were similar in age, resident site and cigarette smoking while the female participants were comparable only in cigarette smoking (p > 0.05; table 1). Compared with the participants in the 2002–2003 survey, the participants of 2009 survey, both men and women, had lower level of education, higher level of income per capita, history of T2DM, higher frequency of alcohol drinking and lower frequency of leisure time activity, and were more likely to have a family history of diabetes.
Characteristics of participants in two population-based surveys in Shanghai, China
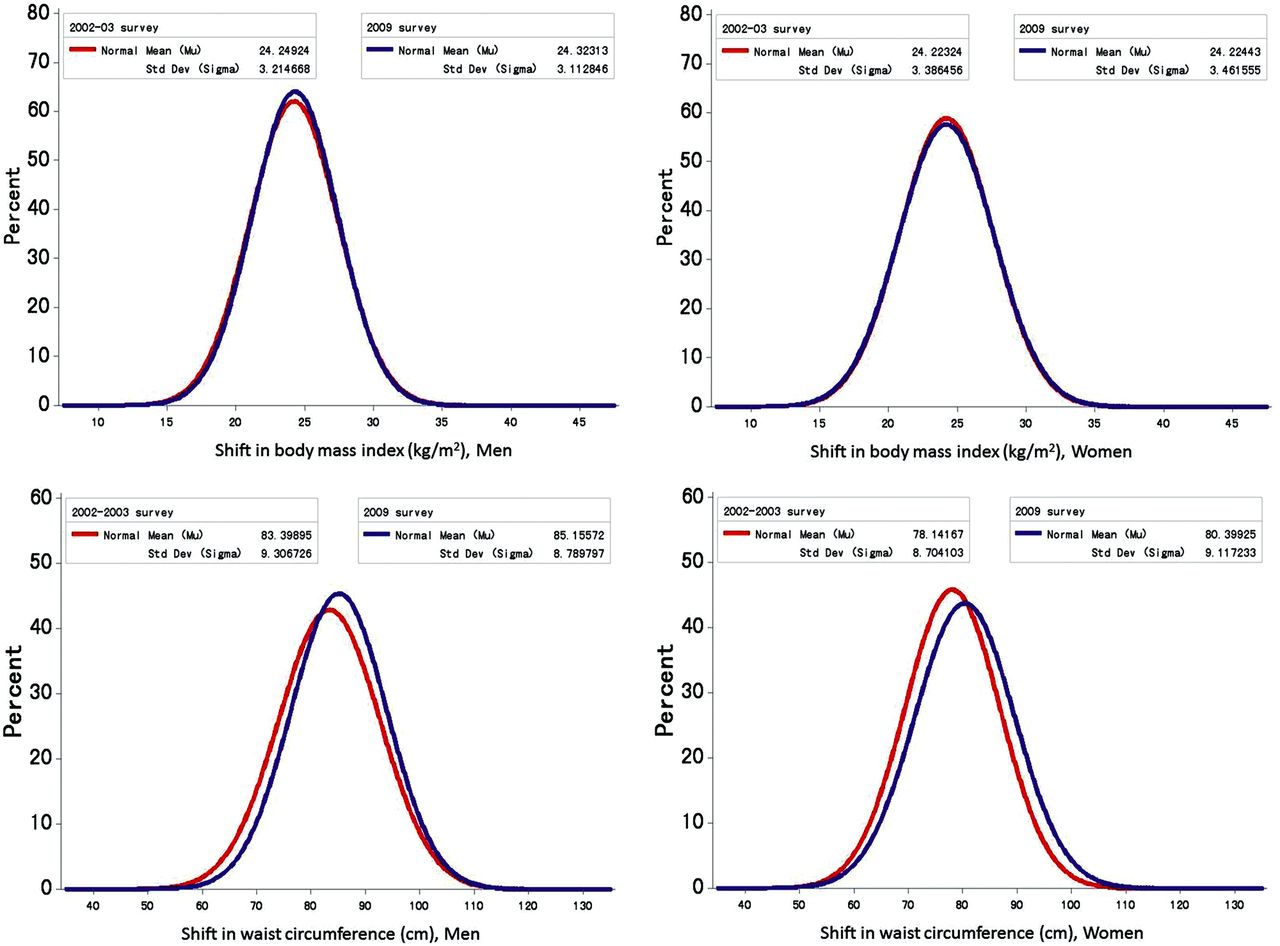
Figure 1 shows the shapes of the BMI and WC distribution curves among men and women changed over the period of the two surveys. After adjusting for age, education, per capita income, resident site, smoking, drinking, regular exercise and family history of T2DM, the curves of BMI were almost overlapped in men and women. However, the WC curves for men and women were shifted to the right between 2002–2003 and 2009, with the mean WC increasing from 83.4 to 85.2 cm for men and from 78.1 to 80.4 cm for women.

Shift in body mass index (BMI) and waist circumference over the period of the two population-based surveys.
As presented in table 2, the prevalence of obesity, both overall and central, increased with increasing age groups. While the prevalence of overall obesity (BMI ≥28 kg/m2) did not change between two surveys (all p values >0.05), the prevalence of central obesity was significantly higher in the 2009 survey in each age group (all p values <0.001). A more pronounced increase in the prevalence of central obesity and T2DM was observed among participants aged 45–49 years in men and women; whereas the change in the prevalence of hypertension between two surveys appeared more evident in older men and younger women over the period. Using the WHO criteria for obesity did not change the results substantially (data not shown in the tables).
Prevalence of obesity, hypertension and type 2 diabetes in participants of two population-based surveys by age groups in Shanghai, China
BMI and WC were highly correlated with each other, with a correlation coefficient of 0.77 (p<0.0001) among men and 0.78 (p<0.0001) among women after adjusting for age. Therefore, the residual method was used to test the potential respective non-linear relationships of BMI and WC with the risk of T2DM and hypertension (figure 2). The dose–response analysis likewise showed a statistically significant increased risk of T2DM at high level of WC and a significant elevated risk of hypertension at high level of BMI in men and women after adjusting for age, education, per capita income, resident site, smoking, alcohol consumption, regular exercise, family history of T2DM and phase of surveys, with p values for non-linear relationship tests <0.05. No significant relationship was observed between BMI and T2DM in men and between WC and hypertension in women.

Non-linear dose–response relationship of body mass index and waist circumference with hypertension and type 2 diabetesdiabetes mellitus among participants of the two population-based surveys.
As shown in table 3, in both sexes, BMI adjusted for WC (residuals) appeared more strongly associated with hypertension while WC adjusted for BMI (residuals) was more evidently related with T2DM. Comparing with the lowest quartile of BMI residuals, the risk of hypertension increased 85% (95% CI 1.59 to 2.15) in men and 1.23-fold (95% CI 1.94 to 2.57) in women, whereas the risk of T2DM did not increase significantly in both sexes. On the other hand, the ORs of the highest versus the lowest quartile WC residuals for T2DM were 1.75 (95% CI 1.33 to 2.30) in men and 2.37 (95% CI 1.78 to 3.15) in women, higher than the OR 1.57 (95% CI 1.35 to 1.82) in men and 1.13 (95% CI 0.98 to 1.30) in women for hypertension.
Association of body size with hypertension and type 2 diabetes in two population-based surveys in Shanghai, China
We further evaluated the potential joint effect of BMI and WC on T2DM and hypertension (table 4). The participants were classified into normal weight (BMI 18.5–23.9 kg/m2), overweight (24–27.9 kg/m2) or obese (≥28 kg/m2) based on data from Chinese adults, and were defined as with normal or increased WC using sex-specific cut-offs (85 cm in men and 80 cm in women).19 The risk of T2DM and hypertension increased across groups defined by BMI and WC, with the highest risk observed among men with the lowest BMI but a higher WC, and among those with the highest BMI and a higher WC for hypertension. However, no significant interaction was observed between BMI and WC (all p values for interaction tests >0.05).
Joint effect of general obesity and central obesity on type 2 diabetes among Chinese adults
Discussion
In this representative sample of the adult population in Shanghai, the largest city in China, we observed an increased prevalence of central obesity, hypertension and T2DM over the decades spanning 2002–2009. In contrast, BMI did not change over the same period. Our results present a snapshot of overt versus central obesity in the Chinese population and suggest that the epidemic of central obesity in this population, which has been more closely associated with the prevalence of T2DM, may lead to a more rapidly growing burden of T2DM in China.
Chinese adults have lower rates of overweight and obesity than their western counterparts using the WHO criteria (BMI≥25 kg/m2 for overweight and BMI≥30 kg/m2 for obesity).15 ,16 Nevertheless, increasing trends of BMI in Chinese adults have been well documented.18 ,20 In two national nutritional surveys undertaken in 1982 and 1992 in China, the prevalence of overweight/obesity (BMI≥25 kg/m2) in participants 20–70 years of age was 10% and 15%, respectively. Between 1992 and 2002, the combined prevalence of overweight and obesity increased from 14.6% to 21.8%.21 Interestingly, the increase in BMI among Chinese adults has slowed down during past decades.2 In this study, we did not observe an increase in BMI and prevalence of obesity defined by the Chinese obesity standards or by WHO criteria (data not shown). Instead, we observed a significant increase in WC, a measure of central obesity between surveys. Our observation of increased WC in Chinese adults, without a concomitant increase in BMI, represents an increasing burden of central obesity in this population. The increase in central obesity indicates an upward trend in body fat percentages in the population who have been previously observed with higher body fat percentages compared with other ethnic people with the same BMI.22 ,23
Both epidemics of overall and central obesity parallel a continuously increasing prevalence of hypertension and T2DM in China.21 Several studies indicate that overall obesity (BMI) is more strongly associated with hypertension, while central obesity (WC) is more strongly associated with T2DM.17 ,24–26 The rationale for these associations is based on the notion that central obesity reflects specific accumulation of visceral adipose tissue. Excess visceral adipose tissue is metabolically unfavourable due to productions of free fatty acids and inflammatory mediators. Overall obesity, on the other hand, represents a greater overall physiological strain and affects vascular and cardiac parameters more significantly. In this study, we observed a significant increase in the prevalence of T2DM regardless of gender or age groups, which was more pronounced than the change in the prevalence of hypertension during the period of 2002–2003 and 2009. We also observed a closer association of central obesity with the prevalence of T2DM than with the prevalence of hypertension. These results support the notion that central obesity in particular is a stronger risk factor for T2DM than for hypertension in Chinese adults. Owing to the cross-sectional design, however, a causal inference could not be made in this study.
The nature of the cross-sectional study design limits our ability to directly evaluate the influence of overall and central obesity as well as the change of their prevalence on the risk of hypertension and T2DM. The differences in several demographic characteristics between the participants of the two surveys indicate the changes in general population over time. However, selection bias could not be excluded. There are several strengths in this study, including the strict process of multistage sampling in adult population in Shanghai, anthropometric measurement according to a standardised protocol and fasting and postprandial blood glucose tests for the participants.
Conclusions
In summary, this study describes the potential association of central obesity with an upward trend of T2DM. Our findings provide useful information about the growing burden of type 2 diabetes and hypertension in Chinese adults and suggest the need for further study in other rapidly changing populations in China.
Acknowledgments
The authors would like to thank Dr Xiao-ou Shu and Dr Hui Cai of Vanderbilt University for their contributions in study design and data analysis. The authors also thank the study participants of the two cross-sectional surveys and the healthcare workers in each community involved.
References
Footnotes
-
Contributors YR and MM contributed to data collection, data analysis and drafted the article. YR, YYL, QDY and LS contributed to data collection and quality control. LJ-M contributed to revision of the article. HZ contributed to data validation and analysis. RL and WHX contributed to study design, statistical analysis and revision of the article. All authors contributed to the interpretation of data and revision of the manuscript. All authors approved the final version.
-
Funding This study was supported by the Key Program of Shanghai Municipal Committee of Science and Technology (04 DZ19502), the Shanghai Medical Development Program (01ZD001) and the Shanghai Municipal Health Bureau (GWDTR201204, 12GWZX0101).
-
Competing interests WHX was supported by a training grant from the Fogarty International Center (D43 TW008313 to X. O. Shu).
-
Patient consent Obtained.
-
Ethics approval The Institutional Review Board at Shanghai Municipal Center of Disease Control and Prevention.
-
Provenance and peer review Not commissioned; externally peer reviewed.
-
Data sharing statement No additional data are available.