Article Text

Abstract
Objectives To update UK studies begun in the early 1990s on the annual prevalence and incidence rates of autism in children; undertaken in response to a March 2012 press release, widely covered by the media, from the US Centre for Disease Control (CDC) reporting that the autism prevalence rate in 2008 in 8-year-old US children was 1 in 88, a 78% increase from a CDC estimate in 2004. This finding suggested a continuation of the dramatic increase in children diagnosed as autistic, which occurred in the 1990s.
Design Population study using the UK General Practice Research Database (GPRD).
Methods Annual autism prevalence rates were estimated for children aged 8 years in 2004–2010 by dividing the number diagnosed as autistic in each or any previous year by the number of children active in the study population that year. We also calculated annual incidence rates for children aged 2–8 years, by dividing the number newly diagnosed in 2004–2010 by the same denominators.
Results Annual prevalence rates for each year were steady at approximately 3.8/1000 boys and 0.8/1000 girls. Annual incidence rates each year were also steady at about 1.2/1000 boys and 0.2/1000 girls.
Conclusions Following a fivefold increase in the annual incidence rates of autism during the 1990s in the UK, the incidence and prevalence rates in 8-year-old children reached a plateau in the early 2000s and remained steady through 2010. Whether prevalence rates have increased from the early 2000s in the USA remains uncertain.
This is an Open Access article distributed in accordance with the Creative Commons Attribution Non Commercial (CC BY-NC 3.0) license, which permits others to distribute, remix, adapt, build upon this work non-commercially, and license their derivative works on different terms, provided the original work is properly cited and the use is non-commercial. See: http://creativecommons.org/licenses/by-nc/3.0/
Statistics from Altmetric.com
Article summary
Strengths and limitations of this study
-
This study is fully representative of the UK general population.
-
The UK General Practice Research Database (GPRD) is a uniquely constructed resource of clinical medical information that has succeeded in providing a reliable continuous standardised account of demographics, medical diagnoses and prescribed medicines over more than 20 years. It is one of the largest sources of primary care data in the world.
-
There may have been unidentified cases (false negatives) in the study population—individual children with autism who were diagnosed elsewhere and not notified to their general practitioners or others who remained undiagnosed.
Background
In March 2012, the US Centre for Disease Control (CDC) issued a press release1 that described the results of a long-term study on the annual prevalence rate of autism in 8-year-old children.2 They reported that 1 of 88 children aged 8 years had been diagnosed as autistic in or prior to 2008. This represented a 78% increase from the estimate in 2004. The press release received wide media attention and prompted us to review and update the information accrued in the UK General Practice Research Database (GPRD) over the past 20 years to derive annual prevalence rate estimates in children in the UK for the years 2004–2010. For direct comparison with the CDC study, we restricted our results to 8-year-old children.
Methods
The GPRD is a unique longitudinal electronic medical database constructed and implemented in 1990 through a combined effort of the Boston Collaborative Drug Surveillance Program (BCDSP), a UK general practitioner (GP) who spent 5 years creating a comprehensive electronic GP office medical record system to replace pre-existing paper records, and a private company, Vamp Health. The GPs who participated used identical software and were trained to enter medical information according to a formal protocol. Some 1000 GPs in over 300 general practices—about 5% of the UK population—were enrolled by 1996. The distribution of practices was designed to be representative of the UK population. Our programmer constructed a unique comprehensive computer file structure that integrated all the information into a unified resource that allowed for rapid access to the full dataset, updated annually. Early validation studies found an 87% correlation between the diagnoses in consultant's letters and those in the GPRD record.3 The high quality, stability and consistency of the recorded information over time has been repeatedly demonstrated in more than 150 publications.4–11
Autism is a developmental disorder manifested early in childhood and characterised by a spectrum of abnormal social and communication skills and unusual behaviour. The condition was infrequently diagnosed prior to 1990. However, an awareness of a gradual increase in the frequency of diagnosed autism was anecdotally noted during the early 1990s. GPs themselves do not make the diagnosis of autism, referring children suspected of having the condition for specialist multidisciplinary assessment, which usually takes place over a period of months. Referral letters to GPRD-participating GPs from consultants and others are scanned and diagnostic information therein coded and recorded in the child’s clinical record. The validity of the autism diagnosis recorded by GPs was confirmed in the earlier phases of this study by review of the extensive specialist referral reports.5 The quality and specificity of the diagnosis of autism in the GPRD have also been validated by an independent research group based on the Diagnostic and Statistical Manual of Mental Disorders, Fourth Edition (DSM-IV) criteria12 ,13; in 318 cases diagnosed with autism or a related condition such as Asperger's syndrome, the researchers, using specialist reports from consultants or multidisciplinary teams in the GP record, were able to confirm the diagnosis for 294 (92.5%).
Annual prevalence rates were calculated by dividing the number of children aged 8 years diagnosed as autistic and recorded in the continuous medical record by the GP at any time, by the number of 8-year-olds active in the database that year. For example, prevalence rates for 2004 were based on the number of children who were aged 8 in 2004 and had been diagnosed as autistic during the eight years 1996–2004. Continuous prevalence rates were similarly estimated for each subsequent calendar year.
We also calculated annual incidence rates by dividing the annual number of children aged 2–8 years newly diagnosed with autism in each year (2004–2010), by the number of children aged 2–8 years active in the practices in that year. Practices enrolled in the GPRD only after 1996 were excluded from the study.
Results
Table 1 shows the annual number of boys aged 8 years who had been diagnosed as autistic in each or any previous year, that is, prevalent cases. The annual number of prevalent cases (a reflection of the cumulative incidence) is remarkably similar over calendar time, as is the number of boys active in the population from 2004–2010. The resulting annual prevalence rate estimates of about 3.8/1000 boys are steady over time. The 95% confidence limits widely overlapped in each year.
Prevalence and incidence rates of boys aged 8 for years 2004–2010
Table 1 also shows the annual number of boys aged 2–8 years diagnosed as autistic for the first time (incident) in each year from 2004–2010. The annual number of incident cases is again remarkably similar over time as is the number of boys active in the practices each year, resulting in annual incidence estimates of about 1.2/1000 boys over the years. The total number of boys was 1190.
The number of girls initially diagnosed as autistic from 2004–2010 was 217. Table 2 provides the annual prevalence and incidence rate estimates over time for girls. Girls were about one-fifth as likely to be diagnosed with autism as boys.
Prevalence and incidence rates of girls aged 8 for years 2004–2010
Discussion
In the present paper we review and update an extraordinary 20-year exploration of the annual rates of autism in young children as recorded in real time and derived from a unique carefully designed medical database in the UK. In a series of formal analyses of the data recorded continuously in the GPRD by some 1000 GPs, we have documented that the cumulative incidence of autism in children born from 1988 to 1995 began to increase and continued to rise from a low level by more than fivefold during these years.14–16 The present study demonstrates that the annual incidence then levelled off and reached a steady state in children born from 1996 to 2001.
In order to compare the UK experience with that reported by the CDC, we restricted our current prevalence study to annual calendar years 2004–2010 in children 8 years of age. These children would have all been born after 1995. Combined, the results in this 20-year population-based UK resource, provide compelling evidence that a major rise in incidence rates of autism, recorded in general practice, occurred in the decade of the 1990s but reached a plateau shortly after 2000 and has remained steady through 2010. This incidence plateau was necessarily accompanied by steady prevalence rates for 8-year-old children.
It is possible that at least a part of the early rise was related to changing and broadening diagnostic criteria to include a spectrum of disorders,17 ,18 as well as social influences,19 including increased general medical and public awareness.20 However, it seems unlikely that these factors materially explain the extraordinary increase in the number of children diagnosed in the 1990s; nor the steady state that followed thereafter in 2004 through 2010. While the MMR vaccine was surely not the cause of the dramatic rise in the 1990s, the actual cause remains in large part a mystery.
For many years the terms incidence and prevalence were applied in medicine primarily to describe acute outbreaks of infectious diseases such as influenza, measles and mumps. Since the mid-1950s, these terms have also been applied to chronic diseases such as diabetes, cancer and more recently autism. Even a superficial consideration of the use of these general terms will reveal the complexity and subtlety of their application in quantitative observational time trend studies in clinical medicine.
The term ‘prevalence’ alone is used widely to describe a general property possessed by an indefinite quantity of a condition, for example, the prevalence of conservative voters is higher in rural compared to urban areas. It is also used in public health as a general frequency or quantity, for example, the prevalence of influenza is higher in winter than in the summer.
In contrast, in formal epidemiological research, reliable quantitative estimates of incidence and prevalence ‘rates’ require accurate identification of the number of newly diagnosed cases in a defined population from which the cases were derived, at a given age during a given time period. Valid comparisons of annual rate estimates over many years are dependent on the stability of the base population and the ascertainment of the condition under study.
In 1996, the CDC conducted a study based on screening and abstraction of records in the five counties of Atlanta, Georgia.21 The prevalence was estimated to be 3.4 per 1000 among children aged 3–10 years. Surveys in California in 1983–1985 and in 1993–1995 based on birth cohorts22 ,23 found that during years 1980–1994 there was a large annual secular increase in the number of cases of autism; these increases were estimated as a prevalence of 44 per 100 000 live-births in the 1980 cohort and 208 in the 1994 cohort.24 A study from Denmark estimated that the prevalence of autism rose from less than 2 per 10 000 prior to 1990 to more than 10 per 10 000 in 2000.25 Taken together these reports and others provided clear evidence that there was a substantial increase in the number of young children diagnosed as autistic in the USA and Europe during the decade of the 1990s.
We could have estimated cumulative incidence and annual prevalence rates for other age ranges, for example, for 3-year-olds or 5-year-olds, from within the GPRD dataset, but there are no other published studies for comparison. Any comparisons of our results with other published studies on autism frequencies do not appear to be valid. There have been many studies investigating the prevalence of autism—in various countries across the world, assessing different ages, durations and varying calendar times.26 Few studies have been able to assess cumulative incidence. Prevalence estimates have varied from 2.8 to 94 for autistic disorder and 1 to 189 for ‘pervasive developmental disorders’.26 Recent studies have tended to show higher prevalence rates.
Cohort effects have been identified27 as well as marked spatial clustering.28 Reported numbers of cases in some studies have been low and have tended to vary (eg, 86 children with autistic spectrum disorder (ASD) at age 11 in the UK Avon study29 and 158 from a screened population of 56 946 children age 9–10 years in the UK Special Need and Autism Project30), with different studies showing widely varying proportions of subgroups of autism. Denominators have sometimes been unclear.
Some studies have based their findings on ASD screening questionnaires, which typically misidentify substantial numbers of children who have other difficulties, but not an ASD.31 Using strict or less demanding diagnostic criteria, even within a single study where design and methodological factors are invariant, can affect prevalence estimates by up to 4.5 times.32 There were some regional variations in rates of recorded autism in the GPRD, possibly reflecting regional variation in diagnostic practice, but rates within areas remained steady overall during the study period. This was a real-life clinically based study, with no attempt to screen the child population for autism. Such screening may contribute to overdiagnosis.31
In February 1998, Wakefield et al33 reported a case series of 12 autistic children with bowel disorders most of whom had recently received the MMR vaccine. The authors suggested that the MMR vaccine may have been causally related to these gastrointestinal conditions. This widely publicised paper led to subsequent studies to evaluate the proposition that the MMR vaccine might be causally related to autism.
In the following year, Taylor et al34 reported results from a study based on birth cohorts from 1979–1992 in the North East Thames (UK) health region. They reviewed special needs records and found that fewer than 10 children/year born from 1979 through 1986 were diagnosed as autistic. Subsequently, the number increased to almost 50 in children born in 1992. They found no correlation between MMR vaccination and the rise in the prevalence of autism.
Shortly thereafter, the BCDSP examined experience accrued in the GPRD since 1990 to estimate annual cumulative incidence rates of autism for birth cohorts from 1988–1993 for boys aged 2–5 years and found that cumulative incidence rates increased some fivefold from an estimate of 6 per 10 000 in boys born in 1988 to 30 per 10 000 in those born in 1993. At the same time MMR vaccination was given to over 90% of young children ruling out an association between the vaccine and the dramatic increase in rates.14
Subsequent studies also found no association between MMR and autism.14 ,24 ,25 ,35 ,36 Lingam et al36 suggested that the previously observed annual increase in prevalence in North-East London may have been levelling off by the mid-1990s.
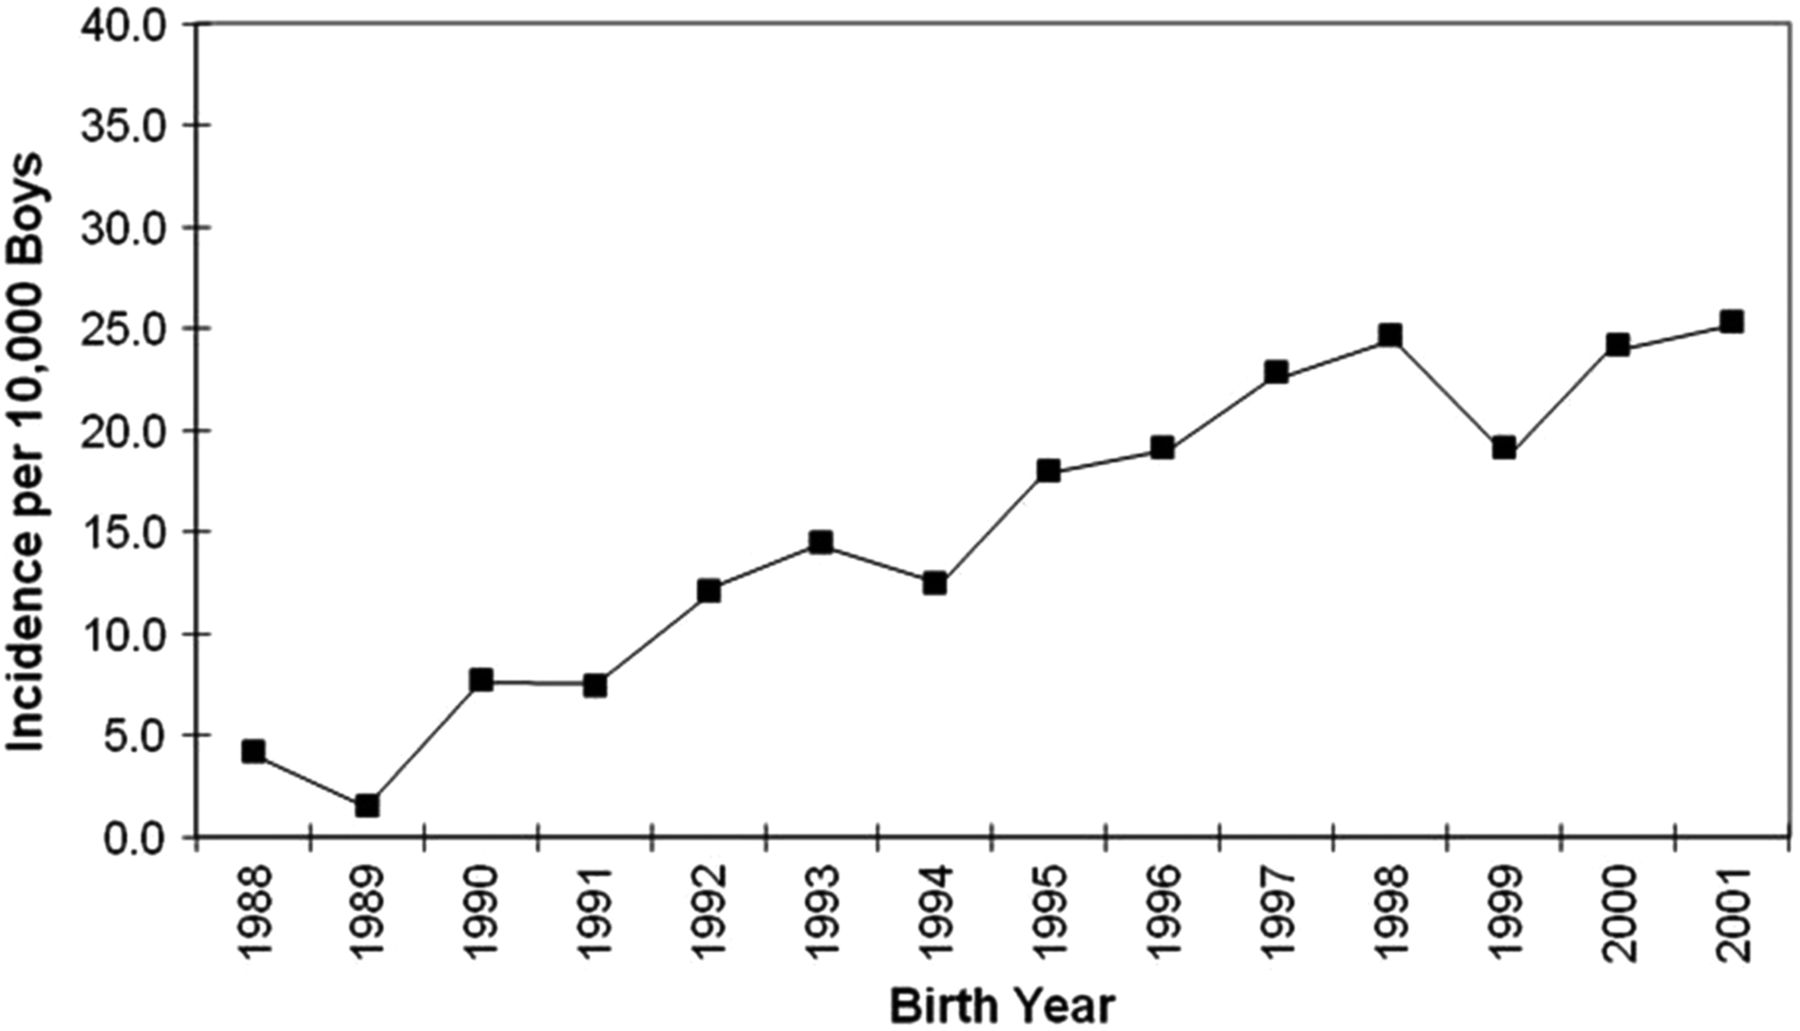
The BCDSP continued to assess time trends by updating the findings recorded in the GPRD for additional birth cohorts. Results of birth cohorts from 1994 to 1995 continued to show a rise in the cumulative incidence of diagnosed autism but results of 1996–1997 indicated that the rise may have reached a plateau.15 Subsequent follow-up demonstrated that rates had in fact plateaued in the 1996 cohort and remained steady for 1996 through the 2001 birth cohort16 (see figure 1). Children born in 2001 would have been diagnosed as autistic at age 2–4 years in 2003–2005.

Three-year cumulative incidence of diagnosed autism among boys aged 2–4 years, in birth cohorts. Adapted from Hagberg and Jick.16 Promotional and commercial use of the material in print, digital or mobile device format is prohibited without the permission from the publisher Lippincott Williams & Wilkins. Please contact journalpermissions@lww.com for further information.
Taken together the published findings conclusively demonstrated that there was a dramatic simultaneous rise in the number of children diagnosed as autistic in the USA, UK and Denmark during the 1990s. In addition, there was highly persuasive evidence that MMR vaccine was not the cause of the rise. Despite firm evidence that a steady state occurred in children born from 1996 through 2001 in the UK, vaccine/autism litigation continued in US courts until 2010.
The initial autism studies5 ,14–16 34–36 were based primarily on birth cohorts usually aged 2–5 years. In that design the number of newly diagnosed (incident) cases is determined separately for each annual birth cohort. In contrast, the nature and interpretation of annual prevalence ‘rates’ of autism, as reported in the present and the recent CDC studies, are far more complex and superficially counterintuitive, particularly where the design objective is to estimate changes in yearly time trends or to compare results with other similarly designed studies.
The CDC chose to estimate annual prevalence rates for children of the same age—8 years—in each of successive calendar years. Annual prevalence estimates apply to children who encompass a large age range, for example, 2–8 years and each of the autism cases may be included as prevalent in multiple years. For example, when examining the period 2004–2010, a child diagnosed at age 2 years in 2004 would be included in the prevalence estimate for each of the next 6 years until the child reached age 9 years and no longer is considered a prevalent case. Children diagnosed at age 6 in 2005 would be included in the prevalence estimates for only 3 years thereafter. Year of age at first diagnosis, including prior to 2004, is thus a critical variable in estimating the annual prevalence rates at age 8 over many years. The full detail that yielded the annual prevalence rates could be reviewed directly for consistency.
The 2012 CDC report2 was a follow-up to studies of 8-year-old children initiated in 2000 and repeated every 2 years thereafter. The results were derived from a network of 6–11 US states depending on the years, and based on school or medical records or both. Early reports estimated annual prevalence rates of 6.7 and 6.6 per 1000 children in 2000 and 2002, respectively. Starting in 2004, prevalence rate estimates rose steadily until 2008 when they reached 11.3 per 1000, a rise of 78% from 2004. The latest prevalence rate estimates varied widely from state to state—from 4.1/1000 in Alabama to 21.2/1000 in Utah.
A detailed commentary on the limitations of the CDC report was published shortly after it was released.37 This commentary raised important questions related to the accuracy and specificity of the combined rate estimates over the years.
There are many similarities between the results found in the USA and UK in the secular epidemiology of autism. Few children were diagnosed as autistic in either country prior to 1990. A continuous simultaneous extraordinary rise in the number of children diagnosed as autistic began in both countries in the early 1990s and lasted for a decade. The distribution of first time diagnosis according to age and gender was the same. These similarities between countries as well as within different locations in each country point to a common aetiology for this extraordinary medical case.
In contrast, there is a large difference in the percentage of children diagnosed as autistic in the two countries. The estimated prevalence rates of autism in the UK population, about 4 per 1000 in 8-year-old boys in 2008, is far lower than 11 per 1000 in 8-year-old boys reported by the CDC from the USA for the same calendar year. This large difference between countries is closely similar to differences in rates reported for children diagnosed and treated for attention deficit hyperactivity disorder in the two countries.38 ,39
The GPRD is a uniquely constructed resource of clinical medical information that has succeeded in providing a reliable continuous standardised accounting of demographics, medical diagnoses and prescribed medicines over more than 20 years. The substance of its construction and implementation is highly complex. Nowhere is this clearer than in the current findings related to the enormously complex secular epidemiology of autism.
In conclusion, the annual prevalence of clinically confirmed autism recorded by UK GPs remained steady for the 7-year period 2004–2010. Whether it has increased in the USA over these years remains uncertain.
References
Supplementary materials
Press release
Press release
Files in this Data Supplement:
Footnotes
-
Acknowledgements The authors would like to acknowledge the excellent work of the general practitioners who have contributed to the UK General Practice Research Database (GPRD).
-
Contributors The GPRD data source was constructed by HJ and DM. HJ and BT contributed to study design, data analysis and writing up of the manuscript. The database access was created by DM. All the authors vouch for the accuracy and completeness of the data and the analyses as presented. They also vouch for the fidelity of the final report.
-
Funding This research received no specific grant from any funding agency in the public, commercial or not-for-profit sectors.
-
Competing interests None.
-
Ethics approval The study protocol was approved by the MHRA's Independent Scientific Advisory Committee (ISAC). All data were anonymised.
-
Provenance and peer review Not commissioned; externally peer reviewed.
-
Data sharing statement No additional data are available.