Article Text

Abstract
Objective To evaluate the prevalence, type and severity of prescribing errors observed between grades of prescriber, ward area, admission or discharge and type of medication prescribed.
Design Ward-based clinical pharmacists prospectively documented prescribing errors at the point of clinically checking admission or discharge prescriptions. Error categories and severities were assigned at the point of data collection, and verified independently by the study team.
Setting Prospective study of nine diverse National Health Service hospitals in North West England, including teaching hospitals, district hospitals and specialist services for paediatrics, women and mental health.
Results Of 4238 prescriptions evaluated, one or more error was observed in 1857 (43.8%) prescriptions, with a total of 3011 errors observed. Of these, 1264 (41.9%) were minor, 1629 (54.1%) were significant, 109 (3.6%) were serious and 9 (0.30%) were potentially life threatening. The majority of errors considered to be potentially lethal (n=9) were dosing errors (n=8), mostly relating to overdose (n=7). The rate of error was not significantly different between newly qualified doctors compared with junior, middle grade or senior doctors. Multivariable analyses revealed the strongest predictor of error was the number of items on a prescription (risk of error increased 14% for each additional item). We observed a high rate of error from medication omission, particularly among patients admitted acutely into hospital. Electronic prescribing systems could potentially have prevented up to a quarter of (but not all) errors.
Conclusions In contrast to other studies, prescriber experience did not impact on overall error rate (although there were qualitative differences in error category). Given that multiple drug therapies are now the norm for many medical conditions, health systems should introduce and retain safeguards which detect and prevent error, in addition to continuing training and education, and migration to electronic prescribing systems.
- EDUCATION & TRAINING (see Medical Education & Training)
This is an open-access article distributed under the terms of the Creative Commons Attribution Non-commercial License, which permits use, distribution, and reproduction in any medium, provided the original work is properly cited, the use is non commercial and is otherwise in compliance with the license. See: http://creativecommons.org/licenses/by-nc/2.0/ and http://creativecommons.org/licenses/by-nc/2.0/legalcode.
Statistics from Altmetric.com
Article summary
Article focus
-
Some studies have reported lower error rates with more senior prescriber grades, and insufficient undergraduate prescriber training as a potential risk for prescribing errors.
-
Prescriptions frequently contain multiple medications, but data about errors on complete prescriptions (all prescribed items on an inpatient chart or discharge prescription), which give a better estimate of numbers of patients at risk of harm, are lacking.
-
We aimed to determine the differences in prescribing error rates between grades of prescriber, ward area, admission or discharge and type of medication prescribed.
Key messages
-
We observed an error rate of 10.9% per prescribed item, with only 56.2% of 4238 complete prescriptions remaining error free.
-
In multivariate analysis, the strongest predictor for prescribing error was the number of medicines on each prescription.
-
We found no overall difference in error rate among different grades of prescriber, and newly qualified doctors were not more likely to make errors than their senior colleagues.
Strengths and limitations of this study
-
This was a large study across nine diverse hospital settings.
-
We determined the rate of errors on complete prescriptions as well as for individually prescribed items, giving a better estimate of the numbers of patients affected by errors.
-
We did not evaluate the impact of electronic prescribing on the prevalence and type of prescribing errors; however, up to a quarter of the errors observed could potentially have been avoided through use of electronic prescribing and medicine administration systems.
Introduction
Prescribing errors are common, with systematic reviews suggesting that as many as 50% of hospital admissions and 7% of medication orders are affected.1 In recent studies, prescribing errors have been found to affect approximately 9–15% of medication orders for hospital inpatients in the UK.2 ,3 Over one-third of 651 patients were found to have a prescribing error occurring at hospital admission in the USA.4 Prescribing errors are also prevalent in primary care, affecting 37% of 9385 prescriptions in the USA,5 and one in eight patients (1 in 20 prescription items) in the UK.6 A study in the Netherlands evaluating medication omission errors in elderly patients admitted to hospital reported adverse consequences in 21% of 100 patients.7
Human error in healthcare may be considered in the context of individuals or health systems.8–10 While personal factors such as forgetfulness, inattention, poor motivation, carelessness, negligence and recklessness are important, a health systems approach more comprehensively addresses recurrent errors and organisation factors and processes which may give rise to that error. The person, the team, the task, the workplace and the institution as a whole are considered,8 which identify weaknesses in the system's defences.8 For example, higher hospital mortality at weekends may be associated with lower numbers of senior staff available outside of the normal working week.11 ,12 Barriers which may prevent medication errors, or prevent errors from reaching the patient, may include electronic prescribing alerts, and prescription review by clinical pharmacists.
Data on factors which may contribute to prescribing errors, for example, differences between grades of prescriber, ward area, admission or discharge and type of medication prescribed are sparse.3 ,13 ,14 Existing data suggest that newly qualified and junior doctors are twice as likely to make prescribing errors than senior doctors, taking into account the larger volume of prescriptions written by junior prescriber grades.3 Provision of sufficient undergraduate training to allow medical students to become safe prescribers when they begin work as newly qualified doctors is widely recognised as an important factor in reducing prescribing errors.13 ,15–17 Teaching in the UK medical schools has changed considerably over the last decade, with the General Medical Council stipulating that medical students must be adequately prepared to prescribe drugs and manage risk at the point of graduation.18 ,19
While previous studies have evaluated error for individual medications, few studies have systematically evaluated complete prescriptions (all items included on a single inpatient prescription chart or discharge prescription at the time of clinical pharmacist check) to evaluate factors associated with prescribing error.1–3 This is important as it gives a more accurate estimate of the numbers of patients who are potentially put at risk of harm by prescribing errors. We undertook a prospective survey of prescribing errors in nine diverse National Health Service (NHS) hospitals in the North West of England, aiming to examine the differences in prescribing error rates between grades of prescriber, ward area, admission or discharge, hospitals and the type and number of medicines prescribed. In order to further evaluate the role of undergraduate training, we also tested for a relationship between occurrence of error and medical school training of prescribers. As approximately 30% of the prescribers were trained at the local institution, the University of Liverpool, whether medical training was undertaken at this institution was included in the analysis. Univariate analysis and multivariate logistic regression was used to evaluate factors associated with prescribing errors.
Methods
Setting
A total of nine NHS hospitals from the Merseyside and Cheshire region took part in the audit. These comprised large teaching hospitals, general hospitals, specialist centres for paediatrics, women's health and mental health (table 1). One hospital was using complete electronic prescribing systems (inpatient prescribing, medication ordering, discharge prescriptions) on some wards at the time of the audit. Eight of the hospitals were using paper prescription charts for inpatients and either handwritten or transcribed electronically generated discharge prescriptions. In this setting, ward-based clinical pharmacists check inpatient prescriptions at, or soon after patient admission, when medicines reconciliation is undertaken. Inpatient prescription charts are then checked at least daily by the pharmacist. Discharge prescriptions are checked and authorised by a clinical pharmacist prior to supply of medication. Pharmacists may amend or clarify some aspects of prescribing, or discuss with the clinical team any recommendations or safety issues at these points of care. Clinical pharmacists may also participate in ward rounds and multidisciplinary team meetings, where prescribing may be discussed with clinicians, clarified or amended.
Types of hospitals contributing prescription data
Data collection
As this was an audit of unlinked anonymised prescriptions, Ethics approval was not required in accordance with local guidance. We aimed to capture data from all seven hospital trusts in the region. Two additional hospitals adjacent to and linked with healthcare provision in the Merseyside region were also audited. The number of prescriptions audited was empirically determined in order to generate a sample size equivalent to a large study recently undertaken in the UK. In order to audit practice across the region, each hospital was asked to audit a minimum of 400 prescriptions.
We adopted the following definition of prescribing errors for the study, which excludes adherence to local prescribing policy and guidelines ‘A clinically meaningful prescribing error occurs when, as a result of a prescribing decision or prescription writing process, there is an unintentional significant: (1) reduction in the probability of treatment being timely and effective or (2) increase in the risk of harm when compared with generally accepted practice’.20 A standard questionnaire collected data on error category and severity (based on EQUIP error classifications). The EQUIP study was a large prospective survey of prescribing errors affecting hospital inpatients in the UK, and the error classifications were therefore considered relevant to our setting. Nominated ward-based clinical pharmacists prospectively documented prescribing errors at the point of checking inpatient or discharge prescriptions, during normal pharmacy working hours, therefore each audit form was a point prevalence of prescribing errors at the time of pharmacist clinical check. Acute admission was defined as the first 24 h in hospital. For all prescription sheets generated in acute admission settings, a separate audit form was completed (to allow for emergency prescribing in the absence of a full drug history without this being recorded as an error) and we sought to record only unintended medication omissions (eg, following medicines reconciliation with general practices or primary healthcare databases). Hospitals were advised to complete the study on different days of the week throughout the period of the audit, in order to capture an even spread of days. For example data collection would occur weekly, on Monday in week one, Tuesday in week two, Wednesday in week three, in order to minimise double auditing of the same patient on admission to hospital and subsequent admission to a ward. Therefore, if patients were audited twice, an interval of at least 1 week would separate each audit form, unless their acute admission/inpatient/discharge prescriptions were audited on the same day. If items on prescriptions had been previously screened, they would be counted again in any subsequent auditing, though there would be a 1-week interval since previous auditing, or the patient would be a different stage of hospital admission. All types of medication order were audited, including intravenous fluids, when required and once only medication.
Prescriber category
Pharmacists were required to indicate the category of prescribers on data collection forms. For this analysis, prescribers were categorised as follows: newly qualified (foundation year 1, house officers), junior (foundation year 2, specialist or ‘core’ training years 1 and 2), mid-grade (specialist registrars, training fellows), senior (consultant), non-medical (nurse or pharmacist prescribers), other (eg, locum doctors for whom grade was unclear) and unknown (no information concerning prescriber recorded).
Grading of prescribing errors
We modified EQUIP study criteria3 for error categorisation and severity classification by adding or clarifying severity criteria for all error categories, and by grouping errors into 10 distinct areas according to stage of the prescribing process (see below and table 2). ‘Exclusion’ and ‘inclusion’ of errors into EQUIP study error types were defined, in order to differentiate categories with potential overlap. Severity ratings were further defined and assigned to each error category based on modified EQUIP study criteria and taking into account the perceptions of the original pharmacist gradings. Severity ratings related to the potential severity, had the error been allowed to progress through to the patient, as the majority of errors were corrected prior to the point of administration. In order to limit misclassification of errors, the original 29 EQUIP categories were batched into 10 different types of error groups as follows: (1) Dosing errors, (2) Writing errors, (3) Allergy status errors, (4) Duration of treatment wrong/not specified, (5) Drug interactions, (6) Omission of medication, (7) Excessive/unnecessary prescribing, (8) Clinical safety errors, (9) Lack of clear directions for administration and (10) a new error category (Miscellaneous) was added (table 2). The modification and definition of error categories and severities were undertaken by two members of the study team (KS and SK) and agreed by a third (TK).
Application of error categories and severity ratings for the Mersey Deanery Prescribing Audit
Despite using a standard set of definitions, we noted discrepancies across various hospitals in both error categorisation and severity rating. In particular, there was a tendency to over-report errors and to overestimate their potential severity. This was confirmed by a post hoc inter-rater agreement analysis. A set of six sample prescriptions was generated. A list of 14 sample errors was decided by the study team, including study error type and severity, according to the criteria in table 2 utilised for analysis of the main study. The errors selected occurred frequently in the main study, and covered a broad range of error categories and severities. Six pharmacists from each participating hospital were asked to each screen the six prescription scenarios containing the 14 errors and to record any observed errors, allocating error types and severities. The exact agreement percentages between category classification, severity classification and both combined were computed to measure the absolute concordances between pharmacist scores against the gold standard assessment.
In order to limit interobserver bias, all grading and severity of errors identified in the main study were independently reassessed by two members of the study team (KS and SK), with discordant assessments collectively discussed with a third (TK) in order to agree a final categorisation for error type and severity. For severity ratings, the summary of product characteristics for relevant medication was consulted, in order to determine potential implications of different degrees of overdose, underdose, of drug interactions and also to confirm clinical contra-indications.
Statistical analyses
Data were analysed at the prescription level using complete case data. The prevalence and severity of errors observed were tabulated using percentage frequencies. A Forest plot was produced to present the error prevalence rate and 95% CI for each hospital and grade of the prescriber. For the formal statistical analysis, when there was more than one error on a prescription, only the most severe error was included. This approach was used to ensure that the errors included in the analysis were independent. In this study, we assessed hospital, prescriber grade (newly qualified, junior, mid-grade, senior, non-medical, other), ward area (medical, surgical, A&E, mental health, critical care), number of prescribed medicines, an indicator to denote whether the prescription was prescribed on admission or on discharge and an indicator to denote whether the prescriber was Liverpool trained or not as potential risk factors. Univariate statistical analyses were performed using a χ2 test except for continuous data, which were analysed using the Mann-Whitney U test. A multivariate logistic regression model for a prescription error was fitted to the data. Results are given in terms of an OR and associated 95% CI. All risk factors that were statistically significant (p<0.1) in the univariate analysis were considered for inclusion in the multivariate model with the exception of ward area as a number of hospitals only reported a single specialty type.
All statistical analyses were carried out using the statistical software package SPSS (V.20) using a two-sided significance level of 0.05 (5%) throughout.
Results
Error classification
During the post hoc inter-rater agreement analysis, approximately 75% of error categories were correctly identified by pharmacists when compared with the standards. Only 47% of severity ratings were concordant with the standards, and 40% of pharmacists rated both error category and severity in concordance with the standards.
Reassessment of errors by the study team resulted in exclusion of a total of 143 errors which were not considered true errors of the process of prescribing. The error category was regraded for 434 errors, and severity was regraded for 724 errors, which was predominantly a down-grading.
Descriptive data and severity of errors
A total of 4238 prescriptions were evaluated; of these, 1857 (43.8%) prescriptions contained at least one error (table 3). The overall prevalence of prescribing errors (number of prescriptions with one or more error/prescriptions evaluated) ranged from 20% to 60% across the nine hospitals (figure 1). The rate of errors per prescribed item was 10.9%.
Summary data showing prevalence and severity of errors observed
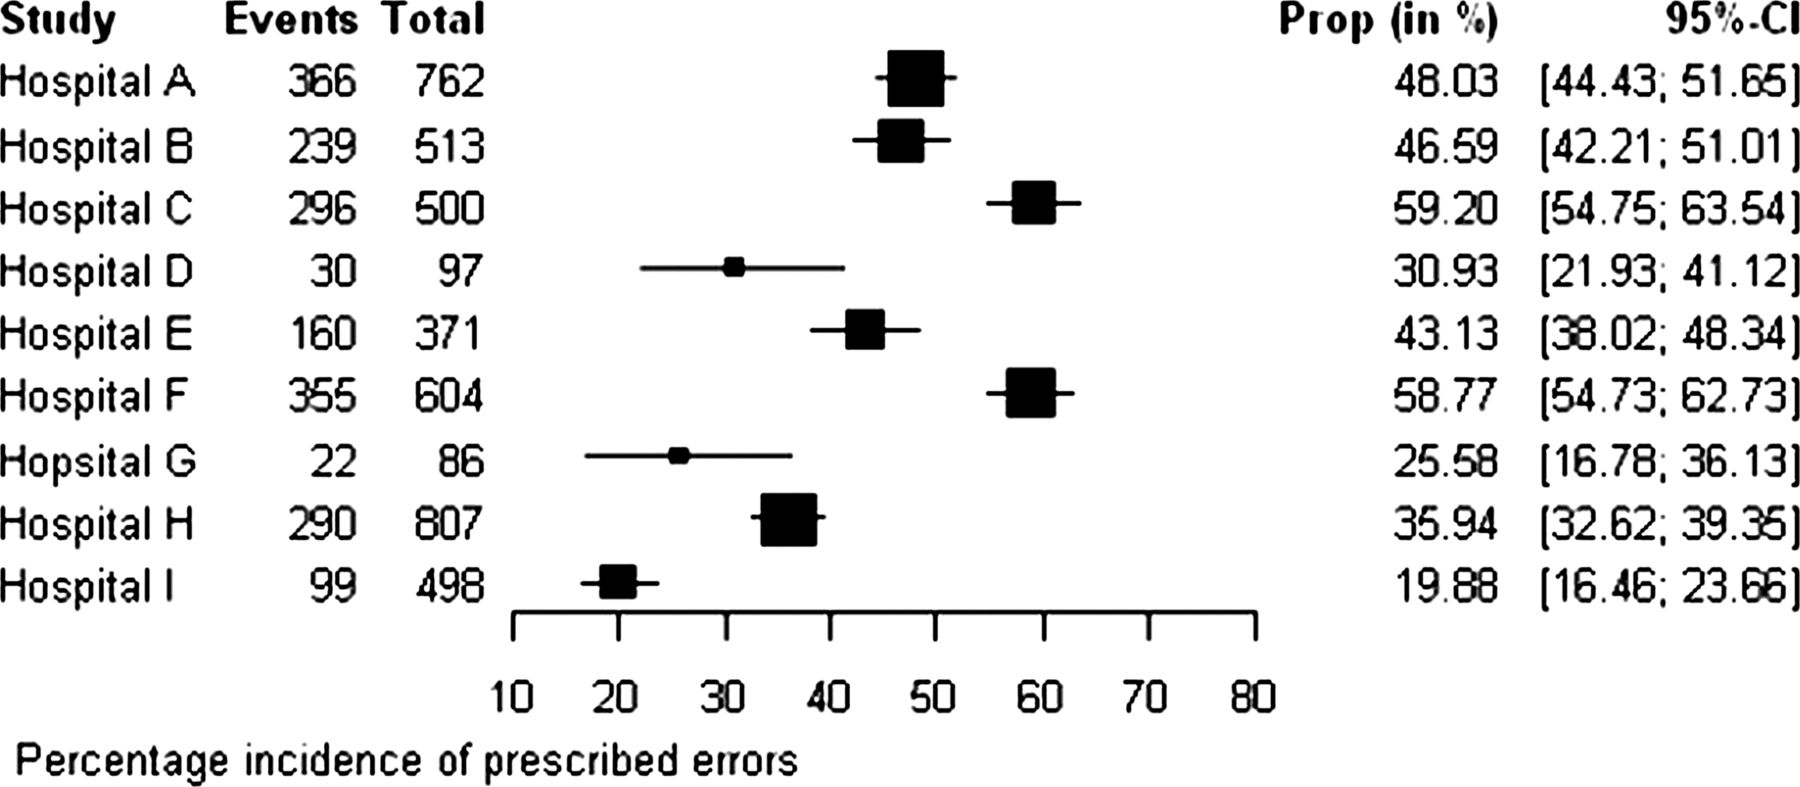
Forest plot showing prescribing error rates in nine hospitals across North West England.
A total of 3011 individual errors were observed within the 1857 prescriptions containing an error. Of these 3011 errors, 1264 (41.9%) were minor, 1629 (54.1%) were significant, 109 (3.6%) were serious and nine (0.30%) were potentially life threatening (table 3). Details of all potentially life-threatening errors are listed in table 4 and mainly comprised dosing errors (n=8), particularly overdose (n=7), with one incidence of underdose. A further error considered to be potentially lethal related to prescription of a medicine to which the patient had previously had a serious allergic reaction.
Summary of the errors observed which were considered to be potentially lethal
The proportion of errors categorised with severity as significant or higher by prescriber grade were as follows: all prescribers 58.0%, newly qualified 51.2%, junior 60.8%, mid grade 66.4%, senior 57.6% (χ2trend p<0.001 for univariate analysis, although this association disappeared when corrected for other potential confounders; table 3).
Fewer errors were observed on discharge prescriptions than on prescriptions written on admission. More errors were observed in prescriptions containing antibiotics, insulin, warfarin and oxygen, although this does not take into account the number of items on each prescription. Whether doctors were Liverpool trained or not did not affect the number of errors observed (table 3).
Differences in error prevalence and error types were observed in individual participating hospitals. The lowest rates of errors were reported for the paediatrics specialty hospital, with 0.07 errors observed per prescribed item, and 0.26 errors observed per prescription. However, in multivariate analysis, there was no significant reduction in error risk and it is likely that the effect could be due to lower number of items per prescription (mean 3.5, vs pooled data: 6.3). The most common error types were dosing errors (30%) and medication omission (23.1%).
Significantly lower risk of errors was observed in the hospital providing specialist services for women (p=0.04, table 5) in multivariate analysis. One of the lowest error rates per prescription was observed (0.28), although the error rate per prescribed item (0.11) was equal to that of the pooled data. The most common error type observed was excessive/unnecessary prescribing (50%). No errors of medication omission were observed. This hospital also had a low number of items per prescription (2.4), and was using electronic prescribing systems on some wards.
Multivariate logistic regression analysis for predicting error rates in prescriptions
Error types
The most frequent error types for all prescribers were medication omission, accounting for 26.9%, writing errors accounting for (20.7%) and dosing errors accounting for (20.6%) of all errors recorded. There was little difference in the variability of error types across different prescriber grades (figure 2).⇓

Categories of prescribing errors made by different grades of prescriber.

Forest plot showing prescribing error rates made by different prescriber grades.
Risk factor analysis
Results of the univariate analysis are shown in table 6. Missing data limited inclusion of all reported prescriptions in risk factor analysis, notably as one acute hospital failed to return data on number of items on each prescription. All factors considered appeared to show a significant difference except for whether doctors had trained in Liverpool, which made no significant difference (p=0.91) to whether an error occurred on the prescription. Multivariate risk factor analysis showed that the likelihood of an error increased for every additional item included on the prescription (OR 1.14, 95% CI 1.12 to 1.17, p<0.001; table 6). Therefore, for each additional item on the prescription, the risk of an error occurring increased by about 14%. There was also a trend towards errors being more likely to occur on admission prescriptions than on discharge prescriptions, with an OR of 1.16 (95% CI 0.70 to 1.92, p=0.58), although this difference did not reach statistical significance (table 5). No significant differences were found in error rates between different prescriber grades, when compared with newly qualified doctors (figures 2 and 3) in multivariate analyses.
Univariate statistics showing the significance of explanatory variables in predicting error rates in prescriptions
Discussion
In this large study, only 56.2% of 4238 prescriptions written had no reported errors. Of the errors recorded, 41.9% were minor, 54.1% significant, 3.6% serious and 0.3% potentially life threatening. It is important to note that severity ratings relate to the potential severity had the error been allowed to progress through to the patient—in fact the majority of errors were corrected prior to the point of administration. In multivariate analysis, the strongest predictor for prescribing error was the number of medicines on each prescription, with risk for prescribing error increasing by 14% for every additional medication item prescribed. Where data were available, prescriptions contained an average of 6.3 medication items, although this varied from 2.4 to 7.5 items according to medical specialty surveyed. Uncorrected analyses suggested that errors were frequent in prescriptions containing insulin (15.5%), antibiotics (18%), warfarin (9.2%) and oxygen (5.6%), although these patients were very likely to have been receiving multiple medications. Error rates were highest among specialties which prescribed a broad range of medications (eg, acute medicine, compared with elective surgery), and also differed between different hospital Trusts, with hospitals specialising in paediatrics, maternal health and mental health exhibiting the lowest error rates. However, when corrected for number of medications, these differences did not remain significant, with the exception of maternal health.
The most frequent error encountered was unintended medication omission following acute hospital admission (0.97 errors/prescription written, vs 0.53 for discharge medications).
When adjusted in multivariable analyses (table 5) there was no statistically significant difference in error rates between admission and discharge. We found no overall difference in error rate among different grades of prescriber, and newly qualified doctors were not more likely to make errors than their senior colleagues. Although numbers were relatively small, we observed no difference in error rate among newly qualified doctors by undergraduate training, and doctors trained in Liverpool were neither more nor less likely to commit medication errors. The categories and severity of errors made by different prescriber grades were broadly similar (table 3; figure 2); however, some differences were observed. For example, writing errors were more frequently observed with newly qualified doctors, medication omission was more frequently observed with junior and mid-grade doctors, and dosing errors were more frequently observed with mid-grade doctors.
These results are consistent with previously published studies. Both the EQUIP and PRACtICe Studies3 ,6 reported error rates of approximately 1 in 10 medications prescribed (we observed a rate of 10.9%). Given the high number of medications prescribed (mean of 6.3 items/prescription) nearly half of all prescriptions contained at least one error.
A systematic review found prescribing errors to be more common in adults than in children.1 A study in Spain comparing paediatric wards with obstetrics found that paediatric patients had a fourfold higher risk of serious errors than the maternity population (2.3% vs 14.3%), which were mainly related to drug dosing.21 We observed a low error rate for the paediatrics specialty hospital, although this was likely due to a low number of prescribed items. Dosing errors were the most common error type. Another study reported that prescribing errors were more common in primary care among men compared with women.6 We observed a significantly lower risk for errors in specialist services for women.
In the EQUIP study, multivariate analysis showed that all grades of doctors were more likely to write a prescription containing an error than consultants.3 A retrospective study which evaluated errors on discharge prescriptions found no significant difference in error rates between prescriber grades, although no senior (consultant) level prescribers were included.14 In primary care, the grade of general practitioner was not associated with prescribing errors.6 We observed no significant difference in prescribing error rates between prescriber grades, when compared with newly qualified prescribers. EQUIP also reported that medication orders issued at acute admission were 70% more likely to be associated with a prescribing error.3 Another study found lower error rates on discharge prescription items than was observed with general inpatient prescribing, due to a lower rate of medication omission, however these factors were not corrected for the number of items on each prescription.2 We observed a trend towards errors being more likely to occur on admission prescriptions than on discharge prescriptions, with an OR of 1.16, although this did not reach significance in multivariate analysis.
In multivariate analysis, the strongest predictor for prescribing error was the number of medicines on each prescription, with risk for prescribing error increasing by 14% for every additional medication item prescribed. Complex polypharmacy is becoming increasingly common, with patients potentially requiring management for multiple chronic conditions simultaneously. In these patients, vigilance for prescribing errors and pharmacist review is of particular importance.
Our study was limited by missing data (one acute hospital failed to return data on number of items on each prescription), and although pharmacists had received some basic training in completing the evaluations, post hoc analyses suggested significant variability between pharmacists’ classification of errors, and especially in assignment of severity classification. Two of us independently revised each prescribing error and noted a tendency to overestimate the severity of errors, and (in keeping with EQUIP criteria) included in our evaluations an assessment of whether or not a wrong dose was likely to have been actually administered based on tablet burden. We also refined EQUIP criteria to assign severity ratings to error categories where these had previously not been provided. Finally, in order to limit the impact of error misclassification on study findings, the original 29 error categories were batched into 10 different types of error groups relating to key components of prescribing. Since our data collection forms did not allow us to evaluate errors which had been missed, it is possible that our observed error rates may represent an underestimate of the true burden of prescribing error.
Medication omission was the most prevalent error, representing 26.9% of all errors observed, which is consistent with previous reports.2 ,14 Prescribing during acute admission in the absence of a full medication history may sometimes be unavoidable, and does not necessarily constitute an error. For this reason, we discriminated between ‘emergency’ prescribing, and errors where a more complete or accurate medication history would have prevented omission of prescribed medications. Although we sought to capture only unintended medication omission, it is possible that there might still have been cases where the omission was intentional (eg, suspension of diuretics in a patient who was hypotensive or dehydrated on admission) but this intent had been missed by the pharmacist collecting the data. A sensitivity analysis showed that if all errors of medication omission either on discharge or admission were excluded, the number of errors totals 2249 (0.53 per prescription written); with 1471 (34.7%) prescriptions containing at least one error, which represents a significant reduction in overall prescribing error rate. A core role for clinical ward based pharmacists is medicines reconciliation for admitted patients. This involves detailed medication history taking, recording of full medication list in the patient's case notes, and discussion with the clinical team to ensure that all regular medicines are prescribed throughout the admission, if appropriate. Similarly, on discharge, pharmacists ensure that necessary regular medicines are continued, and that any medicines newly started during the admission are prescribed for discharge as appropriate. The majority of the omission errors reported will have been rectified during admission or prior to discharge, as a result of the pharmacist clinical check. This highlights the importance of medicines reconciliation as soon as practicable at hospital admission, in order to minimise the possibility of missed doses of essential medicines. The role of pharmacists in acute admission settings may therefore be of particular benefit.
EQUIP error categories which could potentially be eliminated by the introduction of electronic prescribing (strength/dose missing, product/formulation not specified, no signature, start date incorrect/missing, incorrect route, intravenous instructions incorrect/missing) accounted for 357 (11.9%) of the 3011 errors observed. A further 376 (12.5%) errors could be reduced by electronic prescribing, via alerts, cautions and required fields at the patient entry/prescribing stage, although many of these can be over-ridden by the prescriber.22 These include: administration times missing/incorrect, duplication, CD requirements incorrect/missing. The extent to which electronic prescribing can eliminate particular error types depends on the individual systems used. Importantly, while electronic prescribing systems could potentially have prevented up to a quarter of errors, these systems are best utilised alongside rather than instead of existing safeguards. We did not formally evaluate differences in error rates between electronic prescribing and paper-based prescribing systems. Although one hospital (Hospital G) was utilising complete electronic prescribing systems on some wards at the time of the study, and many of the other hospitals were using electronically generated discharge summaries, we failed to observe any clear association with error rate, mainly because of the large variability in case mix which impacted directly on the number of items/prescription. In contrast, EQUIP reported that electronic prescriptions were 12% less likely to be associated with a prescribing error than handwritten prescriptions.3 Although electronic discharge summaries may reduce error due to legibility, they do not eliminate the transcription step from inpatient charts. One study which analysed 1808 handwritten and electronic discharge summaries found no difference in the number or types of errors observed.14 It is also worth noting that electronic systems, while clearly offering an advantage over conventional medicines management and prescribing systems, have themselves been associated with new patterns of error. Studies in the UK and Australia found a significant reduction in prescribing errors detected after introduction of electronic prescribing systems, but also identified errors specific to the electronic prescribing system used, for example, incorrect product selected from drop-down menu, or incorrect dosing frequency selected.23–25 These electronic systems will doubtlessly continue to improve through refinement.22 ,26
The Erice Medication Errors Research Group recommendations for reducing prescribing errors, includes training and assessment of prescribers, ongoing monitoring, awareness and communication.13 Health systems which may impact on likelihood of error occurring include European harmonisation of prescribing, introduction of integrated prescription forms, use of IT systems such as electronic prescribing, and standardisation, evaluation and certification of such systems. Involvement of clinical pharmacists at all points of the medication process is also recommended.13 The latter is important since all the hospital Trusts in our survey had evolved systems to safeguard patients from prescribing error (regardless of the adoption of electronic prescribing), and this involved use of ward-based pharmacists and dispensary staff to perform routine checks on all prescriptions issued3 ,9 ,21 ,27 This likely represents the ‘last line of defence’ against prescribing error, and has greatest utility when deployed in clinical areas associated with highest risk, for example patients with complex polypharmacy, and hospital admission settings. One fundamental role of clinical pharmacists during acute admission is medicines reconciliation, where a patient's full medication history is determined and recorded using all available sources of information. We found that prescribing errors in secondary care are prevalent, regardless of prescriber grade. Our findings therefore suggest that removing this safeguard (eg, through service reconfiguration or in an effort to reduce costs) could potentially lead to higher numbers of medication errors actually reaching the patient.
Acknowledgments
We gratefully acknowledge the contributions of pharmacists who participated in this study. We thank Professor David Graham, Postgraduate Medical Dean, Mersey Deanery, for supporting the project. We thank the National Institute of Health Research (NIHR Department of Health) and the Northwest Development Agency (NWDA) for infrastructural and project support.
References
Footnotes
-
Contributors TK and SHK developed the study concept; ML, SJ, AMc, AR, JS, AG, CC and BT co-ordinated data collection; KS and SHK analysed the data; JJK undertook the main statistical analysis with tabulations produced by KS. KS and SHK prepared the manuscript. JJK was involved in substantial revisions of the manuscript. TK, ML, SJ, AMc, AR, JS, AG, CC and BT reviewed the manuscript; SHK is the guarantor for the project. All authors, external and internal, had full access to all of the data (including statistical reports and tables) in the study and can take responsibility for the integrity of the data and the accuracy of the data analysis.
-
Funding This work was funded through an unrestricted educational grant from Mersey Deanery, although design, execution, analysis and reporting were carried out independently by the study team.
-
Competing interests All authors have completed the Unified Competing Interest form and declare that (1) SK has received research funding for website development from Merck, Bristol Myers Squibb, Gilead, ViiV, Tibotec, and Abbott, and honoraria, travel support for conference attendance from Roche, Tibotec, and Viiv in the past 3 years. All other authors have nothing to declare.
-
Provenance and peer review Not commissioned; externally peer reviewed.
-
Data sharing statement All requests for data sharing (raw data) to Professor SHK (khoo@liv.ac.uk)