Article Text

Abstract
Objectives The aim of this study was to investigate potential statistical relationships between black tea consumption and key health indicators in the world. The research question is: Does tea consumption is correlated with one or more epidemiological indicators?
Design Ecological study using a systematic data-mining approach in which the unit of the analysis is a population of one country.
Setting Six variables, black tea consumption data and prevalence data of respiratory diseases, infectious diseases, cancer, cardiovascular diseases and diabetes, have been studied at a global level.
Participants Data from 50 participating countries in the World Health Survey were investigated.
Primary and secondary outcomes measures Level of statistical relationships between variables.
Results Principal component analysis established a very high contribution of the black tea consumption parameter on the third axis (81%). The correlation circle confirmed that the ‘black tea’ vector was negatively correlated with the diabetes vector and was not correlated with any of the other four health indicators. A linear correlation model then confirmed a significant statistical correlation between high black tea consumption and low diabetes prevalence.
Conclusions This innovative study establishes a linear statistical correlation between high black tea consumption and low diabetes prevalence in the world. These results are consistent with biological and physiological studies conducted on the effect of black tea on diabetes and confirm the results of a previous ecological study in Europe. Further epidemiological research and randomised studies are necessary to investigate the causality.
- Diabetes & Endocrinology
- Nutrition & Dietetics
- Epidemiology
This is an open-access article distributed under the terms of the Creative Commons Attribution Non-commercial License, which permits use, distribution, and reproduction in any medium, provided the original work is properly cited, the use is non commercial and is otherwise in compliance with the license. See: http://creativecommons.org/licenses/by-nc/2.0/ and http://creativecommons.org/licenses/by-nc/2.0/legalcode.
Statistics from Altmetric.com
Article summary
Article focus
-
This study investigates potential statistical relationships between black tea (BT) consumption and a selection of key health indicators in 50 countries.
Key messages
-
A significant linear correlation was established between high BT consumption and low diabetes prevalence.
-
These results are consistent with biological, physiological and ecological studies conducted on the potential effect of BT on diabetes and obesity.
-
These results should support further causality research regarding the health benefits of BT consumption on type 2 diabetes prevalence in the world.
Strengths and limitations of this study
-
These original study results are consistent with previous biological, physiological and ecological studies conducted on the potential effect of BT on diabetes and obesity. We believe that this multidimensional approach provides valuable additional scientific information at the global level, as our findings, establishing a strong correlation between a high BT consumption and low diabetes prevalence, can be considered to provide a contribution to existing studies conducted on tea consumption, diabetes and obesity.
-
Diabetes prevalence data were obtained from the World Health Survey implemented by the WHO, which constitutes an official source of key morbidity indicators around the world. However, the quality of data collection can be expected to be heterogeneous around the world and diabetes diagnostic criteria can vary from country to country.
-
Another important concern is the interpretation of the established statistical relationship between BT consumption and diabetes prevalence. The numerous factors contributing to the growth of diabetes and obesity throughout the world confirm that ‘correlation does not imply causality’ and that a significant linear correlation between BT consumption and diabetes prevalence does not imply that low-BT consumption could cause diabetes. A correlation can only indicate a potential direct or indirect cause, which then needs to be further investigated.
-
A frequent criticism of the use of data mining is based on the confusion between data mining and data dredging techniques. While a data mining approach is based on searching for combinations of variables that might show potential correlations, data dredging can generate misleading results. When a number of hypotheses are tested, it is expected that some will falsely appear to be statistically significant, since every database can contain potential random correlations. A robust data mining approach must therefore always be based on a clear research strategy and a limited number of relevant meaningful assumptions.
-
A classical criticism of this approach is the ‘ecological fallacy’, corresponding to a logical fallacy in interpretation of the observed correlations at the population level, assuming that they can be applied at the individual level. Our study on BT does not comprise any potential logical fallacy, as it was not used as the basis for any individual assumptions.
Background
Various study designs have been used to assess the potential benefits of tea. As tea is the most widely used ancient hot beverage in the world, the simple act of putting tea leaves into hot water has provided ancient societies with a tasty beverage associated with the observation of certain medicinal benefits. Two principal varieties of the species are used: the small-leaved Chinese variety (Camellia sinensis sinensis), also used for green tea and white tea, and the large-leaved Assamese variety (Camellia sinensis assamica), which has been traditionally used only for black tea (BT). Ancient Chinese civilisations realised that by using a special fermentation process, tea leaves would become darker allowing them to be stored for longer periods of time. During this fermentation process, in which green tea oxidises to form BT, caffeine tends to remain constant, while the types of flavonoids present in the tea differ. Green tea contains simple flavonoids called catechins, while BT contains complex flavonoids called theaflavins and thearubigins, which could be the chemical entities responsible for a number of potential health benefits. These tea types were called BT because of the change in colour of the leaves as a result of this fermentation process. Most recent studies use multidisciplinary approaches including epidemiology, field studies and laboratory research in animal models, mostly for respiratory diseases, infectious diseases, heart diseases, various types of cancers and diabetes, as well as in vitro experiments.1–9 In respiratory diseases, several tea components have been established to be effective in airway diseases. Tea catechin polyphenols seems to be effective to improve inflammation of obliterative airway disease,10 protect against oxidative damage and apoptosis in human bronchial epithelial cells induced by tobacco or attenuate oxidative responses to intermittent hypoxia (Burckardt, 2008). In infectious diseases, herbal products have gained considerable interest among pharmaceutical companies and consumers due to the minimal perceived side effects associated with these products. Several antimicrobial activities have been attributed to tea flavonoids. Catechins appear to have virucidal and virustatic actions11 and appear to exert a protective activity against Vibrio cholerae.12 However, research into the potential beneficial effects of tea appears to be most active in the field of cardiovascular diseases, in view of the number publications in this field. Most of these publications tend to confirm that tea catechins would exert cardioprotective effects via various mechanisms including reversal of endothelial dysfunctions, reduction of inflammatory biomarkers, and antioxidant, antiplatelet and antiproliferative effects.13 Moreover, dietary consumption of tea catechins would have beneficial effects on blood pressure and lipid parameters.14 Similarly, a number of studies have focused on the potential effects of tea in cancer. Biochemical and biological studies, prospective cohort studies and double-blind randomised clinical prevention trials tend to show convergent results for the beneficial preventive effects of tea components in various cancers such as hepatocellular carcinoma, skin, prostate, lung or colorectal cancer.15 Antidiabetes properties of BT have been suggested by several very specific studies, such as a change in pancreatic function in streptozotocin-induced glucose-intolerant rats,16 ,17 but also in some human studies investigating other hot beverages.18–21 The relatively recent interest in BT may be explained by the fact that BT is historically the type of tea most widely consumed in Western countries, probably due to its good storage properties, promoting active trade with tea-producing countries in Asia. Although there has recently been a renewed interest in green tea in industrialised countries, BT represents over 90% of all tea sold in the West. Despite the number of publications investigating the effects of tea components and green tea in particular, large-scale clinical dose-effect studies are still lacking and it is difficult to interpret the clinical significance of results derived from some biological studies. Considerably fewer studies have been conducted specifically on BT, mostly investigating its antioxidant properties,22 ,23 and cardiovascular effects.24 ,25 It could therefore be interesting to investigate some key dietary habits in relation to lifestyle and health effects at a global level, in view of the perceived positive health effects of BT, which have been described for centuries.26 ,27 Because of the complexity of implementing international prospective studies and the difficulty of conducting meta-analyses on a large number of heterogeneous local studies, potential correlations between BT consumption and epidemiological data around the world could be investigated by using advanced exploratory statistical methods. The objective of this original research was to investigate potential statistical relationships between BT consumption and the following five key health indicators: respiratory diseases, infectious diseases, cancer, cardiovascular diseases and diabetes.
Material and method
Data sources
BT consumption data were derived from a specific international trade survey compiling sales data conducted in 2009 by Euromonitor International, an independent agency specialised in market research.28 Consumption data are derived from BT international trading registries, used by BT importers to adapt international orders to local sales. Yearly consumption data expressed in kilograms per capita were available for the following 50 countries: Argentina, Australia, Austria, Belgium, Brazil, Bulgaria, Canada, Chile, China, Colombia, Czech Republic, Denmark, Egypt, Finland, France, Germany, Greece, Hungary, India, Indonesia, Ireland, Israel, Italy, Japan, Malaysia, Mexico, Morocco, the Netherlands, New Zealand, Norway, Philippines, Poland, Portugal, Romania, Russia, Saudi Arabia, Singapore, Slovakia, South Africa, South Korea, Spain, Sweden, Switzerland, Thailand, Turkey, Ukraine, UK, the USA, Venezuela and Vietnam (figure 1). Highest BT consumptions (kg/year per inhabitant) are observed in Ireland (2.1576), UK (1.8137), Turkey (1.6631) and Russia (1.0668). Lowest BT consumptions are observed in South Korea (0.0007), Brazil (0.001) and China (0.0011), as the Chinese population drinks 30 times more green tea (0.036 kg per inhabitant) than BT. Epidemiological data were derived from a specific extraction from the World Health Survey (WHS) conducted by the WHO. Each year, the WHS compiles comprehensive baseline information on the health of populations and health system outcomes.29 Using the 2009 dataset (sample presented in table 1), five key health indicators were selected in 50 countries in both men and women for all age groups: prevalence of respiratory diseases, prevalence of infectious diseases (tuberculosis and HIV), prevalence of cancer, prevalence of cardiovascular diseases and prevalence of diabetes.
Sample of the dataset presenting the five key health indicators (rate per 100 000 inhabitants) and tea consumption in eight countries (kg per 100 000 inhabitants)

2009 Black tea consumption data in kg/year per inhabitant (source: Euromonitor).
Methods
This ecological study used a data mining approach structured in three phases: first, a ‘calibrated principal component analysis’ (PCA) was used to segment the database composed of six variables (BT consumption and the five health indicators) into three synthetic dimensions represented by three axes which can be considered as the mathematical projection of the six dimensions defined by the six variables into three dimensions; second, the six variables were represented as vectors in a ‘correlation circle’ to study potential positive or negative correlations; finally, a linear correlation model was tested on selected variables.
Normative PCA
PCA is a mathematical procedure that uses mathematical projections to convert a set of n possibly correlated variables representing n dimensions into a smaller number of dimensions called ‘principal components’ classically represented in two or three axes F1, F2 and F3. The projections use orthogonal transformations defined in such a way that the first principal component (first axis) has the highest possible variance in order to synthesise most of the initial information. The main objective of PCA is to reduce the dimensionality of the dataset. PCA is often presented as a technique of factor analysis for quantitative variables. Multiple correspondence analysis is another type of factor analysis for quantitative, qualitative and categorical variables and is useful to conduct multicriteria analyses such as multicriteria risk assessment.30 A ‘normative PCA’ was selected for our study, as the six variables (BT consumption per capita and five key health indicators) are quantitative variables and this analysis was calibrated to study potential correlations.
Correlation circle
The correlation circle shows a projection of the initial variables in a dimensional space which can be represented in two or three dimensions.31 Variables are presented as vectors from the centre. When two vectors are close to the correlation circle, they can be: (1) close to each other, meaning a positive correlation (2) orthogonal from each other, meaning that they are not correlated and (3) on the opposite side from the centre, meaning a significant negative correlation. When some vectors are close to the centre, this means that some information is carried on other axes, and that any interpretation might be hazardous. The correlation circle is then used to identify the potential proximity with the six vectors and to assess their potential correlations. Should a vector representing the variable ‘BT consumption’ be close to the correlation circle and point to a similar direction compared with any of the other five vectors representing health indicators, this would indicate a positive correlation between the two variables.
Linear correlation model
Once identified by the correlation circle, potential correlations between BT consumption and one or more health indicators can be described using key statistical parameters, such as the coefficient r2 and the statistical significance p. Using a linear correlation model between BT consumption and one health indicator then determines the extent to which the values of these two variables are potentially ‘proportional’ to each other (BT consumption increases or decreases with one specific disease prevalence). The linear model formula is: y=ax+b (y, health indicator; x, BT consumption; a and b are the model calculated coefficients). The structure of this formula suggests that the variables x and y are linearly related and thus proportional; that is, the correlation is high if it can be represented by a straight line (upwards or downwards slope). If so, this line will represent the linear model, also called a ‘regression line’ or ‘least squares line’ because the sum of the squared distances of all the data points from the line is the lowest possible. The coefficient r2 (coefficient of determination) represents the proportion of common variations between the two variables and establishes the ‘strength’ of the relationship. In order to evaluate the potential correlation between BT consumption and one specific health indicator, it is therefore important to know r2, the statistical significance p of the correlation (calculated by a Fisher–Snedecor test) and the statistical significance of the difference to 0 of the coefficient ‘a’ (Student's t test).
Results
The database was composed of 300 fields representing six variables (five health indicators and BT consumption) in 50 countries. Using normative PCA on this multidimensional table, the overall ‘quality’ (percentage of original variance) of the final projection from six dimensions (six variables) was 59% in two dimensions and 74% when projected in three dimensions. This confirms that the best representation of the dataset should be in three dimensions, which can be described by axes entitled F1, F2 and F3. The ‘BT consumption’ variable provided a high contribution to the construction on axis F3 (81%). The angle of the vector ‘BT consumption’ with axis F3 was only 22°, confirming the very high contribution of this variable on axis F3. Forty-two of the 50 countries were related to this axis F3. The eight countries not contributing to F3 were Brazil, China, Venezuela, Morocco, Colombia, Vietnam, Philippines and Israel, suggesting the absence of any correlation between BT consumption and health indicators in these particular countries.
The ‘correlation circle’ (figure 2) shows that the ‘BT consumption’ vector was strictly opposite the ‘Diabetes prevalence’ vector, establishing a strong statistical negative correlation. Vectors concerning the other key health indicators (infectious diseases, respiratory diseases, cancer and cardiovascular diseases) were represented with a large angle (close to orthogonal) compared with the BT vector, confirming poor statistical relationships between BT and these four health indicators. Of particular interest was the interpretation of the ‘infectious disease’ vector, which seemed to be close to the BT vector in a two dimensions projection, but was actually represented by a large angle in the third dimension. The infectious disease vector was also closer to the centre of the correlation circle, confirming the poor meaningful correlations and potentially hazardous interpretations. Consequently, among the five health indicators selected, only the diabetes parameter was correlated with BT consumption and can be submitted to discussion and interpretation. No valid interpretations can be derived from the other four health indicators using this dataset.

Three-dimensional correlation circle of five health indicators and black tea (BT) consumption. In this three-dimensional representation, the ‘infectious disease’ vector seems to be close to the BT vector, but is actually represented by a large angle in the third dimension, confirming the poor meaningful correlations between the ‘infectious diseases’ and the ‘BT consumption’ variables.
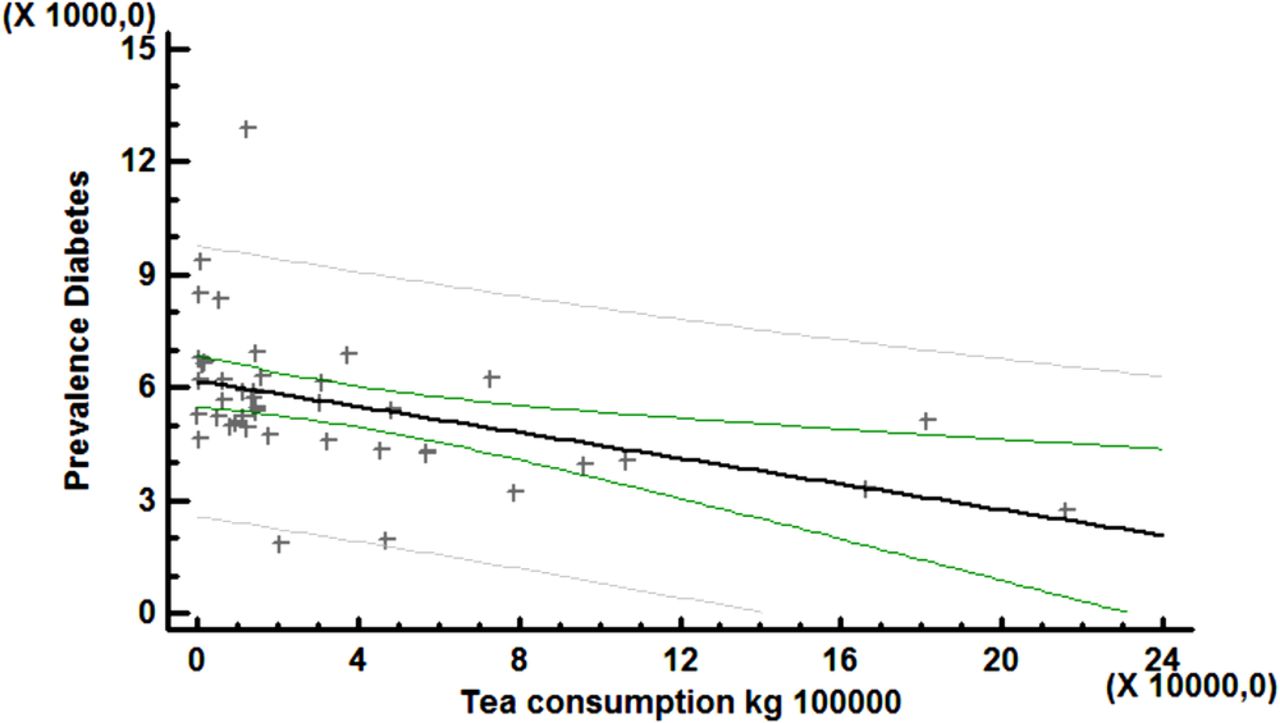
Then linear correlation model with the format y=ax+b is represented by the following formula and is presented in figure 3:
The y-coordinate of the point at which the regression line intersects the y-axis (intercept) can be considered to correspond to the average prevalence of diabetes in a country in which BT consumption is unknown (6173 cases per 100 000 inhabitants). Based on 42 countries, the p value of the Fisher-Snedecor test was 0.003, which is highly significant, confirming the relevance of the linear model. The coefficient r2 was equal to 0.199. Student's t test confirmed that the slope coefficient (0.0171183) was significantly different from 0 (p=0.003) with a 5% CI between (−0.028 and –0.006). The negativity of coefficient ‘a’ indicates that diabetes prevalence decreases as BT consumption increases, confirming a negative correlation.
Linear correlation model between black tea consumption (kg per 100 000 inhabitants) and diabetes prevalence (cases per 100 000).
Discussion
Limitations
This study establishes an inverse linear statistical relationship between high BT consumption and diabetes prevalence in the world, and confirms the findings of the European ecological study establishing a similar relationship.32 As in any database analysis, the very first limitation of this study is related to the quality of the data. WHO prevalence data were obtained from the WHS, which constitute a convenient and official source of key morbidity indicators around the world. The general design of the WHS is based on population sampling organised in the 192 Member States of the United Nations using face-to-face or telephone interviews. As the survey questionnaire offers a menu of choices of modules for each country, and lets the country select the survey approach (Household face-to-face survey, Computer-Assisted Telephone Interview or Computer-Assisted Personal Interview), the quality of data collection can be expected to be heterogeneous around the world.
Furthermore, some of the selected health indicators represent a group of diseases, such as infectious diseases (tuberculosis and HIV) and cancer. The heterogeneity of these indicators can make it difficult to establish any potential statistical relationships. Although more homogeneous, health indicators such as diabetes depend on diagnostic criteria, which can vary across countries. On the other hand, any fixed survey design with fixed criteria would not be appropriate everywhere, for example in countries with low telephone network coverage when planning telephone interviews. Other approaches to estimate prevalence of diabetes in the world have been studies using literature and data extrapolations,33 confirming the growing burden of diabetes. Another important concern is the interpretation of the established statistical relationship between BT consumption and diabetes prevalence. Using a systematic data mining approach, we tested the potential statistical relationship between BT consumption and five health indicators, without any a priori assumptions in relation to any of these health indicators. We observed that, among the five health indicators, only the ‘prevalence of diabetes’ indicator appeared to have a strong statistical relationship with BT consumption. This ecological approach considers the population as the unit of analysis rather than an individual, which is considered to be inferior to case–control studies in the context of evidence-based medicine. In an ecological study, no information is available about the individual members of the populations compared, whereas in a case—control study, information is reported for each individual. A classical criticism of this approach is the ‘ecological fallacy’, corresponding to a logical fallacy in interpretation of the observed correlations at the population level, assuming that they can be applied at the individual level. It is well-known that statistics that accurately describe group characteristics do not necessarily apply to individuals within that group. Our study on BT does not comprise any potential logical fallacy, as it was not used as the basis for any individual assumptions. However, when interesting and strong associations are observed, the results of ecological studies have provided numerous assumptions that have been subsequently confirmed by experimental studies. One of the best-known studies was that published by Keys in 198034 concerning the relationship with dietary habits and coronary heart disease in seven countries. The results of what later came to be known as the ‘Seven Countries Study’ appeared to show that serum cholesterol was strongly related to coronary heart disease mortality at both the population and individual levels, leading to US government dietetic guidelines. Other ecological studies have significantly contributed to scientific knowledge and public health interventions, such as the relationship between lung cancer and tobacco, which has been confirmed by numerous studies.35 For these reasons, ecological studies can be very useful for international comparisons, while case–control studies are exclusively based on local information. Furthermore, when strong correlations have been established, the results of ecological studies can suggest further evidence-based studies, investigating the relevance and mechanism of the statistical relationship.
Growing interest of food components that may support weight management and glucose metabolism
Our results confirm the recent 2012 publication from the InterAct Consortium which carried out a European ecological study confirming an inverse linear association between tea consumption and the incidence of type 2 diabetes in Europe.32 The type 2 diabetes epidemic in many countries has stimulated interest in food components that may support weight management. An almost six-fold increase in the number of people with diabetes has been observed over the last few decades. The International Diabetes Federation reports that the number of people with diabetes will escalate from 285 to 438 million between 2010 and 203033 and the number of persons with IGT will increase from 344 to 472 million. By 2030, there will be over 900 million people worldwide with diabetes or at high risk of diabetes. Diabetes confers about a two-fold excess risk for a wide range of vascular diseases.36 Furthermore, diabetic retinopathy is a common and specific microvascular complication of diabetes, and remains the leading cause of preventable blindness in working-aged people.37 With one of the highest prevalences of all human diseases, diabetes is now a global epidemic with devastating health, social and economic consequences.38 In certain ethnic groups, such as Asian populations, diabetes develops at a younger age than in Caucasian populations. Several distinctive features are apparent in the pathogenic factors for diabetes and their thresholds in Asian populations.39 In conjunction with genetic susceptibility, type 2 diabetes is brought on by environmental and behavioural factors such as a sedentary lifestyle, overly rich nutrition and obesity and results in a huge economic burden.40 According to WHS 2009 data, Singapore is the country with the highest diabetes prevalence with 12 876 cases per 100 000 inhabitants, which is mainly observed in the Chinese community and is probably due to the intense urban lifestyle in Singapore.41 Although many laboratory studies have observed physiological effects of BT on glucose metabolism,17 ,18 ,42 ,43 the underlying mechanisms remain unclear. The results of human intervention studies are mixed44 and the role of caffeine has been suggested but not clearly established.43 ,45 Neyestani et al42 found that regular daily intake of BT improves oxidative stress biomarkers and decreases serum C reactive protein levels in type 2 diabetic patients. Histological studies on pancreas cells published by Manikandan et al17 concluded that the BT extract contributes to regeneration of damaged pancreas cells and protects pancreatic β-cells by its antioxidant action. Nonetheless, the role of environment, dietary and lifestyle practices is fundamental when comparing health indicators around the world. Psaltopoulou et al46 confirmed that low-glycaemic index dietary patterns reduced both fasting blood glucose and glycated proteins independently of carbohydrate consumption. Diets rich in whole-grain, cereal high-fibre products and non-oil-seed pulses would also be beneficial. As vitamins and minerals play an important role in glucose metabolism, understanding the impact of potential vitamin and mineral deficiencies across cultures is also relevant to better organisation of prevention and management of type 2 diabetes.47 ,48 An observational study based on nearly 37 000 middle-aged Chinese reported a 14% reduction in the risk of developing type 2 diabetes by drinking one or more cups of tea per day.49 This was confirmed by two meta-analyses published by Huxley et al43 and Jing et al.50 Flavonoids are believed to support normal glucose metabolism via anti-inflammatory effects and increased insulin activity.51 ,52 Various studies, especially in Asian populations, confirm that flavonoids present in green tea could reduce fat absorption in the gut, may promote fat oxidation in tissues and may increase energy expenditure.53 An observational study of 4300 Dutch adults found that flavonoid intake was highest in women who gained the least weight over a 14-year period.54 Furthermore, as physical activity with or without diet contributes to a healthier lifestyle, this important factor must be considered when comparing health indicators between the industrialised and emerging countries. Given rapid population growth, increased urbanisation, and adverse lifestyle changes, the obesity/type 2 diabetes epidemic in resource-poor nations was predicted in the 1990s and has now been fully confirmed,55 underlying the importance of a better understanding of predictive and potentially protective factors.
Correlation and causality
The number of factors contributing to the growth of diabetes and obesity in the world confirms that ‘correlation does not imply causality’, and that a significant linear correlation between BT consumption and diabetes prevalence does not imply that low BT consumption could cause diabetes. If one factor is established as causing another, then the two factors are most certainly correlated. However, the opposite cannot be concluded. Thus, a correlation can only indicate a potential direct or indirect possible cause, which then needs to be further investigated. This paradigm and the connotations of causality may be the most important considerations affecting biostatistics not only in ecological studies but also in major epidemiological study designs.56 A well-known example of epidemiological cause-and-effect misinterpretations is the correlation that was established between a hormone replacement therapy and a lower incidence of coronary heart disease. This association has been more recently explained by the fact that women taking hormone replacement therapy were more likely to come from higher socioeconomic levels, which could explain the lower incidence of coronary heart disease.57 Establishing causality is one of the most difficult challenges in public health. For instance, in clinical research, randomised controlled clinical trials are performed to establish potential significant differences between two groups. However, establishing a difference is not a demonstration of causality. Another example is case-control studies, which compare individuals with a specific disease (‘cases’) with a group of individuals without the disease (‘controls’). An association between the hypothesised exposure and the disease studied would be reflected by a higher proportion in exposed cases, but this cannot constitute a real demonstration of causality. A potential causality can only be established with the convergence of interdisciplinary scientific evidence (biological, physiological, epidemiological, etc) and reasonable explanations based on longitudinal studies. In any case, ecological research can address important issues that cannot be easily addressed by other study designs. Ecological studies are frequently used when alternative study designs are not possible (eg, randomised control trials), such as when investigating the effect of geographical factors on disease incidence. Our research, like all ecological studies and most other epidemiological approaches, presents a number of limitations because factors other than dietary habits may be the most important determinants of variations in diabetes prevalence across communities. For example, it is possible that other unmeasured confounding factors (eg, genetic differences) may explain some of the observed regional variations. Due to the large number of potential determinants of diabetes prevalence, including patient-related, physician-related, hospital-related and community-related variables, it is difficult to identify with certainty all of the causes of the regional variations of diabetes prevalence, and additional follow-up studies should be considered to confirm the hypotheses generated by this type of study. Despite the fact that a number of biological, physiological and epidemiological field studies have provided evidence linking BT consumption and glucose metabolism,16 ,17 ,22 ,42–44 ,51 ,52 a large-scale randomised controlled trial of tea consumption and diabetes risk would be useful to confirm these findings.
Data mining and data dredging
Beyond the causality issue, a frequent criticism of using data mining was based on the confusion between data mining and data dredging techniques. While a data mining approach is based on searching for combinations of variables that might show potential correlations, data-dredging (also called ‘data fishing’) can generate misleading results.58 When a number of hypotheses are tested, it is expected that some will falsely appear to be statistically significant, since every database can contain potential random correlations. A robust data mining approach must therefore always be based on a clear research strategy and a limited number of relevant meaningful assumptions. In our assessment, we used a systematic data mining approach to test potential correlations between six selected variables (BT consumption and five key health indicators). PCA was used to describe and structure the dataset before testing any correlations. In our study, only one linear correlation model was constructed between BT consumption and diabetes prevalence, based on the most relevant association suggested by the PCA. This consistent approach is quite different from screening numerous cross-regression analyses between all variables of one particular dataset. The data mining approach can be considered to be a ‘radar tracking system’, allowing detection, tracking and classification of potential ‘targets’ in the framework of a particular environment. This is particularly useful when exploring complex databases, as data mining can identify original statistical evidence, which would never be discovered by means of classical statistical techniques. As an example, the significant progress in genomics would not have been possible without the use of data mining techniques. Despite the data collection homogeneity issue inherent to large cross-country comparisons, we believe that this multidimensional approach can provide valuable additional scientific information, completing published biological, physiological and epidemiological studies conducted on tea consumption, diabetes and obesity. These results should support further causality research regarding the health benefits of BT consumption on type 2 diabetes prevalence in the world.
Acknowledgments
The authors thank Professor Paul Zimmet, Director Emeritus, Baker IDI Heart and Diabetes Institute, for reviewing the manuscript and making comments.
References
Footnotes
-
Contributors The work presented here was carried out in collaboration between all authors. AB conceived the study aims and design. GB contributed to the data collection. AB and GD performed the analysis. AB, GD and DB interpreted the results. AB drafted the manuscript. All authors have contributed to, seen and approved the manuscript.
-
Competing interests All authors have completed the Unified Competing Interest form: no support from any organisation for the submitted work, no financial relationships with any organisations that might have an interest in the submitted work in the previous 3 years. Co-author GB is employed at Unilever PLC as Chief R&D Officer and has provided access to the Euromonitor International global tea consumption data without any financial agreement or any grant to support this study, which has been carried out in total independence. There are no other relationships or activities that could appear to have influenced the submitted work.
-
Provenance and peer review Not commissioned; externally peer reviewed.
-
Data sharing statement Authors agree to share the dataset used in this study (2009 Black Tea consumption data and 2009 health indicators), which will be made available by contacting the first author.