Article Text

Abstract
Objectives Patient experience questionnaires have been criticised owing to the lack of supporting psychometric evidence. The objective of this study was to describe the development and psychometric evaluation of the Cancer Patient Experiences Questionnaire (CPEQ) in Norway.
Design Questionnaire development was based on a literature review of existing questionnaires, patient interviews, expert-group consultations, pretesting of questionnaire items and a national survey. Psychometric evaluation included exploratory and confirmatory factor analysis, and tests of internal consistency reliability and test–retest reliability.
Setting Data were collected using a postal survey of cancer patients attending 54 hospitals in all 4 health regions. The subjects were 14 227 adult cancer patients who had attended an outpatient clinic or who had been discharged from an inpatient ward. Patients with all types of cancer were included. Data quality, internal consistency reliability and construct validity were assessed.
Results Of the 13 846 patients who received the CPEQ, 7212 (52%) responded. Exploratory factor analysis identified six scales of outpatient experiences relating to nurse contact, doctor contact, information, organisation, patient safety and contact with next of kin, and seven scales of inpatient experiences, with the addition of hospital standard to the aforementioned scales. All but two of the scales met the criterion of 0.70 for Cronbach's α testing, and test–retest correlations ranged from 0.57 to 0.85. Confirmatory factor analysis supported the interpretation of six and seven scales for outpatients and inpatients, respectively. Statistically significant associations based on explicit hypotheses provided evidence for the construct validity of the scales. One additional scale measuring the hospital level was identified (α=0.85).
Conclusions The CPEQ is a self-report instrument that includes the most important aspects of patient experiences with cancer care at hospitals. The instrument was tested following a national survey in Norway; good evidence is provided herein for the internal consistency reliability, test–retest reliability and construct validity.
- Patient satisfaction
- Cancer
- Validity and reliability
This is an open-access article distributed under the terms of the Creative Commons Attribution Non-commercial License, which permits use, distribution, and reproduction in any medium, provided the original work is properly cited, the use is non commercial and is otherwise in compliance with the license. See: http://creativecommons.org/licenses/by-nc/2.0/ and http://creativecommons.org/licenses/by-nc/2.0/legalcode.
Statistics from Altmetric.com
Article Summary
Article focus
-
To describe the development and evaluation of the Cancer Patient Experiences Questionnaire (CPEQ).
-
Data quality, internal consistency reliability and construct validity were assessed.
Key messages
-
Patient satisfaction questionnaires have generally been criticised due to the lack of supporting psychometric evidence, including reliability and validity data.
-
Valid and reliable measures for the measurement of cancer patients’ experiences with hospitals are crucial if the data are to be used in quality improvement, business control and by both patients and the general public.
Strengths and limitations of this study
-
The strengths of the study include the psychometric assessment of the CPEQ following a national survey, including data quality, dimensionality, internal consistency and construct validity.
-
The scale could prove useful for evaluating cancer patients’ experiences with hospitals in Norway and in similar settings in other countries, and includes the most important aspects regarding both inpatient and outpatient hospital care from the patient perspective.
-
Further investigation of the explanatory characteristics of variations in cancer patients’ experience with healthcare is warranted.
Introduction
The measurement of patient experiences is now recognised as an important part of healthcare performance evaluation. Patient experiences are included as one of three core quality dimensions in the Organisation for Economic Cooperation and Development quality indicator framework,1 and are central to the framework of the WHO for assessing the performance of health systems.2 Several studies have shown that patient experiences are positively related to patient satisfaction3 ,4 and that patient satisfaction is positively associated with compliance5 and health outcomes.4 Eliciting feedback from patients helps healthcare providers to identify potential areas for improvement, which in turn can increase the quality of healthcare.
The acquisition of valid information requires patient experiences to be measured using rigorously developed and validated tools. Patient satisfaction questionnaires have generally been criticised because of the lack of supporting psychometric evidence, including reliability and validity data. A review of 195 patient satisfaction papers published in 1994 found that the satisfaction instruments presented little evidence of reliability or validity,6 casting doubt on the credibility of the resultant findings. Furthermore, questionnaires that ask patients to rate their care in terms of how satisfied they are tend to elicit very positive ratings.4 A more valid approach is to ask patients to report in detail on their experiences by asking them specific questions about certain processes and events; this will provide results that can be easily interpreted and acted upon.7
Norway has a national patient experience survey programme that is run by the Norwegian Knowledge Centre for the Health Services. The purpose of the programme is to systematically measure user experiences with healthcare, to provide data for quality improvement, business control, hospital choice and public accountability. Because of the aforementioned problems that arise when attempts are made to measure satisfaction, the instruments focus on experiences of the healthcare delivery, not satisfaction. In 2007, the Ministry of Health in Norway decided to measure cancer patients’ experiences with hospitals. The Norwegian Knowledge Centre for the Health Services has developed and validated several generic instruments to be used in national patient experience surveys,8–19 but none specifically for cancer patients. Ensuring the sensitivity of the instrument and detecting changes that are significant for the patient requires instruments specific to the study objective as well as the population of interest to be developed.20 A review of the literature was conducted to determine whether there was an instrument that included multidimensional scales including different aspects of patient with experiences. Two national surveys of patients’ experiences of cancer services have been carried out in the UK: the first in 1999–2000 by the National Patient Survey Programme21 and the second in 2004 by the National Audit Office.22 However, these surveys included only six types of cancer: breast, colorectal, lung, ovarian, prostate and non-Hodgkin's lymphoma. Other questionnaires identified in the review typically addressed quality of life, or involved specific cancer types, treatments, services or clinical staff; no measures appropriate for all cancer types, including assessment of inpatient and outpatient cancer care, were identified. Consequently, the literature review identified shortcomings with existing measures, and it was decided to develop a new instrument to measure the experiences of hospital care of both inpatients and outpatients that could be used in a future national survey in Norway.
This paper describes the development and evaluation of the Cancer Patient Experiences Questionnaire (CPEQ). This tool was designed for application in a national survey of adult cancer patients, whereby the results are published in the form of reports for the public, the government and individual healthcare units as a basis for national surveillance, quality improvement and hospital choice.
Methods
Questionnaire development
The questionnaire was developed based on the findings of a literature review of questionnaires aimed to determine cancer patients’ experiences with hospitals, semistructured interviews with 13 cancer patients, and focus groups of experts including clinicians and representatives for patient with cancer organisations. This process was designed to ensure content validity and that the questionnaire addresses important aspects of patient with cancer experiences of care, and to establish a model for including participants in the survey. The development of the questionnaire also followed previous work in the identification of domains and items of relevance for the patients.8–19 We tested the questionnaire by performing cognitive interviews with 12 cancer patients and a pilot study of 953 cancer patients at a single hospital. The cognitive interviews and the pilot study suggested minor changes to the questionnaire, which were discussed within the group of experts before finalisation.
We asked the patients about their overall experiences with a specific hospital. The questionnaire was divided into separate sections for inpatients and outpatients, consisting mainly of the same questions, except for six questions included in the inpatient section about hospital standards and waiting time. The questionnaire also included items concerning aspects of care irrespective of outpatient or inpatient settings, as well as sociodemographic and health-status questions. The final questionnaire comprised 127 items. Items relating to experiences of care had a five-point scale that range from ‘not at all’ (1) to ‘a very large extent’ (5). Negative items were reverse-coded, and a higher score represent a better experience for all items. Scales were transformed to scores ranging from 0 to 100 where 100 is the best possible. In this study, we enquired about experiences that do not apply to all patients but which are considered important to the relevant patients. Consequently, the levels of missing data were expected to reflect patients being at different stages of cancer treatment and having varying levels of experience with hospital care.
Data collection
The questionnaire was mailed to 14 227 patients with all types of cancer aged 16 years or older who had at least one outpatient appointment or a hospital stay at a Norwegian hospital from 20 September to 10 December 2009. A maximum of 400 patients from each of the 54 hospitals was included; 400 patients were selected randomly from hospitals with more than 400 eligible patients. Power calculations have been conducted at the hospital level, resulting in an appropriate sample size of 400 for each hospital. When presenting population estimates, individual weights are used to adjust for non-response. These are also related to the size of the hospital populations so that results at higher levels (health enterprise, regions and the nation) take into account differences in hospital size. The hospitals had the opportunity to exclude patients who were not considered applicable to participate in a survey, and the patients themselves could withdraw from the survey at any time by contacting the hospital. Checks were undertaken to ensure that patients were not sent more than one questionnaire, and the first hospital episode with a cancer registration was taken as the episode to use in the survey sample for patients who appeared on the lists more than once. Units for palliative care and birth and maternity departments were excluded from the survey. The questionnaires were mailed to the patients by the end of January to mid-May 2010. Non-responders were sent one reminder after 3 weeks. We also mailed a retest questionnaire to 291 consenting patients approximately 1 week after their first reply for the purpose of assessing test–retest reliability. After the completion of data collection, the patient contact information was deleted and the hospitals transferred the demographic, clinical and administrative data, which were merged with the patients’ responses.
The survey was approved by the Norwegian Regional Committee for Medical Research Ethics, the Data Inspectorate and the Ministry of Health and Care Services.
Statistical analysis
Most statistical analyses were carried out using SPSS V.15.0. Confirmatory factor analyses (CFAs) were conducted using the linear structural relation (LISREL) analysis programme. STREAMS (Structural Equation Modelling Made Simple) offers an interface to the LISREL programme and was used as a support.23
Separate exploratory factor analyses (EFAs) were carried out for outpatients and inpatients using principal axis factoring. We expected some correlations among the factors and chose oblique rotation (promax). The criterion for the number of factors to be rotated was eigenvalues greater than 1, and items with factor loadings lower than 0.4 were excluded.
Cronbach's α coefficient was calculated to determine the internal consistency of the scales. An α value greater than 0.70 is considered satisfactory.24 ,25 Internal consistency was also assessed by item-total correlation, measuring the strength of the association between an individual item and the total score of the remainder of its scale. A correlation coefficient of 0.30 or higher has been recommended previously.26 The intraclass correlation coefficient was used as an estimate of the test–retest reliability, and was used to assess the correlation between scores obtained at different times for each scale; the estimated coefficients should exceed 0.7.24
The item structure from EFAs was used to construct theoretically derived scales. CFA was applied to further test the relationship between the observed variables and their underlying latent constructs identified from the EFAs. The LISREL analysis programme was used to test the goodness of fit of the models27 using various fit indexes, including the root mean square error of approximation (RMSEA), the goodness-of-fit index (GFI), the comparative fit index (CFI) and the incremental fit index (IFI). An RMSEA of 0.05 or less, and a GFI and CFI of 0.90 or above are generally taken to indicate a good fit. The IFI values range from 0 to 1, with larger values indicating a better goodness of fit.
Construct validity refers to whether a scale measures or is correlated with the theorised scientific construct, and was assessed by exploring the associations of scale scores as well as their associations with additional items not included in the scales. A systematic review identified 139 articles that provided evidence about determinants of satisfaction,4 and concluded that satisfaction was linked to prior satisfaction, predisposition, utilisation, granting of desires, health status, health outcomes and age. Evidence about the effects of gender, ethnicity, socioeconomic status and expectations was equivocal. Following the literature review and previous findings,4–17 it was hypothesised that scale scores would be correlated with global satisfaction, age, gender and health status. Time since cancer diagnosis and whether the treatment provided was considered the best possible were also hypothesised as potential determinants.
Results
Data collection
Of the 14 227 questionnaires that were mailed to cancer patients, 137 were returned because of erroneous addresses, and 244 of the patients had died. Accordingly, the adjusted total sample was 13 846 patients, of which 7212 responded (52%), 6642 patients with experiences from outpatient wards and 4856 patients from inpatient wards; 4460 patients had attended both inpatient and outpatient wards at the hospital. Table 1 lists the characteristics of the respondents.
Patient characteristics
Data quality and psychometric evaluation
The levels of missing data and descriptive statistics for the items are presented in table 2. The levels of missing data ranged from 2% to 12%, which can be considered as acceptable for most items. Responses in the category ‘not applicable’ ranged from 2% to 33%. However, since the questionnaire was intended to apply to all cancer patients, rates of not applicable or missing data higher than 10% were accepted. Mean scores for single items were generally skewed towards a positive rating (table 2). The mean scores were lowest (at 3.2 for both outpatients and inpatients) for information about pain and pain alleviation. The mean scores were highest for items about patient safety, and ranged from 4.5 to 4.7.
Descriptive statistics,* factor loadings and internal consistency for outpatients and inpatients
Separate EFAs were conducted for outpatients and inpatients. Results from the first factor analyses for both outpatients and inpatients showed that most of the items addressing organisation loaded on the first factor, which related to nurse contact. For outpatients, this was also the case for items about contact with next of kin. On the basis of both empirical and theoretical assumptions, summed rating scales were constructed for organisation (outpatients and inpatients) and contact with next of kin (outpatients).
Further analyses where these items were omitted produced four factors for outpatients and six for inpatients (see table 2). All item–total correlation coefficients exceeded the 0.4 criterion (range 0.41–0.86). The four factors related to outpatients’ experiences were nurse contact, doctor contact, information and patient safety; the α values ranged from 0.61 to 0.92. The four-factor solution accounted for 62% of the total variance. The same four factors were produced for inpatients, comprising the equivalent items, as well as two other factors (contact with next of kin and hospital standard); the α values ranged from 0.67 to 0.94. These six factors explained 63% of the total variance in the scores for inpatients’ experiences. Table 2 lists the factor loadings. All factor loadings for the items exceeded 0.4, and no item had a cross-loading ≥0.40.
α Values for 11 of the 13 scales satisfied the criterion of 0.70 or higher (table 2). Cronbach's α is sensitive to the number of test items, and the two patient safety scales that did not meet the criterion of 0.70 (0.614 and 0.667) had three test items each. Item–total correlation coefficients showed that all items satisfied the stated criterion of 0.40, and it was decided to keep the six scales for measuring outpatient experiences and the seven scales for measuring inpatient experiences. Of the 291 patients mailed a retest questionnaire, 229 responded (79%). Table 2 lists the results of the test–retest correlations for the 13 scales. The test–retest correlation coefficients ranged from 0.57 to 0.81 for outpatients and from 0.62 to 0.85 for inpatients.
CFAs were applied to examine the hypothesised factor structures. The measurement part specifies the relationship of the latent to the observed variables, and the structural part of the models specifies the relationship among the latent variables. First, the six-factor solution of the outpatient experiences was tested, which revealed that there was a satisfactory model fit to the data (χ2=23559.96, p<0.001, df=458, RMSEA=0.091, GFI=0.81, CFI=0.96 and IFI=0.96). The results are shown in figure 1. The exogenous, latent variables were the six factors and the endogenous, latent variable was outpatient experiences, introducing a second-order analysis examining the correlations among the first-order factors to examine predictions on the endogenous variable. Organisation was the strongest predictor (β=0.95), but nurse contact (β=0.89), doctor contact (β=0.88) and information (β=0.76) were also strongly associated with the endogenous, latent variable. This was also the case for contact with next of kin (β=0.61) and patient safety (β=0.60). Second, the seven-factor solution of the inpatient experiences was tested, which indicated a slightly better fit (χ2=26697.60, p<0.001, df=621, RMSEA=0.083, GFI=0.81, CFI=0.97 and IFI=0.97; figure 2). The results were consistent with those of the previous CFA; the inpatient experiences factor was strongly affected by organisation (β=0.93), nurse contact (β=0.89), doctor contact (β=0.89), information (β=0.77), contact with next of kin (β=0.70) and hospital standard (β=0.70). The prediction from patient safety was slightly lower (β=0.56).
Table 3 gives the results of construct validity testing. The correlations between the scale scores were all significant at the p<0.001 level (range of correlation coefficients, 0.27–0.77). The correlations were weakest for the patient safety scales and the other scales, and strongest for organisation and doctor contact. The correlations between scale scores and other single items were strongest for the patients’ confidence in that the treatment received was the best possible, with the correlation coefficients ranging from 0.43 to 0.70. Overall satisfaction and overall experiences were moderately to strongly correlated to the scales (range of correlation coefficients, 0.24–0.59), with all correlations significant at the p<0.001 level. A significant correlation was also found between all of the scales and the patients’ health status, indicating that patients with poorer health scored substantially lower on all scales. Age and time since cancer diagnosis were more weakly correlated with the scales. Results from t tests showed significant but small differences between men and women on four scales. Relative to women, male outpatients had significantly lower scores on the contact with next of kin scale (t=−2.03, p<0.05); however, male inpatients had higher scores for nurse contact (t=2.79, p<0.01), organisation (t=3.78, p<0.001) and hospital standard (t=6.84, p<0.001).
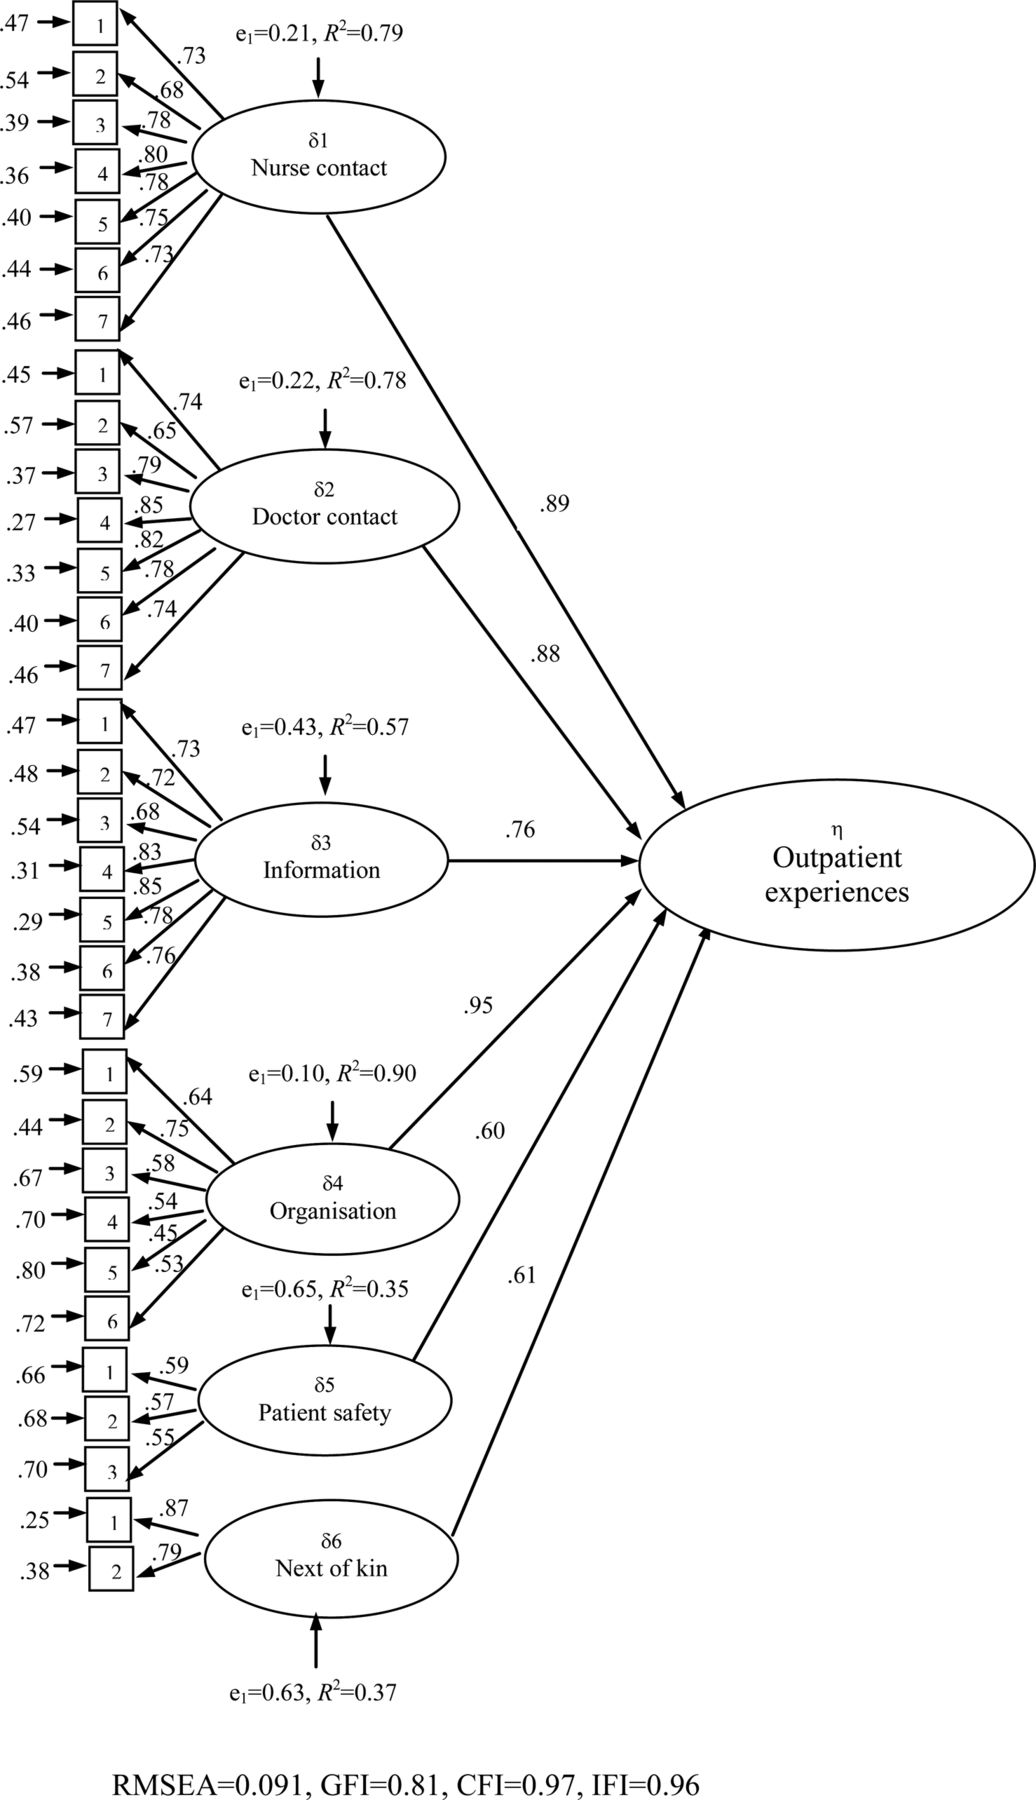
Confirmatory factor analysis model for outpatients.

Confirmatory factor analysis model for inpatients.
The questionnaire also included items about hospital care not directly related to either outpatient or inpatient wards, addressing the hospitals’ extra-medical services, co-operation with the primary doctor and other community services, and information on how to manage future problems. The items had high levels of responses in the category ‘not applicable’ (range 12–63) indicating that they are not relevant to a high proportion of the respondents. Table 4 indicates that the items have lower mean scores than those included in the other factors, ranging from 2.5 to 3.4. Factor analysis revealed a one-factor solution accounting for 57% of the variance of the scores (table 4). The factor loadings ranged from 0.56 to 0.79, the item–total correlation coefficients ranged from 0.52 to 0.71 and the results from reliability analysis yielded a Cronbach's α of 0.85. The test–retest correlation coefficient for this scale was 0.78.
Correlations† between scale scores and individual items for outpatients and inpatients
Descriptive statistics,* factor loadings and internal consistency for all patients
The scale was not correlated significantly with time since cancer diagnosis, but patients with poorer health reported significantly more negative experiences, as did older patients and women (see table 5). Results from t tests showed that male patients reported significantly more positive experiences than did female patients (t=3.54, p<0.001).
Correlations* between scale score and individual items for all patients
Discussion
This study was part of the first national survey undertaken in Norway to assess cancer patients’ experiences with somatic hospitals. The development of the CPEQ followed a review of the literature, interviews with cancer patients and consultation with an expert group of professionals and researchers. The resulting questionnaire underwent a thorough process of piloting and testing for data quality, reliability and construct validity, as recommended for evaluating such questionnaires. The CPEQ addresses broad domains of cancer-related care at somatic hospitals, rather than focusing on specific treatments, cancer types or specific professionals involved in care of the patients.
The results from the survey can be used as national quality indicators in Norway and were designed to inform patient choice and for quality improvement. The CPEQ was designed specifically for use with cancer patients attending somatic hospitals, and was assumed to increase content validity from a patient perspective as well as allowing hospital staff to investigate in detail the extent to which their service meets the needs of their patients. Questionnaires that assess specific aspects of care allow the domains where patients have poorer experiences to be identified and potentially improved.
Satisfactory evidence of internal consistency, test–retest reliability and construct validity was obtained, indicating that the CPEQ can be considered a high-quality instrument. The results of the EFAs and tests of internal consistency provided empirical support for the scales, and confirmed that both outpatient and inpatient experiences are multidimensional concepts. CFAs were supportive of the structures suggested by EFAs. There is evidence for construct validity of the questionnaire following the application of hypotheses based on previous research findings and theory.7 ,8–19 The results also provide support for the longitudinal temporal stability of the measure. High agreement between scores administered approximately 1 week apart provided good evidence of the test–retest reliability of the CPEQ.
Some limitations of the study should be considered. The levels of missing data suggest that the measure is acceptable to patients. However, some of the included items were only relevant for some of the respondents. It may be possible to extract a shorter version of the CPEQ with fewer questions without sacrificing the psychometric qualities of the measure, but this task was beyond the scope of this study. Another potential limitation is the response rate. In general, postal surveys have lower response rates than other data-collection modes.4 Non-response bias occurs when the main variables differ systematically between respondents and non-respondents.28 The response rate (52%) means that almost half of the patients failed to respond; however, it was relatively high compared with previous user-experience surveys carried out in Norway.8–19 Findings from some of these surveys have shown that the low response rates have not caused serious bias.15 ,29–32 The findings from a Norwegian follow-up study involving a hospital population showed that postal respondents and non-respondents had almost the same scores.32 These studies indicate that non-response might be of less concern, but uncertainty related to external validity means that more research is needed on the effect of non-response in patient experience surveys on cancer care and that the main findings in this study should be replicated in future studies.
Consistent with previous findings,33–35 some skewing towards positive assessment was identified. Whether this reflects truly positive experiences or low expectations is unknown.36 As for any study based on self-reports, social desirability bias and recall bias may also have affected the results. Respondents may introduce bias in several ways, for example, by giving socially desirable responses as a result of cognitive consistency pressure (making ratings congruent with their continuing use of the service) and through acquiescent response sets (a tendency always to agree or reply positively).4 However, respondents have been shown to give more positive and socially desirable responses in interview surveys than in self-administered surveys.37 Moreover, it is assumed that recall bias is less likely when asking about the overall experience rather than about a specific visit or hospitalisation.
Instead of developing a cancer-specific questionnaire, one of the existing generic questionnaires could potentially have been used in the national survey, such as the Patient Experience Questionnaire.8 This would have reduced the resource requirements, and also has some empirical support. One study compared the measurement properties and the patients’ evaluation of one generic and two psychiatric-specific patient satisfaction questionnaires in a sample of psychiatric patients. The results indicated that no single instrument was superior in either respect.38 Another study identified 10 generic core items covering major dimensions of experiences that patients across a range of specialist healthcare services report to be important.39 A short, generic questionnaire might be expected to give a higher response rate and better comparability than the CPEQ, but would not be suited for the purpose of a national survey in Norway. The purpose of the present study was a broad assessment of hospital cancer care. Furthermore, content validity is better for a cancer-specific questionnaire, since all activities are directed against securing validity for cancer patients, rather than to patients in general. Naturally, a national survey with a narrower focus could have used a generic and perhaps shorter questionnaire.
Results from the national patient experience survey programme in Norway are used to develop quality indicators presented both to the public and to the responsible institutions. Public use includes an Internet site for free hospital choice in Norway. Research has shown that patients have difficulty in understanding quality information,40 and that ‘less is more’ in this respect.41 Therefore, an aggregated and overall measure of experiences with the hospitals seems appropriate in the context of presenting information to patients. Further research is needed to determine how to construct a composite score, including how to weight each of the underlying subdimensions. More specific results are called for when reporting information to health providers with the aim of evaluating and improving the quality of care.33 Consequently, aggregated scores on the 13 CPEQ subdimensions might be a useful supplement when reporting results to the responsible hospitals.
Comparing the contribution at the organisational and individual levels is relevant for comparisons of hospitals based on patient evaluations. The approach for institutional benchmarking in the national survey programme involves developing an appropriate case-mix model and correct for multiple comparisons in statistical testing. Another emerging approach is to use multilevel analysis to estimate the amount of variation in scores that can be explained by levels above the individual level.42 A previous study of patient experiences found that only a small part of the variation is attributable to the organisational level.43 Future studies based on the CPEQ should explore this topic further in order to elucidate the usefulness of the CPEQ as a basis for quality indicators at the hospital level. This also includes research on hospital-level reliability, which is based on the theory that patients who are treated at the same hospital should agree regarding their assessments of that hospital. The larger the ratio of between-hospital to within-hospital variation in the scores, and the larger the number of respondents, the more precise will be the measurement of differences between hospitals, and thus the greater the reliability of the scores.44
Patient-satisfaction questionnaires have been criticised for insufficient knowledge of their reliability and validity in psychometric testing.3 The strengths of the present study include the psychometric assessment of the CPEQ following a national survey, including data quality, dimensionality, internal consistency and construct validity. The scale should prove useful for evaluating cancer patients’ experiences with hospitals in Norway and in similar settings in other countries, and includes the most important aspects regarding both inpatient and outpatient hospital care from the patient perspective.
Conclusions
Valid and reliable measures for the measurement of cancer patients’ experiences with hospitals are crucial if the data are to be used in quality improvement, business control and by both patients and the general public. The CPEQ includes the most important aspects of cancer patients’ experiences with somatic hospitals, from the perspective of the cancer patients themselves. The present study has provided strong evidence for the high data quality, internal consistency, content and construct validity of this questionnaire. The questionnaire is recommended for future applications designed to assess cancer patients’ experiences of both inpatient and outpatient care in Norway and similar settings in other countries. Further investigation of the explanatory characteristics of variations in cancer patients’ experience with healthcare is warranted.
Acknowledgments
The authors thank Tomislav Dimoski at the Norwegian Knowledge Centre for Health Services, Oslo, Norway, for developing the software necessary for gathering data from the hospitals, and for conducting the data collection and quality assurance of data. We also thank Saga Høgheim and Marit Skarpaas, who carried out most of the practical tasks relating to data collection, as well as members of the expert group that contributed to the development of the questionnaire and survey design.
References
Footnotes
-
Contributors All authors contributed to the design of the questionnaire and survey. HHI conducted the analysis and drafted the manuscript. HHI and OH were involved in the data acquisition. All authors have made significant contributions by critically reviewing the manuscript and have read and approved the final version.
-
Funding The survey was funded by the Norwegian Ministry of Health.
-
Competing interests None.
-
Ethics approval The Norwegian Regional Committee for Medical Research Ethics, the Data Inspectorate, and the Ministry of Health and Care Services.
-
Provenance and peer review Not commissioned; externally peer reviewed.
-
Data Sharing Statement The data from the current study are available to specific researchers at the Norwegian Knowledge Centre for Health Services.