Article Text

Abstract
Objectives Early child development may have important consequences for inequalities in health and well-being. This paper explores population level patterns of child development across Australian jurisdictions, considering socioeconomic and demographic characteristics.
Design Census of child development across Australia.
Setting and participants Teachers complete a developmental checklist, the Australian Early Development Index (AEDI), for all children in their first year of full-time schooling. Between May and July 2009, the AEDI was collected by 14 628 teachers in primary schools (government and non-government) across Australia, providing information on 261 147 children (approximately 97.5% of the estimated 5-year-old population).
Outcome measures Level of developmental vulnerability in Australian children for five developmental domains: physical well-being, social competence, emotional maturity, language and cognitive skills and communication skills and general knowledge.
Results The results show demographic and socioeconomic inequalities in child development as well as within and between jurisdiction inequalities. The magnitude of the overall level of inequality in child development and the impact of covariates varies considerably both between and within jurisdiction by sex. For example, the difference in overall developmental vulnerability between the best-performing and worst-performing jurisdiction is 12.5% for males and 7.1% for females. Levels of absolute social inequality within jurisdictions range from 8.2% for females to 12.7% for males.
Conclusions The different mix of universal and targeted services provided within jurisdictions from pregnancy to age 5 may contribute to inequality across the country. These results illustrate the potential utility of a developmental census to shed light on the impact of differences in universal and targeted services to support child development by school entry.
- Social Epidemology
- Inequality
- Public Health Policy
- Child Health and Development
- Australia
This is an open-access article distributed under the terms of the Creative Commons Attribution Non-commercial License, which permits use, distribution, and reproduction in any medium, provided the original work is properly cited, the use is non commercial and is otherwise in compliance with the license. See: http://creativecommons.org/licenses/by-nc/2.0/ and http://creativecommons.org/licenses/by-nc/2.0/legalcode.
Statistics from Altmetric.com
Article summary
Article focus
-
This study presents the first ever population-wide census of child development across an entire country; Australia.
-
There are large inequalities in child development across jurisdictions and sociodemographic groups, showing that disparities in child development emerge early in life.
Key messages
-
High-quality population monitoring and data linkage systems are essential to inform progressive universalist policy approaches.
-
Jurisdictional differences in child development persist after controlling for socioeconomic and demographic factors. Differing jurisdictional policies, and levels of service provision that support children and their families from birth to school age may contribute to inequalities in child development across the country.
Strengths and limitations of this study
-
These results are based on a developmental census of Australian children, with a large sample of 261 147 children, representing approximately 97.5% of the estimated 5-year-old population.
-
Further research is needed to understand whether these jurisdictional differences in child development can be attributed to different government policies and service provision.
Introduction
Governments are becoming increasingly interested in the early determinants of children's health, development and well-being in order to inform services needed to better support children and their families. It is recognised that the opportunities for prevention and public health interventions will be enhanced the more we understand the early pathways to poorer health and development1 and that to have an impact on health inequalities will require us to address the social determinants of early child health, development and well-being.2 However, appropriate service and systemic improvements for reducing developmental inequalities requires an understanding of the patterns of child health and development across population groups and geographies in order to underpin a progressive universal portfolio of services.3
Socioeconomic gradients in child health and development mean that providing services primarily to the disadvantaged will not eliminate population health burdens.4 Children from all social and economic backgrounds may suffer poor health and development, albeit that those in the most disadvantaged circumstances have a disproportionate share of poor health and development. To reduce the steepness of the social gradient in health, actions to influence development must be universal, but be implemented with a scale and intensity that is proportionate to the level of disadvantage2—an approach termed as progressive or proportionate universalism.
Measuring the developmental effects of proportionate universalism requires substantial effort in the form of establishing early and developmentally relevant baseline measures with ongoing capacity to monitor progress over time. An added challenge entails demonstrating that improvements in early development, translate into improvements in later human capability.5 This requires longitudinal measurement to ascertain life-course developmental effects. An essential starting point is quantification of the overall level, and the absolute and relative inequality in child health and development across the population.
The global challenge to improve early child health and development requires an instrument that can be used across the population, be compared over time for monitoring and is sensitive enough to evaluate programmes. A measure used internationally would additionally enable such comparisons both within and across countries. The current basic health statistics collected early in life to compare the progress of countries include infant, maternal and child death rates, breastfeeding and immunisation rates.6 Other measures of progress such as the Programme for International Student Assessment7 provide cross-national comparisons of educational performances and are collected much later in child development. These efforts have contributed substantially to sustained cross-national financial and programmatic commitments to lift human development outcomes within nations.8
Notwithstanding the significance of these measures, we should be seeking indicators that determine whether children are surviving as well as how well populations of children are actually developing between birth and school entry. This is now recognised by organisations such as the OECD and the World Bank which are promoting the use of internationally comparable instruments to measure child development and well-being.9 ,10 The implications for monitoring child development are also highlighted by the United Nations Convention on the Rights of the Child11 as each of the signatory countries is responsible for providing children with the opportunities necessary to develop physical, cognitive, social and emotional capabilities in early life.
Transition to school is seen as one of the best stages in a child's life to measure child development and well-being.12–14 Research has established that children at higher risk for suboptimal development can be better prepared for initial success at school through early childhood education, family support, paediatric and allied healthcare interventions and child health programmes.15 When children come to school with the developmental capacity to take advantage of the education system, coupled with a high-quality education system, the initial positive effects persist into adolescence and adulthood.15
In 2007, the Council of Australian Governments endorsed the Australian Early Development Index (AEDI) as a national progress measure of early childhood health and development.16 The AEDI is a population measure of children's development covering five developmental domains: physical health and well-being, social competence, emotional maturity, language and cognitive skills, and communication skills and general knowledge. The instrument is based on the Canadian Early Development Instrument and has been used in Australia since 2002.17 In 2009, the AEDI was collected for almost every child across Australia in their first year of full-time schooling. This represents the first effort by any country to conduct a ‘child development census’ with information collected on more than 261 000 children representing 97.5% of the age-eligible population.18 The Australian federal government has now committed to repeating the AEDI census every 3 years. The monitoring of child development and well-being over time and across the whole population enables local communities to determine if they are making improvements and fosters the relative comparison of communities and populations subgroups.19 This commitment to tracking and reporting early childhood outcomes across the entire population, underlines the federal government's leadership role in providing communities and governments with evidence-based information for policy and service evaluation.
Australian context
Australia is a federated democracy that has three tiers of government: federal, state and local. Funding towards early child health and development at a federal level is delivered through various departments including the Department of Education, Employment and Workplace Relations, Department of Families, Housing, Community Services and Indigenous Affairs and the Department of Health and Ageing. The federal government has annual contract negotiations, passing monies over to the jurisdictions, for them to deliver agreed services and to assist with national health reform.
Although the six states join together to form the Commonwealth of Australia, they are constituted with the power to make laws and policies through their own legislative, executive and judicial functions. Australia also has two principal territories, the Australian Capital Territory (ACT) and the Northern Territory, which constitutionally are directly subject to the Commonwealth government. These eight state and territory governments provide the bulk of early childhood services, with differing levels and approaches to service delivery. Local governments make up the third tier and are established by state and territory governments to take responsibility for a number of community based services. Of the total health expenditure in Australia, 42.7% is contributed by the federal government, 25.3% by state, territory and local governments, and the remainder is covered by individuals, non-government agencies and private industry.20
Australia is the earth's biggest island and the sixth-largest country in the world in land area. It is a culturally diverse society with a population of more than 22 million.21 Australia's population includes Aboriginal and Torres Strait Islander (ATSI) peoples and migrants from some 200 countries with Indigenous Australian peoples representing 2.5% of the total population.22 In over 60 years of planned post-war migration, Australia has accepted more than 6.5 million migrants and in the most recent census (2006), 3.1 million people (16% of the population) were reported to speak a language other than English at home.23 The majority of the population lives in the cities mainly located around the coast; however, many live in rural and remote areas ranging from dry arid land to tropical and a few live in what are arguably some of the most remote and untouched areas of the world.
Australia's income inequality has been steadily increasing24 but it ranks second after Norway on the most recent Human Development Index (HDI) results.25 The plight of the ATSI population however remains one of Australia's most concerning inequalities. Separate HDI estimates for Australian ATSI s ranked this subpopulation at about 104th—between Cape Verde and China.26 The most recent report from Australia's Productivity Commission notes that there has been little change for Aboriginal people on measures of literacy and numeracy, most health indicators and in proportions living in overcrowded housing. Rates of child abuse and neglect substantiations and adult imprisonment have increased for Aboriginal people, but there has been recent improvement in juvenile detention rates.22 Low birth weight rates are two-and-a-half times higher than for children born to non-Aboriginal mothers.22
The multicultural context of Australia, its geographical size and climatic variation, along with multitiered political governance and service delivery highlights the complexity faced when aiming to understand and reduce inequality in child health and development. The objective of this study is to use the national AEDI census data to examine jurisdictional, geographic, socioeconomic and gender inequality in child health and development across Australia.
Methods
To support broad access to the AEDI data the Australian Government through the Department of Education, Employment and Workplace Relations made available in 2011 a Confidentialised Unit Record File (CURF) for researchers. In order to protect the privacy of individual children the data were confidentialised by removing the child's name and date of birth, restricting potentially identifying information, and where the information was considered to present a risk of identifying individuals the data were restricted and/or ‘perturbed’, however, details of this process conducted by the Australian Bureau of Statistics are confidential.27 This, in combination with the unavailability of a socioeconomic indicator for the Northern Territory resulted in the removal of the territory from the analytical models. The AEDI CURF does not include the individual items that comprise the AEDI and only provides categorised data on the summary AEDI domain scores and a limited range of sociodemographic characteristics such as state of residence, gender and remoteness.28
Study population
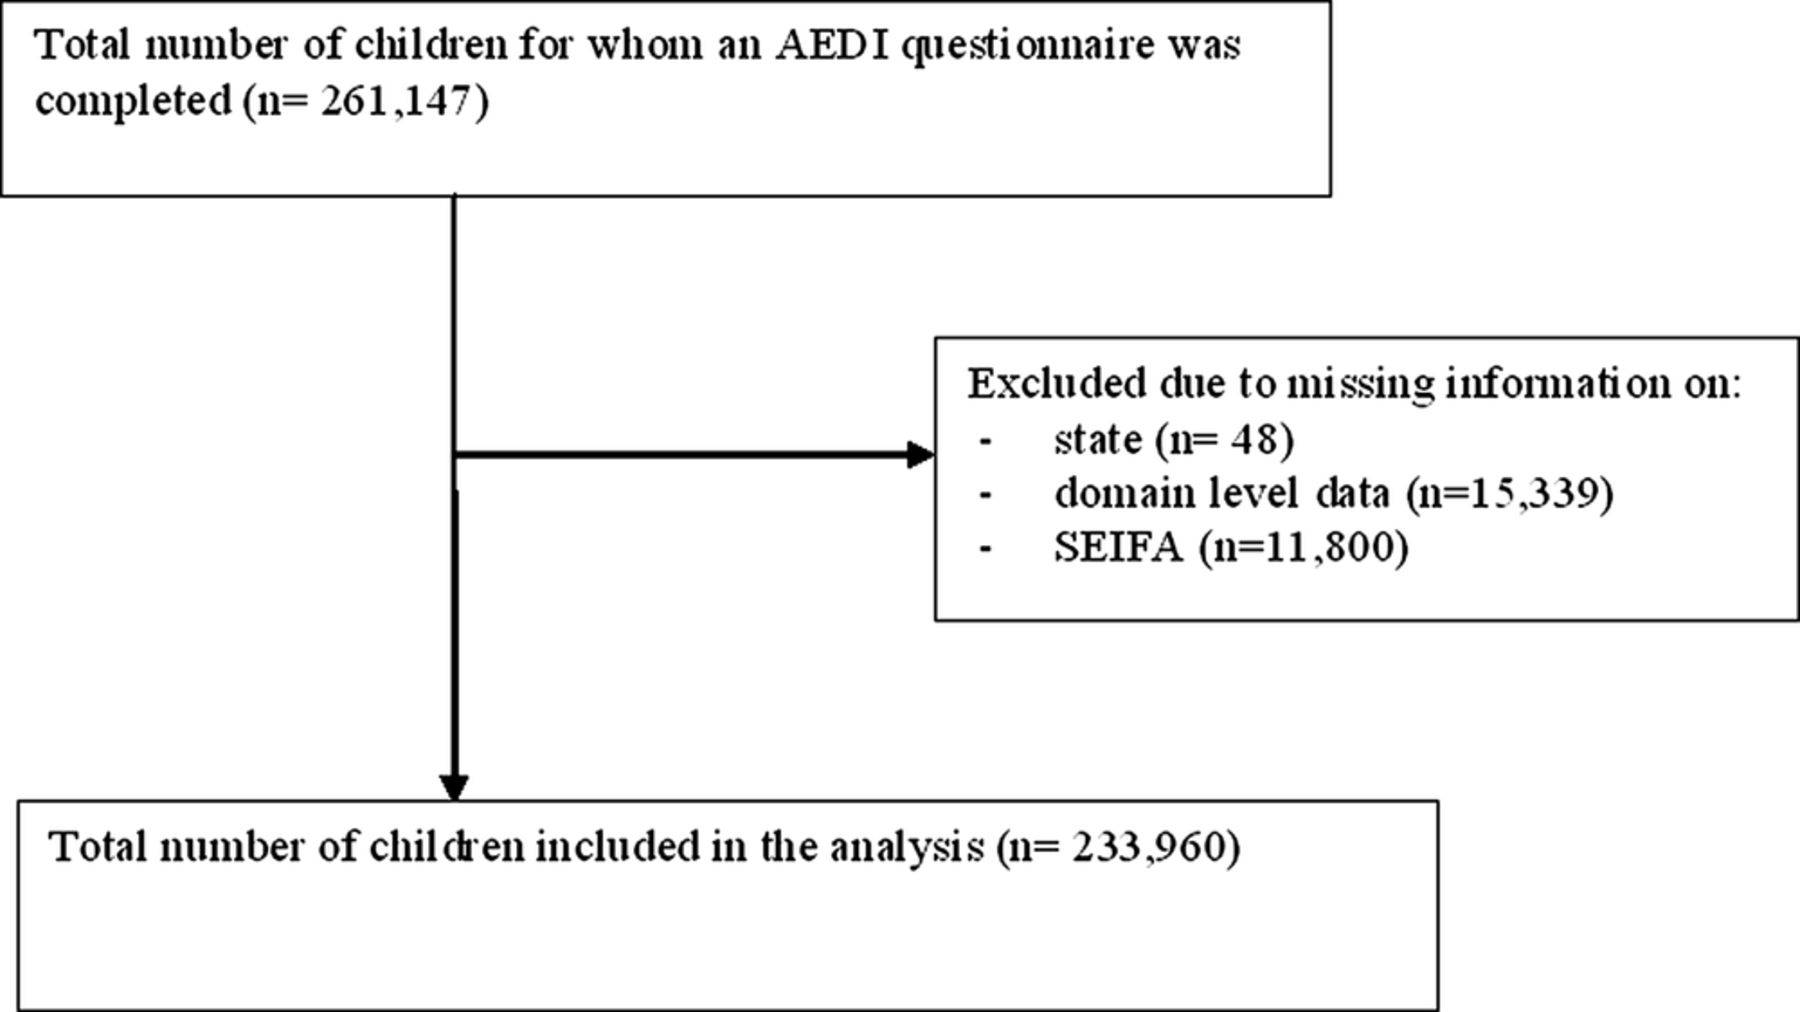
Between May and July 2009, all schools (government and non-government) across all states and territories in Australia participated in the AEDI. As shown in figure 1, information for 261 147 children in their first year of full-time school was collected by 14 628 teachers across Australia. This number of children represents a 97.5% participation rate when compared with the expected population of 5-year-olds. The number of children we were expecting (267 843) was based on the Australian Bureau of Statistics Estimated Resident Population for 5-year-olds, 31 March 2009.29 Of the children that did participate in the AEDI data collection, 89.6% (n=233 960) contributed to the analysis with 117 937 males and 116 023 females, and their characteristics are provided in table 1. The sample analysed thus represents 87.3% of the total population. The vast majority of children live in major cities, with the most populous states being New South Wales, Victoria and Queensland. A total of 4% of the children were of ATSI descent and approximately 12% of all children spoke English as a second language. The AEDI was not completed for children whose parent/guardian opted-out or in the situation where the teacher had known the child for less than 1 month and felt that they did not know the child well enough to complete the checklist.18
Sociodemographic characteristics of children for whom an AEDI was completed and contributed to the analysis

Flow chart of participants.
Outcome
The AEDI is the outcome measure used to assess children's development. The Index is an adapted version of the Canadian Early Development Instrument.16 ,30 Both the Canadian and the Australian version of the instrument have been shown to have sound validity.30–35 The AEDI is a 95-item, teacher-completed questionnaire designed to measure five domains of child development: Physical health and well-being, Language and cognitive skills, Emotional maturity, Social competence and Communication skills and general knowledge.36
Teachers complete the AEDI for each child in their class on the basis of their knowledge of the children. Children are not required to be present when the information is entered into the secure web-based data entry system. Each item on the checklist is either dichotomous (yes/no) or a Likert scale response (eg, very good/good, average and poor/very poor). The data were collected across the country over a 3 month time period (May–July 2009).
Domain scores range between 0 and 10 and are calculated as a mean score of all valid answers. Higher scores indicate a higher level of development for that domain. Children who score below the 10th percentile of the national AEDI population for an individual domain (eg, emotional maturity) are categorised as ‘developmentally vulnerable’ with all other children categorised as ‘not developmentally vulnerable’ for that domain. The classification of developmentally vulnerable is age standardised, with the 10th percentile calculated for 4-year-olds, 5-year-olds and 6-year-olds separately. The National Progress Measure is the proportion of children who are developmentally vulnerable on one or more of the five domains.
Covariates
Index of relative socioeconomic advantage and disadvantage
The Australian Bureau of Statistics releases on the basis of census information four different Socio-Economic Indices for Areas (SEIFA). The SEIFA indices are generally known as an indicator of people's ‘access to material and social resources and their ability to participate in society; relative to what is commonly experienced or accepted by the wider community’.36 The index utilised for this manuscript was the Index of Relative Socio-economic Advantage and Disadvantage (SEIFA IRSAD).37 The SEIFA IRSAD is calculated via Principal Components Analysis using 21 indicator variables from the census. The index is ordinal and ranges from around 200 to 1200 with a mean of 1000 and SD of 100; however, this score has been categorised to deciles as part of the confidentialisation process undertaken by the Australian Bureau of Statistics (ABS) with the lowest decile representing the most disadvantaged areas.37
The index reflects the average socioeconomic status of people and households in the area. SEIFA IRSAD has been applied to the AEDI data file on the basis of the child's suburb (neighbourhood) of residence.38 A suburb is determined by the Local Council and helps define a household's address. Suburbs vary widely in population density, depending on the housing types and distance from the central city. In general, when a person is asked where they live by another person residing within that same state, they generally respond to the question with their suburb of residence. In the rural and remote areas where suburbs do not exist, SEIFA IRSAD was applied at the smallest level of geography on the basis of their address details provided by the teacher upon completing the AEDI.38 Where possible, the Australian Bureau of Statistic's Geospatial unit called Collection Districts were assigned to the address details of the child. Collection Districts have no meaning to people as they are simply the collection district in which a census collector works. The geographical size of Collection Districts varies across Australia particularly in the rural and remote areas; however, a technical report published by the Australian Bureau of Statistics shows the robustness of SEIFA.37
Aboriginal and Torres Strait Islander
ATSI background is collected with the AEDI. ATSI was recorded on the basis of school enrolment records, and thus reflects the parent/guardian's report of their child's ATSI status.
English as a second language
Teachers classified children as having English as a Second Language (ESL) where English was not their first language and where they needed additional instruction in English or where their English was not yet proficient.
Statistical analyses
A dichotomous variable was created indicating whether the child was in the bottom 10th percentile (developmentally vulnerable) or not for each of the five domains, and developmentally vulnerable on one or more domains. Children, were excluded in the calculation of developmentally vulnerable on one or more domain if they were; identified as having special needs, were recorded as 3 years old, or had less than four valid domain scores (n=11 484).18 ,39 In Australia, children should not be attending full-time schooling if they are only 3 years old, and were therefore excluded.
As our primary interest was to investigate jurisdictional and socioeconomic inequality of child developmental vulnerability we utilised two nested fixed-effects logistic regression models. Model 1 considers only state as the covariate. For being developmentally vulnerable on one or more domain (DV1+) variable the model is:
where  is the probability of a child being developmentally vulnerable on one or more domains for the ith observation in the jth class of the state variable, α is the intercept and βj is the coefficient for the state. Model 2 considers three additional covariates for jurisdictional variation of child vulnerability. Again for same dependent variable DV1+ the full model is defined as
where  ,
,  ,
,  and
and  are the coefficients for four covariates: state, ATSI status, ESL status and SEIFA IRSAD, respectively. All models are estimated separately for males and females. Similar models are used for each of the domain-specific outcomes.
To examine socioeconomic inequalities in developmental vulnerability we computed the slope index of inequality (SII).40 ,41 In this circumstance we use the SII to measure the absolute developmental vulnerability gap between the lowest and highest SEIFA IRSAD deciles within jurisdictions in Australia. The computational process of creating the SII is
-
Compute the proportion of total children (ti) for the ordered (lowest to highest) classes of SEIFA IRSAD deciles
 .
. -
Compute the cumulative proportion of children for each SEIFA IRSAD class (ci) and then give a score based on the midpoint of its range in the cumulative distribution in the children
. -
Compute the proportion of developmentally vulnerable children for ith class (ri).
-
Values of ri then are plotted against the values of xi and a regression line is fitted to the data. Thus, the SII is the absolute value of the slope coefficient of the regression line from lowest to highest SEIFA IRSAD score.


The SII was calculated separately for males and females. All analyses were carried out using SAS software V.9.2.
Results
Table 2 shows the association between geographic and sociodemographic characteristics and the probability of being developmentally vulnerable on one or more AEDI domain by sex. ATSI children were more likely to be developmentally vulnerable compared to non-ATSI children (OR 2.16 males; 95% CI 2.03 to 2.30 OR 2.42 females; 95% CI 2.27 to 2.58); those for whom English was not their first language were more likely to be developmentally vulnerable (OR 2.06 males; 95% CI 1.99 to 2.14 OR 2.43 females; 95% CI 2.33 to 2.54) and for every decile increase in SEIFA IRSAD there was a decreasing odds of being developmentally vulnerable (OR 0.92 males; 95% CI 0.91 to 0.92 and OR 0.91 females; 95% CI 0.90 to 0.91).
ORs (95% CI) estimates for children developmentally vulnerable on one or more domains by geographic and sociodemographic characteristics in Australia
Model 1 in table 2 shows that for both sexes, compared to New South Wales (reference group), children living in Queensland had the highest odds (OR 1.70 males; 95% CI 1.64 to 1.75 and OR females 1.42; 95% CI 1.37 to 1.49) of being developmentally vulnerable followed by children living in Western Australia, South Australia, ACT, Tasmania and Victoria. After adjusting for ATSI, ESL and SEIFA IRSAD (Model 2) Queensland children for both sexes remained the most developmentally vulnerable (OR 1.80 males; 95% CI 1.74 to 1.87 and OR females 1.52; 95% CI 1.46 to 1.59). However, after adjustment, compared to Model 1, there was a shift in the ranking of developmental vulnerability by jurisdiction, with the odds of vulnerability increasing substantially for children living in the ACT and Western Australia.
Results presented in tables 3 and 4 show the association between geographic and sociodemographic characteristics and the probability of being developmentally vulnerable on each AEDI domain by sex. The general pattern showing large jurisdictional differences after controlling for the covariates is consistent across each of the five developmental domains with children in Queensland and the ACT showing higher vulnerability compared to children living in the other jurisdictions. In Queensland, when looking across the five domains, there is little difference found between the ORs in Models 1 and 2 for physical health and well-being, social competence and emotional maturity. However, controlling for the covariates increases the odds of vulnerability for both language and cognitive and communication and general skills. This pattern is consistent across males and females. In contrast to this, children living in the ACT show increased odds across all five developmental domains when controlling for covariates.
ORs (95% CI) for male children developmentally vulnerable on each domain by jurisdiction and sociodemographic characteristics (n=117937)
ORs (95% CI) for female children developmentally vulnerable on each domain by jurisdiction and sociodemographic characteristics (n=116023)
For all five domains, both ATSI and ESL children have increased odds of vulnerability compared to non-ATSI and non-ESL children, respectively. It is noteworthy that inequality between ATSI and non-ATSI children is greater for females than for males. For instance, on the physical health and well-being domain, the OR for male ATSI children is 1.81 (95% CI 1.68 to 1.95) compared with 2.38 for female ATSI children (95% CI 2.19 to 2.58). For ATSI children the greatest inequality when compared with non-ATSI is for the Language and cognitive development domain (OR 2.59 males; 95% CI 2.42 to 2.78 and OR females 3.01; 95% CI 2.78 to 3.25). For children with ESL status the highest ORs were found for the Communication skills and general knowledge domain with 4.19 (95% CI 4.01 to 4.37) for males and 5.16 (95% CI 4.89 to 5.44) for females.
Figure 2 shows the joint variation across Australian states and territories of child vulnerability on one or more domain according to (1) adjusted predicted average levels of vulnerability in the state or territory and (2) the slope index of inequality (absolute) based on SEIFA IRSAD. The predicted average levels of vulnerability were adjusted by ESL, ATSI and SEIFA IRSAD. Ideally, jurisdictions should be in the bottom left-hand quadrant with lower overall levels of vulnerability and lower absolute social inequality. A SII figure of say 22 indicates that there is an absolute difference of 22 percentage point in developmental vulnerability from the lowest to the highest SEIFA IRSAD decile. Thus, the higher the SII value, the greater the absolute level of inequality within the state. The scales of the x-axes are the same to show the lower overall vulnerability of females (median vulnerability about 15%) compared to males (median vulnerability about 29%). Across all jurisdictions males experience higher inequality and higher median levels of developmental vulnerability compared to females. For males and females, the smallest levels of inequality and developmental vulnerability are found in New South Wales and Tasmania whereas the largest inequalities and highest levels of developmental vulnerability are found in Western Australia and Queensland. Children in Victoria and South Australia have higher levels of inequality but lower vulnerability, while children in the ACT experience lower levels of inequality yet higher vulnerability.

Adjusted* prevalence of vulnerability (%) on one or more AEDI domains and absolute socioeconomic inequality (%) by jurisdiction.
The inequality difference between states varies significantly with the lowest and highest levels of inequality for males being 12.6 (lowest level of inequality in Tasmania and highest level in South Australia) and for females is 8.2 (lowest level of inequality found in the ACT and highest inequality in Western Australia). The difference in overall developmental vulnerability for males between the top (New South Wales) and bottom (Queensland) states is 12.5 percentage points and for females it is 7.1 (top=Tasmania and bottom=Queensland). The magnitude of these inequalities varies considerably between and within jurisdiction by sex. The difference in inequality between males and females is smallest in Tasmania (difference 1.24), then New South Wales (difference 2.03) followed by Victoria (difference 4.85), Queensland (difference 5.07), Western Australia (difference 5.83) and the ACT (difference 7) with the highest level of inequality between males and females found in South Australia (difference 10.82).
Children residing in the most disadvantaged areas (SEIFA IRSAD decile 1) in New South Wales and Tasmania recorded the same proportion of children developmentally vulnerable (27%) as those children residing in the middle of the SEIFA IRSAD range (decile 5) in Western Australia and the ACT and the lower end of the socioeconomic range (decile 8) in Queensland. Those children living in the most advantaged areas in Queensland (decile 10) recorded a similar proportion of children developmentally vulnerability as children residing in the poorer areas of New South Wales, Tasmania, South Australia and Victoria (deciles 2–3).
Despite acknowledged universal availability of health services in Australia, there is a marked variation in what the states and territories provide to families with young children. Table 5 shows the published schedules for maternal and child health services as well as preschool services offered within the different jurisdictions. These two services represent the main universal systems available to most Australian families. This table suggests that such services vary across the jurisdictions. While any statistical analyses of association are not possible with such broad data, a descriptive approach highlights the concordance with some of the results on the AEDI. Queensland, where the services are not universal, has the lowest preschool attendance and one of the highest children to staff ratios. New South Wales, Tasmania and Victoria appear to have the most comprehensive universal early years’ service coverage—and in two of these three states (New South Wales and Tasmania) the level of inequality in child developmental vulnerability is the smallest.
Documented universal services offered in each of the Australian jurisdictions prior to school
Discussion
Population-wide data have enabled Australia to be the first nation to quantify patterns of early child health and development across its different jurisdictional boundaries with their associated socioeconomic and demographic diversity. The work here provides the first national population benchmarks of some aspects of early childhood development as this pertains to readiness to learn at school. The data illuminate striking differences in early capacities that are strongly associated with socioeconomic and demographic circumstances.
Controlling for socioeconomic and demographic covariates reveals significant variations in developmental vulnerabilities across the states and territories. At the outset we acknowledge that there are socioeconomic and demographic determinants that are not fully captured by the models presented owing to their limited availability in the CURF. Nonetheless, it is both heartening and disturbing to discover such differences across jurisdictions. It is heartening because it highlights that child health and development may be improved by factors other than socioeconomic and demographic factors. However, it is disturbing to note that in a wealthy country where universal health coverage, mandated education and public health provision are available, and where there is still a reasonable social safety net, there are nevertheless striking disparities in levels of early child development. Why is it, for example, that after controlling for the standard socioeconomic and demographic factors, a child residing in Queensland relative to a child residing in New South Wales, has an increased odds of being developmentally vulnerable by the time they reach school entry (males OR 1.80; 95% CI 1.74 to 1.87; females OR 1.52; 95% CI 1.46 to 1.59)? There is little doubt that these differences would be reduced by more extensive socioeconomic and demographic controls but this is unlikely to explain all the residual differences within and across jurisdictions. This raises the question of whether differing policies, contexts and mix of services that support children and their families from birth to school age across the jurisdictions in Australia contribute to such inequalities? The marked variation demonstrated in table 5 suggests this to be a possibility.
In South Australia the maternal and child health schedule moves quickly from a universal to an active targeted service; however, all mothers not in the targeted service who wish to see a child health nurse can still visit the clinics. In South Australia almost all families have a Universal Contact Visit within the first 2 weeks after birth of their baby. On the basis of the nurse's assessment, mothers who have risk factors such as being young, socially isolated or having mental health issues are offered further intensive home visits. These visits are extensive with weekly sessions between weeks 3 and 8, followed by fortnightly visits up to 8 months, and then monthly visits until the child is 2 years old. The targeted schedule includes a total of 34 visits in the first 2 years of the child's life.43 In Tasmania, ACT and New South Wales a universal home visit is also conducted and then the state-specific scheduled development checks for all families are offered. In Victoria, even though funded by the state government, the services are delivered by local governments adding a different context to the ‘shop front’. New South Wales is the only state with an antenatal health check-up that identifies vulnerable families early. These families are then referred onto secondary services where necessary.51 ,52 In Western Australia, a universal service is offered in the first 10 days after birth and then nurses aim to provide a total of six contacts.53 In Queensland the government has no universal maternal and child health service and Queensland is also the state with the lowest preschool attendance.48 ,50
In addition to the variability across jurisdictions in the delivery of maternal and child health services and the level of access to these services, there are also differences in the rate of investment in these services relative to population growth. For example, in Western Australia service delivery has not kept pace with the population growth. The Western Australia Children's Commissioner in a submission to a Justice Standing Committee noted that although the birth rate had increased 16% over the previous years there had not been a concomitant increase in the number of child health nurses, school health nurses, Aboriginal health workers or investments in child health services. The Commissioner's figures revealed that despite the published Child and Maternal Health Schedule there was only one child health nurse for every 167 births (whereas most other jurisdictions had ratios between 1:78 and 1:98).49
While it may be tempting to make strong claims about the covariation in AEDI results with models and levels of human service delivery in the various Australian jurisdictions, a much more extensive investigation is required to move towards any causal interpretation. For example, controlling for the covariates increases the odds of developmental vulnerability for children living within the ACT. Just why this should be so, given the shallower socioeconomic gradient in this jurisdiction (with no children recorded in the poorest five deciles of SEIFA IRSAD), is unclear. Why then, despite the ACT being a relatively wealthy state with lower socioeconomic inequality, do we see increased odds for vulnerability across all five of the developmental domains?
Gender differences are evident in these data. There are well-documented gender differences in brain development of young children.54 ,55 At early ages in particular, boys develop at a slower rate than girls,56 and there is evidence that different areas of the brain develop in a different sequence in girls compared with most boys.57 This is consistently evident within the Early Development Instrument (EDI)30 and AEDI results.18 However, within gender there are significant differences for boys and girls residing in different jurisdictions, and socioeconomic and demographic contexts. What are the contextual factors in South Australia that lead to both the greatest inequality difference between males and females and also the greatest degree of inequality within the male gender compared to other jurisdictions? This is in contrast to a smaller gap between boys and girls living in Tasmania and New South Wales, and both of these jurisdictions show the lowest level of inequality while still also maintaining lower levels of developmental vulnerability overall.
Across all five of the AEDI domains both Aboriginal and ESL children have increased odds of vulnerability compared with non-Aboriginal and non-ESL children, respectively. Of interest is that the inequality between Aboriginal and non-Aboriginal children is greater for females than for males particularly on the Physical health and well-being domain, where the OR for male Aboriginal children is 1.81 (95% CI 1.68 to 1.95) compared with 2.38 for female Aboriginal children (95% CI 2.19 to 2.58). However, the greatest inequality gap between Aboriginal and non-Aboriginal children is found on the language and cognitive development domain irrespective of gender (OR 2.59 males; 95% CI 2.42 to 2.78 and OR females 3.01; 95% CI 2.78 to 3.25). Interestingly, although SEIFA IRSAD has a large impact on each of the five AEDI domains, it is the Language and cognitive domain that is influenced the greatest by the socioeconomic index.
For children with ESL status the highest ORs for vulnerability were found for the Communication skills and general knowledge domain with an OR of 4.19 for males (95% CI 4.01 to 4.37) and an OR of 5.16 for females (95% CI 4.89 to 5.44). The results need to be considered in light of the fact that the AEDI measures school based communication skills in English as English is the main language of instruction in Australian schools. Results reported elsewhere have shown that children who speak another language but are additionally proficient in English show the lowest levels of developmental vulnerabilities across each of the five domains; however, those that are not proficient in English (independent of ESL status) show poorer results on the AEDI.18 ,58 ,59
It is worth mentioning that the covariates ATSI and ESL do not show significant overlap. Of those children who are defined as ATSI, only 20% are classified as ESL. Whereas, of those children classified as ESL by the teacher, only 7% are defined as having ATSI status. In total, less than 1% of the entire sample were both of ATSI decent and classified by the teachers as having ESL.
The AEDI will be repeated once every 3 years (ie, 2012, 2015, 2018, etc). This will enable onward monitoring and surveillance and create opportunities to examine the effects of policies and interventions. This will require political will and leadership as well as the capitalisation of this opportunity by the scientific community and those interested in human service evaluation. The onward implementation of the AEDI also encourages efforts in establishing a longitudinal capacity (ie, following the same child/person over time) to illuminate the pathways leading to a variety of human development outcomes. Among such life course outcomes are those pertaining to health/ill-health as well as wider outcomes pertaining to social, economic and civic participation.
In Australia there are robust administrative data linkage methodologies, some longstanding and well established, that are currently being assessed for their potential to use AEDI data to prospectively estimate the human development benefits of early childhood opportunities, environments and services on later life course outcomes. It is possible to construct crosswalks between health, early child development and education databases that integrate population-wide, person-specific data at national, provincial and community levels.60 As such, it is possible to create a historical perspective of developmental trajectories for an entire population of children.
Australia is now progressing towards national data linkage with jurisdiction based ‘nodes’ working together under a national network (the Population Health Research Network) that will allow researchers to access linked data that are de-identified. The systems will improve Australia's ability to monitor health and health inequalities using data already collected by social services including primarily health but also education and family and community services. In Western Australia and New South Wales data linkage systems have been operating for over 10 years;61 however, the national network with significant infrastructure investment from the federal and state governments aims to provide the world's most comprehensive population health database to monitor and study health across the country.62 The 2009 AEDI dataset is currently being linked into this national network of jurisdictional-based nodes.
Currently, there are a number of interventions aimed at improving child development that show demonstrated efficacy.15 However, there are still insufficient data to inform policies and practices to reduce inequalities in early child development. With linked population data sets programme/policy evaluation and economic models can also be investigated (such as the effectiveness of preventive interventions which are traditionally hard to quantify). Such systems will be invaluable tools for assessing the efficacy and effectiveness of policies and interventions that aim to reduce inequalities in health and development across populations.3
The EDI is gaining attention internationally with the instrument now being utilised in over a dozen countries.35 Part of the attraction is that the EDI is administered just like a census and is a holistic measure of child health and development. Regular monitoring of inequalities and use of these data for education, advocacy and increased accountability among the general public and decision makers is urgently needed, but alone will not be sufficient.63 Equity of opportunity and access must be a priority in the design of policies and interventions. The AEDI provides a critical measure in a developmental stage that is otherwise surprisingly uncharted in the life course trajectory given the contemporary claims placed on the importance of optimising development at early points in life.
Acknowledgments
The 2009 AEDI data collection was conducted by the Centre for Community Child Health (at The Royal Children's Hospital Melbourne, and a key research centre at the Murdoch Childrens Research Institute) in partnership with the Telethon Institute for Child Health Research in Perth.
References
Footnotes
-
Contributors SB, JL, SS, VC and SZ conceived the original idea and structure of the paper. SB led and wrote the majority of the paper. AG and AR contributed to the methods and results section, with AR and MM undertaking responsibility for the analyses under direction by JL and SB. TG compiled the universal policy analyses. SG directed the 2009 AEDI data collection in conjunction with SB, SS and SZ. MJ is the original developer of the EDI on which the AEDI is based. MJ and CH provided advocacy, guidance and support to SB specifically, and to the Australian governments and local communities in the design and implementation of the EDI as a census. All authors provided input to various drafts of the paper. SB acts as the guarantor for the paper and takes responsibility for the integrity of the work as a whole, from inception to published article. All authors have approved the final version of the paper.
-
Funding SB, SG and TG's salaries are part supported by the Department of Education, Employment and Workplace Relations (DEEWR) to support the AEDI. JL is supported by a National Health and Medical Research Council, Australia Fellowship Award that supports AR and MM. The AEDI is funded by the Australian Government's Department of Education, Employment and Workplace Relations (DEEWR) who have also made the AEDI Confidentialised Unit Record File available to authors SB, JL, VC, SZ, SS, AG, MJ and SG.
-
Disclaimer The findings and views reported in this paper are those of the authors and should not be attributed to DEEWR, the Centre for Community Child Health or the Telethon Institute for Child Health Research.
-
Competing interests None.
-
Patient consent Obtained.
-
Ethics approval Royal Childrens Hospital, Vitoria, Human Research Ethics Committee.
-
Provenance and peer review Not commissioned; externally peer reviewed.
-
Data sharing statement This study utilises the Confidentialised AEDI Unit Record File. This data file is available to all academics upon request and approval by the Federal Government of Australia.