Article Text

Abstract
Objective To evaluate the effectiveness and safety of metformin use in clinical practice in a large sample of pharmacologically treated patients with type 2 diabetes and different levels of renal function.
Design Observational study between July 2004 and December 2010, mean follow-up 3.9 years.
Setting Hospital outpatient clinics and primary care in Sweden.
Participants 51 675 men and women with type 2 diabetes, registered in the Swedish National Diabetes Register, and on continuous glucose-lowering treatment with oral hypoglycaemic agents (OHAs) or insulin.
Main outcome measures Risks of cardiovascular disease (CVD), all-cause mortality and acidosis/serious infection, associated with each treatment regimens, were analysed in all patients and in subgroups with different estimated glomerular filtration rate (eGFR) intervals. Covariance adjustment and propensity scores were used to adjust for several baseline risk factors and characteristics at Cox regression.
Results Compared with metformin in monotherapy, HRs for fatal/non-fatal CVD and all-cause mortality with all other OHAs combined (approximately 80% sulphonylureas) in monotherapy were 1.02 (95% CI 0.93 to 1.12) and 1.13 (1.01 to 1.27), while 1.18 (1.07 to 1.29) and 1.34 (1.19 to 1.50) with insulin in monotherapy, adjusting using propensity scores. Metformin, compared with any other treatment, showed reduced risks of acidosis/serious infection (adjusted HR 0.85, 95% CI 0.74 to 0.97) and all-cause mortality (HR 0.87, 95% CI 0.77 to 0.99), in patients with eGFR 45–60 ml/min/1.73 m2, and no increased risks of all-cause mortality, acidosis/serious infection or CVD were found in patients with eGFR 30–45 ml/min/1.73 m2.
Conclusions Metformin showed lower risk than insulin for CVD and all-cause mortality and slightly lower risk for all-cause mortality compared with other OHA, in these 51 675 patients followed for 4 years. Patients with renal impairment showed no increased risk of CVD, all-cause mortality or acidosis/serious infection. In clinical practice, the benefits of metformin use clearly outbalance the risk of severe side effects.
This is an open-access article distributed under the terms of the Creative Commons Attribution Non-commercial License, which permits use, distribution, and reproduction in any medium, provided the original work is properly cited, the use is non commercial and is otherwise in compliance with the license. See: http://creativecommons.org/licenses/by-nc/2.0/ and http://creativecommons.org/licenses/by-nc/2.0/legalcode.
Statistics from Altmetric.com
Article summary
Article focus
To evaluate the risks of CVD, acidosis/serious infection and mortality associated with metformin and other glucose-lowering treatments, in a cohort of 51 675 type 2 diabetes patients and in subgroups with different degrees of renal impairment.
Key messages
Metformin was associated with reduced risk of CVD, acidosis/serious infection and all-cause mortality compared with insulin and a reduced risk of all-cause mortality compared with other OHAs.
The effects were consistent in patients with renal impairment (eGFR 45–60 ml/min/1.73 m2), and there were no increased risk of acidosis/serious infection even in patients with low renal function (eGFR 30–45 ml/min/1.73 m2).
Strengths and limitations of this study
A large cohort with comprehensive data on patient characteristics was studied.
A composite end point including diagnosis of acidosis, shock, acute renal failure and serious infections was used to evaluate the occurrence of lactic acidosis.
Introduction
Type 2 diabetes mellitus (DM2) is a common disease, which causes major morbidity and mortality due to micro- and macrovascular complications.1 A range of glucose-lowering agents with different properties aims at preventing these complications. The UK Prospective Diabetes Study (UKPDS) demonstrated a reduced risk of all-cause mortality in the subgroup of obese DM2 patients treated with metformin compared with sulphonylureas, insulin or diet alone.2 ,3 Further beneficial effects with metformin have been recognised.4 ,5 Thus, international treatment guidelines recommend metformin as first-line pharmacological treatment in DM2 patients primarily based on the results from the UKPDS substudy including 342 patients on metformin.6–9
Metformin have been considered causing increased risk of lactic acidosis. Consequently, metformin treatments have been contraindicated in patients at risk of developing lactic acidosis, for example, patients with cardiovascular and renal disease.10 Given the high prevalence of micro- and macrovascular disease in the DM2 population,11 a relatively large proportion was comprehended by the contraindications. However, several studies have suggested this concern to be exaggerated.12–14
In the light of these findings, most guidelines have become less strict towards metformin treatment in these patients.6 ,8 However, there is still a great need for clinical and epidemiological studies investigating the overall effects of metformin in patients considered vulnerable to such treatment. Therefore, the aim of this survey was to investigate benefits and risks associated with different glucose-lowering medications, in a cohort of 51 675 DM2 patients in clinical practice and in subgroups of patients with different degrees of renal impairment.
Material and methods
In this population-based longitudinal study information was linked from four national registers in Sweden: the National Diabetes Register (NDR), the prescribed drug register,15 the patient register and the cause of death register.16 ,17 The NDR is based and administered in Gothenburg, Sweden. Since the establishment in 1996, NDR has been working with systematic quality improvement, research and development in the field of diabetes mellitus. In 2009, NDR covered 262 333 patients with type 1 diabetes mellitus and DM2.18–21 Physicians and nurses in hospital outpatient clinics and primary healthcare clinics report to the NDR at least annually via the internet or via direct transfer of data from medical record databases. All included patients have agreed to be registered before inclusion.
Study population
This study, approved by the central ethical review board at the University of Gothenburg, comprises 51 675 DM2 patients. All pharmacologically treated DM2 patients aged ≥40 to <85 years and registered in the NDR between 1 July 2004 and 31 December 2007 were eligible for inclusion in the study (online appendix figure 1). DM2 was defined as treatment with diet only, oral hypoglycaemic agents (OHAs) only or onset age of diabetes ≥40 years and treatment with insulin only or combined with OHA. Patients had to be registered in the NDR 1 year prior to and 1 year following their first prescription of glucose-lowering treatment. In order to achieve adequate length of the follow-up period, they had to be initiated on glucose-lowering treatment before 2007 to be included.
In each patient, baseline was defined as occurring after 12 months of continuous use of the prescribed glucose-lowering medication. Only patients who had filled at least three prescriptions or 18 fills of multidose dispensed drugs during this 12-month period were included in the study. Patients who had collected both ordinary prescriptions and multidose dispensed drugs were excluded. Thus, 12 months of continuous glucose-lowering medication at baseline was ensured. The patients were classified according to glucose-lowering treatment, and clinical characteristics were analysed at baseline. All patients with data available for the analysed variables were included. Other OHA consisted of patients treated with all OHAs other than metformin. The majority of this group (approximately 80%) was treated with sulphonylureas (SU).
Baseline
Variables assessed at baseline are presented in table 1. History of congestive heart failure (CHF) and cardiovascular disease (CVD) were defined as at least one event of CHF or CVD, respectively, anytime between the year of 1987 and the start of the study. History of serious infections was defined as at least one severe infection within 6 months prior to baseline and the variable previous hospitalisation as hospitalisation for at least three consecutive days within 6 months prior to baseline.
Baseline characteristics in all 51 675 type 2 diabetes patients and in groups based on glucose-lowering treatments
The patients were screened using methods applied at each local centre, but guidelines were available to ensure the use of similar methodology at all centres. Body mass index (BMI) was calculated as weight in kilograms divided by height in metres squared. A smoker was a patient smoking one or more cigarettes per day or a pipe daily or who had stopped smoking within the past 3 months. Cumulative microalbuminuria was defined as urine albumin excretion >20 μg/min in two of the three consecutive tests. Laboratory analyses, including total cholesterol and high-density lipoprotein-cholesterol (HDL-C), were carried out at local laboratories. HbA1c analyses are quality assured in Sweden by regular calibration with Mono-S, a high-performance liquid chromatography method. HbA1c values were converted to the National Glycohemoglobin Standardization Program standard levels.22 Non-HDL-C was calculated by subtracting HDL-C from total cholesterol. Estimated glomerular filtration rate (eGFR) was calculated using the Modification of Diet in Renal Disease equation.23
Follow-up
All patients were followed from baseline until the occurrence of an end point event, or otherwise, until censor date of 31 December 2010. Patients who experienced an end point event between first prescription and baseline were excluded from the analysis of that specific end point. Patients changing treatment during the study were not censored, and end point events were attributed the initial treatment. Mean follow-up was 3.9 years. The five end points analysed were any CVD, fatal CVD, any acidosis/serious infection, fatal acidosis/serious infection and all-cause mortality. CVD was defined as diagnosis of myocardial infarction, angina pectoris, intracerebral haemorrhage, cerebral infarction, unspecified stroke, peripheral vascular disease, or intervention with percutaneous coronary intervention or coronary artery bypass grafting, whichever occurred first. Acidosis/serious infection was defined as diagnosis of acidosis, serious infection, shock or acute renal failure, which are frequently associated with lactic acidosis. Serious infections requiring hospitalisation for anti-infectious treatment as well as acidosis, shock and acute renal failure requiring treatment in hospital, usually intensive care thus, registered in the inpatient register, were included in the composite end point. The International Classifications of Diseases-10 codes for all end points are given in online appendix materials. A fatal event was defined as an event followed by death in the subsequent 28 days.
Statistical methods
Baseline characteristics were compared, unadjusted, using analysis of variance and logistic regression (table 1). Propensity scores were estimated using boosted CART24 since logistic regression did not achieve good balance. Baseline characteristics were then compared using logistic regression or OLS regression, adjusted for octiles of the propensity score (online appendix table 1). Unadjusted survival of the end points by treatment groups in all patients was estimated with the Kaplan–Meier estimator (figure 1).

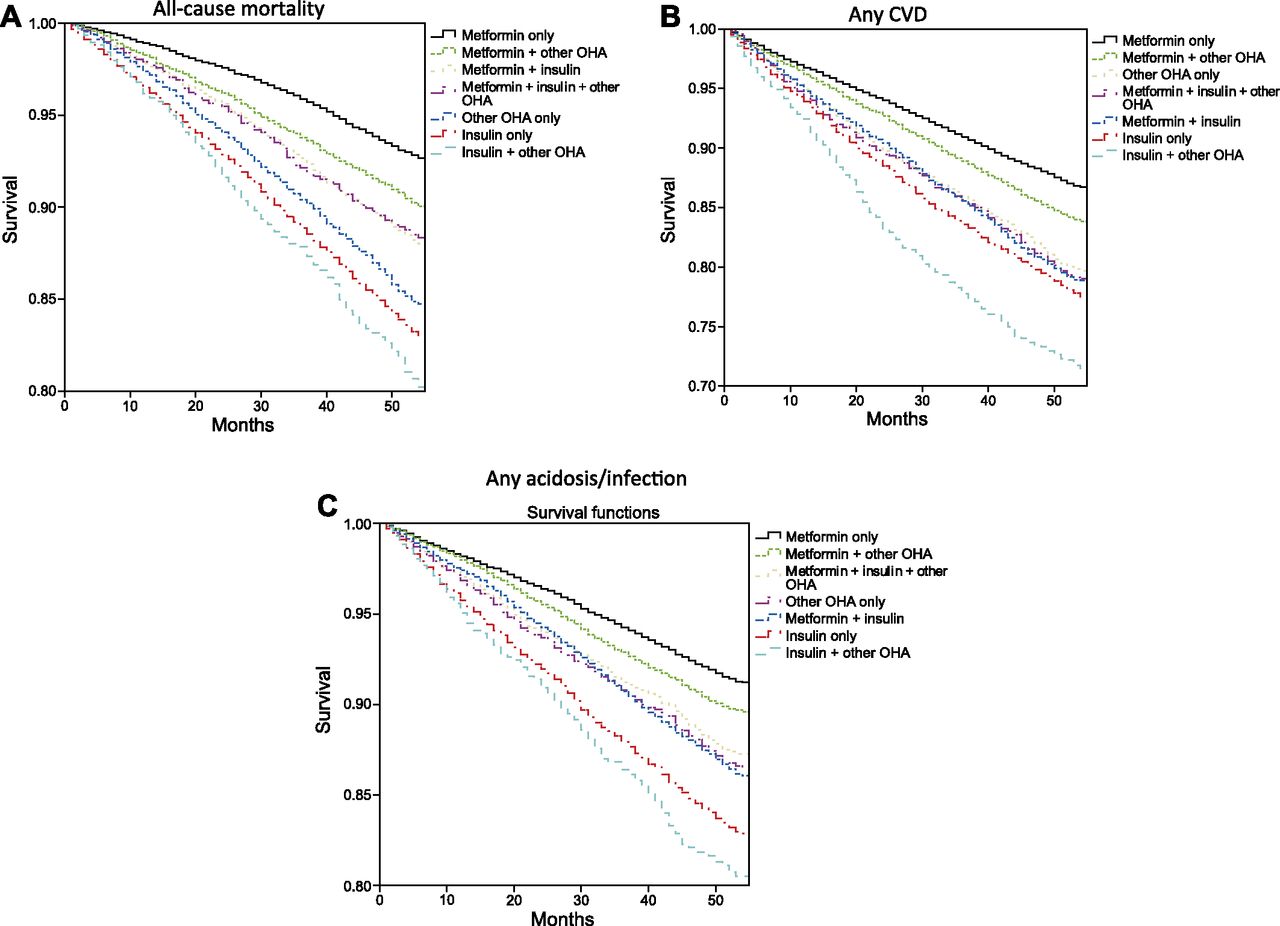
Time (months) to event of all-cause mortality (A), any cardiovascular disease (CVD) (B) and any acidosis/serious infection (C) in each treatment group, unadjusted. OHA, oral hypoglycaemic agent.
Cox regression models were used to estimate HRs for all end points in groups of patients with different glucose-lowering treatments and metformin only as reference. Adjustments were made for age, sex, diabetes duration, HbA1c, non-HDL-C, BMI, smoking, eGFR, multidose dispensation, previous hospitalisation, history of CVD and CHF, microalbuminuria, and treatment with antihypertensive agents, lipid-lowering agents and cardiac glycosides (table 2). HRs were also estimated in patients with insulin only or other OHA only compared with metformin only, adjusted by stratification for octiles of propensity scores as described above (table 3). HRs were estimated in subgroups with different eGFR intervals (table 4), for metformin, insulin or other OHA, with any other glucose-lowering treatment as reference. Adjustment was made for same covariates as in table 2.
Adjusted HRs with 95% CIs for any CVD, fatal CVD, any acidosis/serious infection, fatal acidosis/serious infection and all-cause mortality in all patients, in each treatment group, and with metformin only as reference
Adjusted HRs with 95% CIs for any CVD, fatal CVD, any acidosis/serious infection, fatal acidosis/serious infection and all-cause mortality in patients with insulin only and patients with metformin only as reference or in patients with other OHA only and patients with metformin only as reference
Adjusted HRs with 95% CIs for any CVD, any acidosis/serious infection and all-cause mortality in subgroups of patients with different eGFR intervals
Functional form of continuous covariates was checked using a Kolmogorov-type supremum test,25 and in some models, it was found suitable to add a quadratic term for age or diabetes duration. The proportional hazards assumption was checked by including the interaction between covariates and log of follow-up time. Violations of the proportional hazards assumption were handled by stratifying on the violating covariate or by modelling the effect as time dependent.26 Additional checks of the form of the time dependence were made using plots of scaled Schoenfeld residuals.27
All statistical analyses were performed with SAS V.9.2 (SAS Institute), except Kaplan–Meier curves produced in SPSS V.18 (SPSS Inc.) and propensity scores estimated using the package TWANG in R (R Foundation for Statistical Computing). A two-sided p value <0.05 was considered statistically significant.
Results
Patients
Table 1 gives the distribution between treatments and clinical characteristics at baseline, unadjusted. The total population presented a mean (±SD) age of 65.3±9.8 years with mean diabetes duration of 9.4±8.0 years and a mean HbA1c of 7.3±3.3%. The proportion of women was 41.9%, and 14.0% of the population were smokers. Mean BMI was 29.5±5.1 kg/m2, mean systolic blood pressure 140 mm Hg, mean non-HDL 3.5 mmol/l and mean eGFR 78.1±21.9 ml/min/1.73 m2. History of CVD was found in 21.4% of population, history of CHF in 5.9% and history of serious infections in 2.9% . There were statistically significant differences between the groups defined for all variables. Patients on insulin-based treatments presented longer diabetes duration, higher mean HbA1c, more often microalbuminuria and history of CVD, CHF and serious infections than the population in general.
Patients treated with metformin generally presented high eGFR and BMI. Patients on metformin in monotherapy were the youngest participants, with the shortest diabetes duration, and had a low mean HbA1c. They also relatively seldom had history of CVD, CHF or serious infections. Patients treated with other OHA in monotherapy presented the highest mean age, the lowest mean HbA1c and the lowest mean BMI. After adjustment with propensity score, all differences in baseline characteristics except for history of CHF and BMI were erased (online appendix table 1). CHF and BMI were further adjusted for with stratification and as a covariate, respectively. Median daily doses of metformin were approximately 1100 mg in the metformin monotherapy group, 1700 mg in metformin + other OHA, 1700 mg in metformin + insulin and 1900 mg in metformin + insulin + other OHA.
Online appendix table 2 gives time of exposure to the glucose-lowering agents and proportions of patients changing treatment, in each group. The proportions changing treatment ranged between 56.5% and 93.9%. Comparison of baseline characteristics in patients who changed treatment and patients who did not change treatment showed significant differences, with, for example, more frequent history of CVD, CHF and serious infections in patients who did not change treatment (p<0.05).
Outcomes
Figure 1 shows unadjusted time to an event of all-cause mortality, any CVD and any acidosis/serious infection in each treatment group. The steepest decreases of curves were seen with insulin only and insulin in combination with other OHA. Table 2 gives HR with 95% CIs for all end points, adjusted for covariates as given in the table. All treatments were associated with significantly increased risks of all-cause mortality and any CVD compared with metformin only, with HR ranging from 1.47 (95% CI 1.35 to 1.61) to 1.15 (95% CI 1.05 to 1.27) for all-cause mortality and from 1.40 (95% CI 1.24 to 1.58) to 1.11 (95% CI 1.03 to 1.20) for any CVD. Insulin only and other OHA only also showed a significantly increased risk of fatal CVD. All treatments except metformin in combination with other OHA were associated with a significantly increased risk of any acidosis/serious infection, and insulin only or in combination with metformin showed an increased risk of fatal acidosis/serious infection. Relatively few fatal events occurred during follow-up (online appendix table 3), contributing to the wider CIs for these risk estimates. Similar results were seen when using other OHA only as reference group instead of metformin only (online appendix table 4). This analysis also showed significantly increased risks of all end points except fatal CVD associated with insulin only compared with other OHA only. Furthermore, insulin only or in combination with other glucose-lowering agents was constantly associated with increased risk of any CVD compared with other OHA only.
Table 3 gives HR with 95% CI for all end points with insulin only or other OHA only compared with metformin only, adjusted for propensity score. Insulin was associated with significantly increased risks of any CVD (HR 1.18, 95% CI 1.07 to 1.29), all-cause mortality (HR 1.34, 95% CI 1.19 to 1.50) and also any acidosis/serious infection and fatal acidosis/serious infection (HR 1.28, 95% CI 1.14 to 1.43 and HR 1.45, 95% CI 1.07 to 1.97, respectively). When comparing other OHA only to metformin only, a borderline significantly increased risk was seen for all-cause mortality (HR 1.13, 95% CI 1.01 to 1.27). The results were identical when analysing SU only instead of other OHA only and metformin only as reference, with significant HR for all-cause mortality. As shown in online appendix table 5, HR was 0.99 (95% CI 0.89 to 1.09) for any CVD, 1.01 (95% CI 0.82 to 1.25) for fatal CVD, 1.15 (95% CI 1.02 to 1.30) for all-cause mortality, 1.00 (95% CI 0.89 to 1.14) for any acidosis/serious infection and 1.17 (95% CI 0.85 to 1.60) for fatal acidosis/serious infection.
As shown in online appendix table 6, insulin in combination with metformin was associated with a reduced risk for all-cause mortality (HR 0.84, 95% CI 0.76 to 0.91) and any acidosis/serious infection (HR 0.86, 95% CI 0.79 to 0.94) when compared with insulin only. No reduced risk for CVD was seen. Insulin in combination with other OHA was not associated with reduced risk for any of the end points compared with insulin only.
Table 4 gives HR with 95% CI for any CVD, any acidosis/serious infection and all-cause mortality in subgroups of patients with different eGFR intervals, adjusted for covariates as given in the table. Treatments with metformin, insulin or other OHA in any combination were compared with any other treatment. Metformin-based treatments were associated with reduced risks of any acidosis/serious infection (HR 0.85, 95% CI 0.74 to 0.97) and all-cause mortality (HR 0.87, 95% CI 0.77 to 0.99) in the subgroup of patients with eGFR 45–60 ml/min/1.73 m2. Similar results were seen in the subgroup with eGFR >60 ml/min/1.73 m2 (HR 0.91, 95% CI 0.84 to 0.98) for any acidosis/serious infection and (HR 0.87, 95% CI 0.81 to 0.94) for all-cause mortality. Both insulin and other OHA were associated with increased risk of all-cause mortality in patients with eGFR >60 ml/min/1.73 m2. Insulin was also associated with increased risk of any acidosis/serious infection in patients with eGFR 30–45 or >60 ml/min/1.73 m2 and increased risk of any CVD in patients with eGFR 30–45, 45–60 or >60 ml/min/1.73 m2.
Discussion
This population-based observational study demonstrates beneficial effects of metformin in clinical practice. As expected, there were significant differences in clinical characteristics between the groups. These differences, however, disappeared after adjustment with propensity scores. Still, metformin in monotherapy showed a significantly reduced risk of any CVD, all-cause mortality, any acidosis/serious infection and fatal acidosis/serious infection compared with insulin in monotherapy. A borderline significant risk reduction of all-cause mortality was also shown compared with other OHA in monotherapy. Furthermore, there was no increased risk of severe outcomes in patients with impaired renal function.
The beneficial effects of metformin, shown in this survey, are generally consistent with previous findings. The UKPDS demonstrated a reduction in all-cause mortality in the subgroup of obese DM2 patients treated with metformin compared with diet, SU or insulin,2 also confirmed in a 10-year post-interventional follow-up.3 Furthermore, several recent observational studies have reported reduced risk with metformin compared with all other hypoglycaemic agents for coronary heart disease28 ,29 and for total mortality in patients with previous coronary heart disease,14 as also seen in this study for total mortality in patients with normal or slightly reduced renal function. In the present study, a reduced risk of total mortality was also found when comparing insulin in combination with metformin to insulin only, although not verifying a finding of reduced risk of macrovascular events in a small clinical trial comparing the addition of metformin to placebo in insulin-treated DM2 patients.4
Interestingly, we found somewhat reduced risk for total mortality, but not for CVD, with metformin only compared with SU only or other OHA only. These findings were also clearly demonstrated regarding total mortality in two large recent observational studies on DM2 patients from Denmark and Cleveland, USA.30 ,31 However, the Danish study also found reduced risk for CVD with metformin compared with SU,31 using a propensity score, including age, sex, comorbidities, income and cardiac drugs as covariates, and used the score for matching limiting included patients. Possibly our study using propensity score for stratification of all included patients, and also including traditional cardiovascular risk factors as covariates, may better reflect the risk difference between metformin and SU, an important matter for clinical practice with many patients still given SU.
The increased risk for CVD and total mortality with insulin found in the present study could be due to these patients presenting a more severe disease. However, adjustment was made for diabetes duration and HbA1c among other covariates, and an increased risk caused by insulin per se cannot be ruled out, as also has been underlined in other recent observational studies.28 ,29 ,32–35 Lifestyle measures with weight reduction may be of value for obese patients with insulin included as treatment. The on-going ORIGIN randomised trial evaluating the risk of CVD with insulin glargine compared with standard glucose-lowering treatment in patients with diabetes at high risk for vascular disease will give further information.36
Subgroup analyses with patients presenting different degrees of renal impairment were conducted and did not show any increased risk of CVD, acidosis/serious infection or all-cause mortality associated with metformin-based treatments in patients with eGFR 30–45, 45–60 or >60 ml/min/1.73 m2. Rather, metformin-based treatments were associated with reduced risks of all-cause mortality and acidosis/serious infection in patients with eGFR 45–60 or >60 ml/min/1.73 m2. The prevalence of renal impairment differed between the groups, with patients presenting an eGFR <45 ml/min/1.73 m2 being rare in metformin-based treatments. However, the prevalence of eGFR 45–60 ml/min/1.73 m2 ranged between 10.7% and 14.4% in these patients and did not differ much from other patients. Consequently, the subgroup with eGFR 45–60 ml/min/1.73 m2 was based on a surprisingly large material, while the subgroup with eGFR 30–45 ml/min/1.73 m2 constituted relatively few patients.
A recently published observational study examined the effects of metformin in 19 691 patients with diabetes and advanced CVD, thus considered vulnerable to metformin.14 The results indicated significantly reduced risk of all-cause mortality in patients treated with metformin compared with other glucose-lowering treatments. Results were consistent in a subgroup of patients with renal impairment (eGFR 30–60 ml/min/1.73 m2). The survey, however, only analysed all-cause mortality and could therefore not detect potential cases of lactic acidosis. Furthermore, the follow-up was short (2 years) and did not analyse patients with eGFR 30–45 and 45–60 ml/min/1.73 m2, separately. Furthermore, glucose-lowering treatments were only specified as metformin use or not, and no adjustments for crucial covariates such as HbA1c or diabetes duration were made. Several studies have failed to demonstrate increased incidence rate of lactic acidosis in DM2 patients treated with metformin. Thus, DM2 with its comorbidities or any glucose-lowering treatment rather than metformin use per se have been suggested to be risk factors for lactic acidosis.12
The large population, 51 675 DM2 patients, and extensive adjustments for many important covariates are apparent strengths of the present survey. Risk calculations were made, adjusted for covariates with propensity scores and in Cox regression models. The propensity score achieved perfectly well-balanced groups regarding baseline characteristics indicating the robustness of this statistical analysis. The Cox regression models enabled more comprehensive comparisons between several glucose-lowering regimens. Data are collected from the NDR database with a currently estimated coverage of more than 90% of all patients in hospital outpatient clinics and almost 80% of all patients in primary care in Sweden, suggesting it to be highly representative of clinical practice. Furthermore, we presented exposure time for the different glucose-lowering treatments and median daily doses of metformin in each treatment group, which showed clinically relevant doses.
Despite extensive adjustments, covariates of possible importance could have been missed. Thus, the presence of confounding by indication may not be fully avoided. Furthermore, patients who changed glucose-lowering treatment during the study were not censored. It could be that patients with advancing disease more frequently changed to a specific glucose-lowering medication, diluting the results observed. Comparison of baseline characteristics indicated higher proportions of history of CVD, CHF and serious infections in patients changing treatment. This could have affected the results, even though the proportions of patients changing treatment were high in all groups. Only eight cases of diagnosed lactic acidosis were reported during the follow-up (four cases in metformin only, two cases in metformin + insulin and two cases in insulin only) and thus analyses with lactic acidosis as an end point would not provide desirable strength. Therefore, a composite end point (acidosis/serious infections), including diagnosis of serious infections (n=4782), acute renal failure (n=914), acidosis (n=167) and shock (n=17), was used. The six most common diagnoses patients were hospitalised for in this composite end point were pneumonia (unspecified), bacterial pneumonia (unspecified), acute renal failure (unspecified), acute tubulointerstitial nephritis, sepsis (unspecified) and gastroenteritis and colitis of unspecified origin. Altogether, this complicates the evaluation of lactic acidosis per se, although this diagnosis in practice only occurs in combination with severe infections or CVD. Furthermore, lactic acidosis reported with use of biguanides mostly involve phenformine, which was early withdrawn from the market, as lactic acidosis was 20 times more frequent than with metformin.12 In cases of lactic acidosis, plasma metformin concentration has also not proved to be of any prognostic significance.37 The patient group treated with other OHA were mainly treated with SU and to a very limited degree with glitazones, acarbose or DPP-4 inhibitors during the study period. Investigation of the individual effectiveness of these agents would, however, be of interest in the future.
In conclusion, this nationwide observational study of 51 675 DM2 patients supports the previously observed effectiveness of metformin. Metformin was associated with reduced risk of all-cause mortality compared with both insulin and other OHA and for several additional end points compared with insulin. The results were consistent in a subgroup of patients with renal impairment, and no increased risk of acidosis/serious infection was seen. Together with previous findings, this constitutes evident support to the less strict approach to metformin treatment in patients with renal impairment, advocated in most guidelines. Thus, considerably more DM2 patients may be considered for treatment with metformin.
Acknowledgments
We thank the patients, regional NDR coordinators and all participating nurses and physicians.
References
Supplementary materials
Supplementary Data
This web only file has been produced by the BMJ Publishing Group from an electronic file supplied by the author(s) and has not been edited for content.
Files in this Data Supplement:
- Data supplement 1 - Online tables
- Data supplement 2 - Online figure
- Data supplement 3 - Online materials
Footnotes
To cite: Ekström N, Schiöler L, Svensson A-M, et al. Effectiveness and safety of metformin in 51 675 patients with type 2 diabetes and different levels of renal function: a cohort study from the Swedish National Diabetes Register. BMJ Open 2012;2:e001076. doi:10.1136/bmjopen-2012-001076
Contributors NE, LS, BZ, JC, A-MS, JMJ, KE-O, SG and BE contributed to the conception and design. LS, JC and A-MS contributed to the acquisition of data and performed the calculations. LS, NE, JC, BZ, SG, A-MS and BE contributed to the analysis and interpretation of data. NE and BE contributed to drafting the article. NE, BE, BZ, JC, A-MS, LS, KE-O, SG and JMJ contributed to revising the article critically for important intellectual content and final approval of the version to be submitted.
Funding The Region Västra Götaland and the Swedish Association of Local Authorities and Regions fund the National Diabetes Register (NDR). The NDR is supported by the Swedish Society for Diabetology, and the Swedish Diabetes Association. LS, A-MS, JMJ, and SG were also supported by an unrestricted research grant from BMS, France. The funders had no role in study design, data collection and analysis, decision to publish or preparation of the manuscript.
Disclaimer BZ is employed by the Medical Products Agency (MPA), Uppsala, Sweden. BZ has not received any financial support or other benefits from BMS, France, or any commercial sponsor. Results and views of the present study represent the authors and not necessarily any official views of the MPA where BZ is employed.
Competing interests BE has served as a lecturer for all pharmacological companies manufacturing glucose-lowering agents and participated in advisory boards for Eli Lilly Sweden AB and Eli Lilly & Co, Sanofi-aventis, Sweden, Boehringer Ingelheim AB, Sweden, and MSD, Sweden.
Ethics approval Ethics approval was provided by the central ethical review board at the University of Gothenburg.
Provenance and peer review Not commissioned; externally peer reviewed.
Data sharing statement No additional data available.