Article Text

Abstract
Objectives To quantify the association between socioeconomic status (SES) and type 2 diabetes in India.
Design Nationally representative cross-sectional household survey.
Setting Urban and rural areas across 29 states in India.
Participants 168 135 survey respondents aged 18–49 years (women) and 18–54 years (men).
Primary outcome measure Self-reported diabetes status.
Results Markers of SES were social caste, household wealth and education. The overall prevalence of self-reported diabetes was 1.5%; this increased to 1.9% and 2.5% for those with the highest levels of education and household wealth, respectively. In multilevel logistic regression models (adjusted for age, gender, religion, marital status and place of residence), education (OR 1.87 for higher education vs no education) and household wealth (OR 4.04 for richest quintile vs poorest) were positively related to self-reported diabetes (p<0.0001). In a fully adjusted model including all socioeconomic variables and body mass index, household wealth emerged as positive and statistically significant with an OR for self-reported diabetes of 2.58 (95% credible interval (CrI): 1.99 to 3.40) for the richest quintile of household wealth versus the poorest. Nationally in India, a one-quintile increase in household wealth was associated with an OR of 1.31 (95% CrI 1.20 to 1.42) for self-reported diabetes. This association was consistent across states with the relationship found to be positive in 97% of states (28 of 29) and statistically significant in 69% (20 of 29 states).
Conclusions The authors found that the highest SES groups in India appear to be at greatest risk for type 2 diabetes. This raises important policy implications for addressing the disease burdens among the poor versus those among the non-poor in the context of India, where >40% of the population is living in poverty.
This is an open-access article distributed under the terms of the Creative Commons Attribution Non-commercial License, which permits use, distribution, and reproduction in any medium, provided the original work is properly cited, the use is non commercial and is otherwise in compliance with the license. See: http://creativecommons.org/licenses/by-nc/2.0/ and http://creativecommons.org/licenses/by-nc/2.0/legalcode.
Statistics from Altmetric.com
Article summary
Article focus
The relationship between socioeconomic factors and type 2 diabetes has not been previously studied for the whole of India and across states.
Our objective was to investigate associations between measures of SES (defined as social caste, education, household wealth) and self-reported diabetes status in India.
In addition, we explored geographic variation in the prevalence of diabetes between states and local areas in India and between-state variability in the SES–diabetes relationship.
Key messages
The highest socioeconomic groups appear to be at greatest risk for diabetes in India with the strength of the association consistent in size and magnitude across states.
There is substantial geographic heterogeneity in the prevalence of diabetes.
These findings raise important policy implications for addressing the disease burdens among the poor versus those among the non-poor in the context of India, where nearly half of the population is living in poverty.
Strengths and limitations of this study
The key strength of this study is the use of a large nationally representative survey to assess the socioeconomic and geographic patterning of diabetes across all of India. Limitations include the relatively younger age of the sample and assessment of diabetes status on the basis of self-reports.
Introduction
The prevalence of type 2 diabetes in India has been investigated in numerous population-based surveys conducted across a range of settings since the 1970s.1–6 Despite multiple prevalence studies, no nationally representative studies exist that have considered the association between socioeconomic status (SES) and type 2 diabetes in India. In a review of 15 existing studies that have reported the prevalence of type 2 diabetes by SES and/or associations between SES and type 2 diabetes, all were found to have been based on local or regional samples and a majority were done in urban areas4 ,6–19 (table 1). It has been suggested that the prevalence of type 2 diabetes and other cardiovascular disease risk factors may increasingly become concentrated among low SES groups in India20 and other low- and middle-income countries,21 although to date the empirical evidence from India in support of this hypothesis remains limited. The majority of studies reviewed in table 1 have provided evidence of a positive association between SES (defined as education, household wealth, social caste or a composite of two or more markers) and diabetes among populations from selected geographic regions in India6 ,11 ,17; however, the strength and consistency of this association across the whole of India has not previously been assessed.
Overview of studies reporting prevalence of type 2 diabetes by markers of SES and the association between increasing SES and diabetes in India
Type 2 diabetes is the most common form of diabetes globally, accounting for >85% of cases.22 The incidence of type 2 diabetes is related to genetic and non-genetic components, with the latter being greatly influenced by modifiable risk factors such as obesity, diets low in fibre and high in trans fat and physical inactivity.23 ,24 Lifestyle behaviours are strongly patterned by SES25 and may be mediators on the causal pathway between SES and the onset of type 2 diabetes.26 In high-income countries, the SES–diabetes relationship appears to be negative, with the poor at greatest risk. For example, strong associations have been observed between poverty, low education and type 2 diabetes among African–American women27 ,28 and among White women and men in the USA.29 Similarly, a study from Canada described an inversely graded SES–diabetes association with an OR of 1.9 for men (95% confidence interval (CI) 1.6 to 2.4) and 2.8 (95% CI 2.2 to 3.4) for women for the lowest versus highest income groups.30 A recent meta-analysis of 23 case–control and cohort studies and 43 measures of SES–diabetes association revealed an overall increased risk for type 2 diabetes for low SES groups based on education, occupation and income.31 The strength of the association, however, was less consistent in low- and middle-income countries, and few studies have been conducted in these countries.
Concern has been raised over the anticipated rapid increase in type 2 diabetes prevalence in India.32 ,33 Evidence on the secular increases in diabetes prevalence in India, however, have been limited to urban areas of Southern India4 ,34 ,35 and have focused on the mean rates of diabetes rather than how it is distributed in the population. In this paper, we address the need to comprehensively investigate the socioeconomic and geographic distribution of type 2 diabetes in the Indian population using a large-scale nationally representative survey. Specifically, we investigate the SES–diabetes association through the SES markers of social caste, household wealth and education. In addition, we investigate the geographic distribution of the prevalence of diabetes across states and local areas along with variability in the SES–diabetes association across states.
Methods
Data source
We use data from the 3rd National Family Health Survey (NFHS), conducted in 29 states in India between November 2005 and August 2006.36 NFHS-3 is a major national health survey in India that collected information on a range of indicators including reproductive health, nutritional status of adults and children, utilisation of healthcare services and blood testing for HIV prevalence. NFHS-3 covered all states in India, which comprises nearly 99% of the population, but excluded Union Territories. The survey was designed to provide estimates of key indicators (except HIV prevalence) for each state by urban and rural areas.
Survey design
A uniform multistage sampling strategy was adopted in all states, with separate sampling in urban and rural areas.36 ,37 In rural areas, a two-stage sample was carried out using a list of villages from the 2001 census as the sampling frame. In the first stage, a stratified sample of villages was drawn with probability proportional to the size of the village. In the second stage, a random selection of households was drawn in each village from a complete list of households complied during field visits carried out in each sampled village. In urban areas, a similar procedure was implemented beginning with a stratified random sample of municipal wards based on the 2001 census. Next, one census enumeration block (150–200 households) was selected from within wards using probability proportional to size. Finally, as in rural areas, field enumerators undertook a household listing operation in selected blocks and a random sample of households was made. In both rural and urban areas, 30 households were targeted for selection in each of the sampled units. The overall household response rate for NFHS-3 was 98%.36
All women aged 15–49 years in selected households were invited to participate in the survey. In 22 states, men aged 15–54 years in a random subsample of households drawn from each PSU (about six households per PSU) were eligible for the men's survey. In the remaining seven states (Andhra Pradesh, Karnataka, Maharashtra, Manipur, Tamil Nadu, Uttar Pradesh and Nagaland), eligible men in all selected households were invited to participate. The additional men recruited in these states was for the purpose of HIV testing to provide reliable state-level estimates of HIV prevalence in certain states. Interviews were conducted in one of the 18 Indian languages in the respondent's home and the response rates were 95% for women and 87% for men.36 During interviews, the weights and heights of survey respondents were measured by trained field technicians using standardised measuring equipment designed for survey settings.38
In total, NFHS-3 collected information from 109 041 households, 124 385 women aged 15–49 years and 74 369 men aged 15–54 years. We restricted our analyses to adults aged ≥18 years and non-pregnant women (n=171 207). Respondents who did not report or know their diabetes status (n=2373) or with incomplete information for any of the independent variables considered in the analysis (marital status, religion, caste, education, household wealth) were excluded (n=699). Main analyses were conducted on a sample of 168 135 respondents (65 255 men and 102 880 women). Additional analyses considering body mass index (BMI) were restricted to a sample of 158 936 due to missing and/or implausible values for height and/or weight. Figure 1 provides a flow diagram detailing the NFHS sample, exclusions and final analytic sample sizes.

Flow diagram showing exclusions and final sample sizes, 2005–2006 National Family Health Survey (NFHS). *Two thousand three hundred and thirty-three individuals reported unknown diabetes status; in 40 individuals, diabetes status was not reported/missing. Of the 2333 individuals who reported unknown diabetes status, 2210 (94.7%) had complete data for BMI and were included in sensitivity analyses. **Analyses involving body mass index (BMI) as an independent variable were restricted to 158 936 individuals.
Outcome and independent variables
The primary outcome was diabetes, assessed on the basis of self-reports by survey respondents. Markers of SES were social caste, household wealth and education. Social caste was reported by the household head. The categories were other caste, scheduled caste, scheduled tribe, other backward class and no caste. Other caste is a heterogeneous group that is traditionally viewed as having higher social status. Scheduled castes and scheduled tribes are considered lower, socially marginalised groups in India.39 Household wealth was defined by an index based on indicators of asset ownership and housing characteristics.40 This index has been developed and validated in a number of countries to be a robust measure of wealth and has been found to be consistent with measures of income and expenditure.41 Briefly, the measure was constructed as follows. Information on 33 indicators of housing characteristics (eg, type of windows and flooring, water and sanitation facilities) and assets (eg, ownership of home, car, computer, mobile phone) was weighted and combined with weights derived from a principal component analysis procedure.36 The resulting variable was standardised to a mean of 0 and SD of 1, and using this index, the household population was divided into fifths from poorest to richest. Education was categorised into four levels as no education, primary, secondary or higher education.
Background characteristics included age, gender, religion, marital status, place of residence and BMI. Age was defined in 10-year categories and centred about its mean (32 years) in regression models. Gender was based on self-report. Religion was categorised as Hindu, Muslim, Sikh, Buddhist or other religion. Marital status was defined as single, married, widowed or divorced/separated. Place of residence (rural or urban) was defined according to the 2001 Census. BMI (in kg/m2; weight in kilogrammes divided by the square of height in metres) was calculated for all survey respondents with valid measurements for weight and height. BMI was classified according to the following categories based on risk of type 2 diabetes and cardiovascular disease in Asian populations: <18.5 kg/m2 (underweight), 18.5–22.9 kg/m2 (acceptable risk), 23–27.4 kg/m2 (increased risk) and ≥27.5 kg/m2 (high risk).42
Analysis
To account for the complex survey design, we employed multilevel logistic regression to model the probability of diabetes.43 A three-level model was specified with a binary response (y, diabetes or not) for individual i in local area j (village or census block primary sampling units), in state k. The outcome diabetes, Pr(yijk=1), was assumed to be binomially distributed  with probability πijk related to the set of independent variables X and a random effect for each level by a logit link function:
 (Equation 1)
The right-hand side of the equation consists of the fixed part linear predictor (β0+βXijk) and random intercepts attributable to states (v0k) and local areas (u0jk). The intercept, β0, represents the log odds of diabetes in the reference group, and the β-coefficients represent the differential in the log odds of diabetes compared with the reference group defined for each independent variable. Coefficients were exponentiated and presented as ORs for interpretation. The random intercepts are assumed to be independently and identically distributed and have variances estimated for states ( ) and local areas (
 ).44 The variance parameters quantify heterogeneity in the log odds of diabetes at each level, after taking into account individual characteristics and place of residence in the fixed part. We expressed the variances at each level as a percentage of their contribution to the total variance from an initial model adjusting for age and gender only and from a final model accounting for all covariates. We specified a sequence of six models during analyses. In the first three models, one SES marker (social caste, household wealth and education) was added to a model that adjusted for background characteristics (age, gender, religion and place of residence). In the fourth mutually adjusted model, all SES markers were included along with background characteristics from the previous models. In the fifth model, BMI was included with markers of SES and background characteristics from model 4. In the sixth model, we also tested whether the association between household wealth varied across states in terms of strength or direction, given that different states vary tremendously by levels of economic development and could be considered at different levels of epidemiological transition. In order to test this between-state variability, we expanded equation 1 to allow the slope of household wealth to vary across states:
 (Equation 2)
The key feature of equation 2 is that the effect of wealth on self-reported diabetes in state k consists of the overall average effect across all states (β1), plus a state-specific (v1k) differential in this effect. We summarised and presented the results of this model as the OR for self-reported diabetes overall in India and for each state given a 1-quintile increase in household wealth and conditional on all covariates from model 5. Additional analyses were carried out separately for male and female samples using an identical sequence of models (with the exclusion of gender as a background characteristic). Estimation of models was done using Markov Chain Monte Carlo simulation and the statistical software MLwiN.45 ,46
Results
Characteristics of survey respondents by their self-reported diabetes status are given in table 2. The overall prevalence of diabetes in this sample was 1.5%, and this was higher in urban areas and among men (diabetes prevalence 2.0% in urban vs 1.0% in rural; 1.8% in men vs 1.3% in women). Diabetes prevalence increased with age (7.5% in 50–54 years vs 0.3% in 18–29 years), education (1.9% in higher vs 1.0% in no education), household wealth (2.5% in richest vs 0.4% in poorest) and BMI (4.8% in ≥27.5 kg/m2 vs 0.6% in <18.5 kg/m2). At the state level, the prevalence of diabetes varied between 0.3% in Rajasthan and 3.3% in Kerala and was generally higher in Southern and Eastern states (figure 2).
Characteristics of survey participants and frequency distribution of self-reported diabetes in India, males and females from the 3rd National Family Health Survey
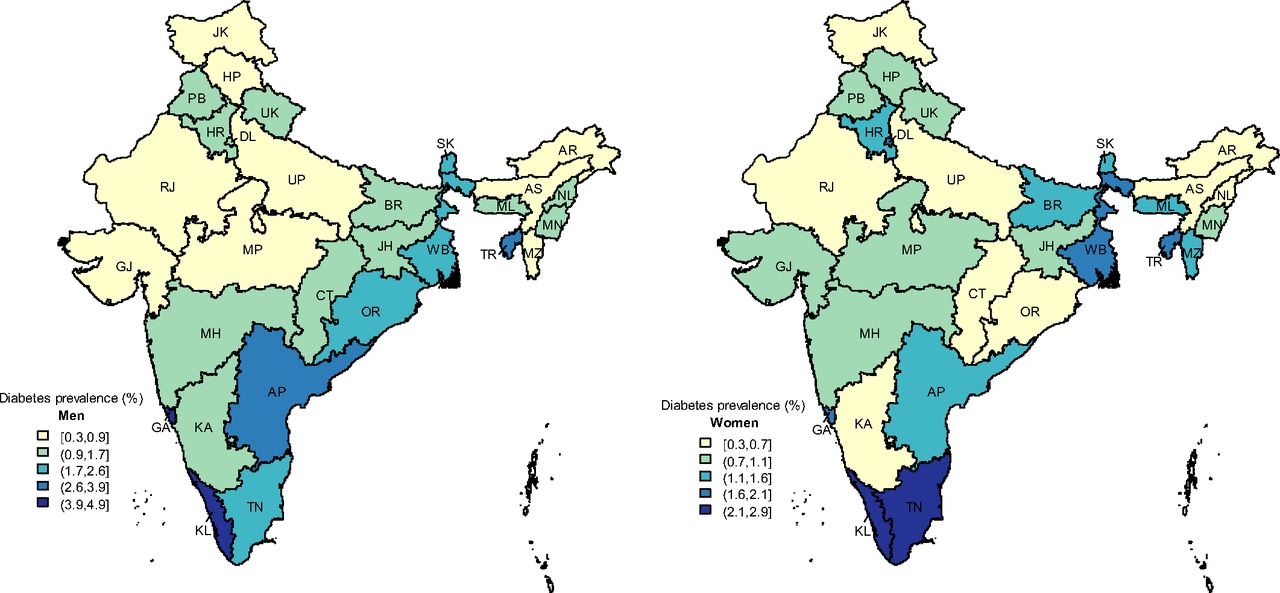
State-level prevalence of self-reported diabetes in India for men aged 18–54 years (left) and women aged 18–49 years (right). Darker colours indicate higher prevalence. State name abbreviations: AP, Andhra Pradesh; AR, Arunachal Pradesh; AS, Assam; BR, Bihar; CT, Chhattisgarh; DL, Delhi; GA, Goa; GJ, Gujarat; HR, Haryana; HP, Himachal Pradesh; JK, Jammu & Kashmir; JH, Jharkhand; KA, Karnataka; KL, Kerala; MP, Madhya Pradesh; MH, Maharashtra; MN, Manipur; ML, Meghalaya; MZ, Mizoram; NL, Nagaland; OR, Orissa; PB, Punjab; RJ, Rajasthan; SK, Sikkim; TN, Tamil Nadu; TR, Tripura; UP, Uttar Pradesh; UK, Uttarakhand (Uttaranchal); WB, West Bengal.
In separate models that adjusted for age, marital status, religion and place of residence, statistically significant associations were observed between SES and self-reported diabetes for each of the primary markers of SES in this study: social caste, household wealth and education. Compared with the other caste group, scheduled casts, scheduled tribes and other backward classes had reduced odds of having diabetes with ORs of 0.81 (95% CrI 0.71 to 0.94), 0.57 (95% CrI 0.46 to 0.70) and 0.84 (95% CrI 0.75 to 0.94), respectively (table 3, models 1–3). Education showed a graded relationship with diabetes and an OR of 1.87 (95% CrI 1.61 to 2.18) for those with higher education versus those with no education. Household wealth showed a graded association with diabetes with individuals from the richest households having an OR for diabetes of 4.04 (95% CrI 3.08 to 5.30) compared with those from the poorest households.
Associations between socioeconomic status and self-reported diabetes in India; 3rd National family health survey, 2005–2006
The effects of social caste and education were attenuated in the mutually adjusted model (model 4), suggesting that their independent effects on self-reported diabetes were at least partially mediated by the inclusion of household in this model. The reduced odds for diabetes remained consistent for scheduled tribes versus other caste groups (OR 0.72, 95% CrI 0.58 to 0.90) as did an increased odds for those with secondary education versus no education (OR 1.18, 95% CrI 1.04 to 1.35); however, the graded relation with education was less consistent. In separate mutually adjusted models that were stratified by gender, education showed a graded association in men although it was not statistically significant with the OR for diabetes men found to be 1.27 (95% CrI 0.98 to 1.70) for men with higher versus no education (supplemental table 1). Among women, those with secondary education continued to show an increased odds of self-reported diabetes compared with those with no education (OR 1.28, 95% CrI 1.08 to 1.50). Overall, the strong and graded relationship between household wealth and diabetes remained consistent in model 4 with an OR for diabetes of 3.65 (95% CrI 2.83 to 4.78) for the richest versus the poorest groups; similar associations were found in the gender-specific models (supplemental table 1). Type 2 diabetes is strongly influenced by body weight.47–49 Therefore, BMI was added to model 5 to control for potential confounding of the SES–diabetes relationship in this sample. In addition, BMI was added separately in this model because its inclusion resulted in the reduction of sample size by ∼5% due to missing values for BMI. The ORs for caste and education remained consistent between the mutually adjusted model and final model that included BMI. The ORs for household wealth were further attenuated in the final model; however, the positive graded association remained statistically significant with an adjusted OR for those in the richest compared with the poorest households of 2.58 (95% CrI 1.99 to 3.40).
Our analyses revealed dramatic variation in the prevalence of diabetes between states and local areas in India (table 4). In an initial multilevel model adjusted for age and gender, states and local areas (defined as villages in rural areas and census blocks in urban areas) contributed 5.9% and 10.8%, respectively, to the total variation in diabetes. The addition of socioeconomic and demographic characteristics along with BMI to the model reduced, the variance in diabetes attributed to local areas by 41%–6.4% but the variation attributed to states was relatively unchanged at 5.4%.
Variance in self-reported diabetes status between local areas and states in India, expressed as percentage of the contribution to the total variance in diabetes
Overall in India, the log odds for diabetes for the reference category (a 32-year-old married women, with no education, BMI <18.5 kg/m2, belonging to the other caste group, in the poorest fifth of households and living in a rural area) was −6.13 or a 0.22% probability of diabetes. Compared with this national reference point, being a resident of several Southern and Northeastern states was associated with a statistically significant increase in the odds of diabetes (figure 3). The ORs for self-reported diabetes of these sates were 2.29 (Tripura), 1.69 (Tamil Nadu), 1.69 (Kerala), 1.71 (Goa), 1.49 (Andhra Pradesh) and 1.56 (West Bengal). In contrast being resident of the states of Rajasthan, Jammu & Kashmir, Uttar Pradesh, Punjab, Madhya Pradesh and Assam in Northern and Central India was associated with a statistically significant decrease (OR<1.0) in the odds of self-reported diabetes.

ORs for self-reported diabetes by state of residence in India. Horizontal lines are 95% credible intervals; adjusted for age, gender, marital status, religion, social caste, household wealth, education, body mass index and place of residence.
In order to assess the variability in the SES–diabetes association across states in India, a final model (model 6) was specified to allow the OR for diabetes for a one-quintile increase in household wealth to vary across states. In this model, the overall OR for diabetes in India for a one-quintile increase in household wealth was 1.31 (95% CrI 1.20 to 1.42) (figure 4). In 15 states, the association was stronger than the national average, varying between an OR of 1.33 in Rajasthan and 1.55 in Jammu & Kashmir. Although the association was less than the national average in 14 states, it was found to be positive in 28/29 (97%) states and statistically significant in 20/29 (69%). Only in West Bengal was an inverse association observed, but it was not statistically significant (OR 0.95, 95% CrI 0.83 to 1.09). ORs and 95% CrI for the overall association and across all states are presented in supplemental table 2. In summary, the association between household wealth and self-reported diabetes was consistent across the states both in direction and magnitude.

OR for self-reported diabetes for a one-quintile increase in household wealth for men (aged 18–54 years) and women (aged 18–49 years) in India and 29 states. Adjusted for age, gender, marital status, religion, social caste, education, body mass index and place of residence.
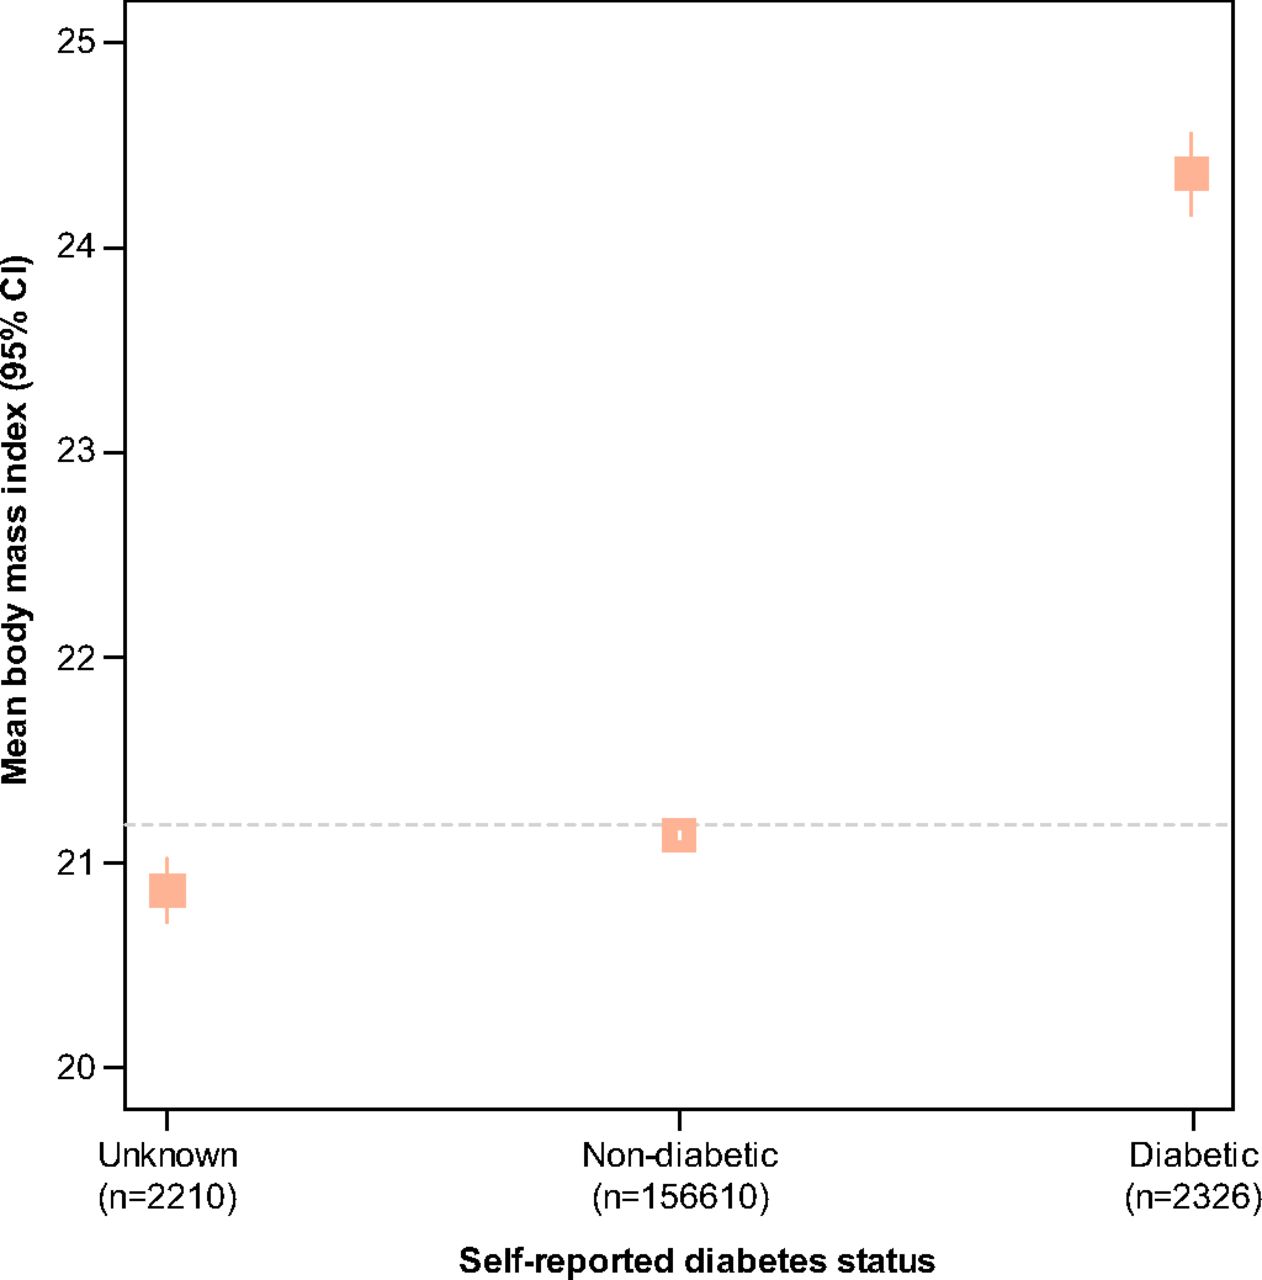
We conducted several sensitivity analyses to assess the consistency of our findings. First, we examined whether the observed associations were related to respondents' awareness and knowledge about diabetes. To do so, we considered responses to the question, ‘Do you have diabetes?’ as a categorical variable, comparing ‘yes’ (diabetic) and ‘don't know’ (unknown) versus ‘no’ (non-diabetic) across the same set of independent variables using a multinomial logistic model. Associations between SES variables and positive reports of diabetes from this model, which included the possibility that respondents were unaware of their diabetes status, were nearly identical to findings from the logistic model that excluded those with unknown diabetes status (supplemental table 3). The multinomial model also revealed that the richer and more highly educated respondents were less likely to report unknown status compared with non-diabetic. In addition, we examined BMI across the three categories of diabetes status (figure 5). This revealed that those with unknown diabetes had the lowest BMI (mean 20.9, SD 3.7) which was largely consistent with the non-diabetic group (mean 21.1, SD 3.9) and substantially lower than those with self-reported diabetes (mean 24.4, SD 4.9). Finally, we examined interactions between socioeconomic variables (caste, education and wealth) and diabetes by residential location. Tests of these interactions were not statistically significant (p=0.20 for caste; p=0.72 for education; p=0.66 for wealth).

Mean body mass index (BMI) across three possible responses for self-reported diabetes. Vertical lines represent 95% confidence intervals. BMI (in kg/m2) was calculated from measured height and weight values. Horizontal line represents overall mean BMI (21.2 kg/m2, SD 3.9).
Discussion
In this study, we have three key findings. First, measures of SES were positively associated with self-reported diabetes in the NFHS-3. Although the observed effects of caste and education were largely attenuated in fully adjusted models, the effect of household wealth remained positive, graded and statistically significant even after controlling for BMI. Second, we observed a large variation in the prevalence of diabetes between local areas and states in India. A few southern and northeastern states were associated with a higher risk for reporting diabetes while several northern and central states were at lower risk after adjusting for individual characteristics and place of residence. Lastly, the observed association between household wealth and self-reported diabetes was consistent, positive, and statistically significant across a majority of states in India.
There are a few limitations to our study. First, the outcome was defined on the basis of self-reported diabetes, although interviews were conducted in person using a standardised instrument. Previous research has shown good agreement for self-reported diabetes when compared with medical records in a US population50 and that self-reported health conditions demonstrate the expected relationship with SES in India.51 In addition, our sensitivity analyses considering respondents who reported ‘unknown’ for diabetes status were nearly identical to the main analyses. We did find, however, evidence that higher SES groups were less likely to report ‘did not know’ as compared with ‘no’, which has been suggested previously on studies using self-reports of diabetes status in India.6 However, the unknown group was more similar in terms of BMI, education and wealth to the non-diabetic rather than diabetic group. In addition, our findings of positive SES–diabetes associations were consistent with several studies identified in our literature review that used blood glucose measurements for the assessment of diabetes status (summarised in table 1). Lastly, although our sample was relatively young (<55 years for men and <50 years for women), it is representative of the young population of profile of India; 84% of the Indian adult population (18–69 years) and 47% of the total Indian population at all ages fall within the ages covered by this study.52 Our study does exclude approximately 12% of the Indian population (women over the age of 50 and men over the age of 55) due to the sample design of the NFHS. The prevalence of diabetes increases with age and whether a similar SES–diabetes relationship exists among middle and older age groups in all parts India is not clear, although our findings are consistent with the previous studies that have included older ages.
Our findings of positive SES–diabetes associations are consistent with the previous studies done in different parts of India. For example, an analysis of rural participants from the Indian Migration Study, which sampled primarily from four large states in the north, centre and south of India,17 identified a positive SES–diabetes gradient among men (8.0% prevalence in high SES group vs 1.8% in low SES group) and a weaker positive SES–diabetes association that was not statistically significant among women (5.1% vs 3.9%). In addition, a study done in an urban setting in Madras (Chennai) found an OR for diabetes of 2.2 (95% CI 1.7 to 2.7) for high versus low SES groups.11 One larger study conducted in urban and rural surveillance locations in Northern, Southern, Eastern and Western/Central India identified an OR of 3.0 (95% CI 2.5 to 3.7) for self-reported diabetes for those with graduate-level education versus those without formal schooling.6 Importantly, these studies were limited to selected geographical areas or cities in India. Our study has added to this literature using a national population health survey with good coverage in rural areas across India.
Previous research in India has identified a strong positive relationship between SES and BMI among women and men in India.53–55 These studies are important because they have used similar markers of SES in the Indian context along with an objectively defined outcome (height and weight were measured in NFHS and not self-reported). BMI (along with other measures of body weight) is an important risk factor for the development of type 2 diabetes.47 ,49 ,56 Therefore, the consistency of our findings of a positive SES–diabetes association after controlling for BMI is encouraging. If BMI is part of the causal pathway between SES and diabetes, attenuation in the effect size for markers of SES would be expected. The graded and positive relation between household wealth and diabetes after accounting for BMI suggests that there are additional effects of household wealth on diabetes that are not mediated by BMI. The effects of social caste and education were largely attenuated after the inclusion of household wealth and prior to the inclusion of BMI. Household wealth was the strongest socioeconomic factor associated with self-reported diabetes, suggesting that social and behavioural changes associated with diabetes in India may be more closely related to increasing wealth and/or standard of living than educational attainment.
When compared with other studies in India, the overall prevalence of diabetes in the NFHS-3 was not high. This may have resulted from a combination of using self-reports of diabetes, the younger age of the NFHS-3 target population and sampling from the general population that included a high proportion of respondents in rural areas. Among individuals over 30 years of age, the prevalence was 2.5% (3.0% in men and 2.2% in women). Other studies using in rural India using similar age groups and blood measurements have reported diabetes prevalence of 4%, and a study from rural Andhra Pradesh found a prevalence of 12% based on combination self-report and blood measurements.17 ,57
The current national estimate for diabetes prevalence in India is about 7% of the adult population aged 20–79 years. This estimate is based on three relatively recent and larger scale studies using a combination of oral glucose tolerance testing and self-reports of diabetes.4–6 There continues to be considerable uncertainty in estimates of diabetes for the whole of India due to the limited study locations (with a focus on urban areas), wide variation in survey sampling methodology, differences in diabetes diagnostic criteria and age groups studied. These differences in study design have hindered direct comparison of the prevalence between studies, across regions and over time. The NFHS-3 provides an important benchmark because it is the first nationally representative survey of diabetes in India. Even if the prevalence estimates of diabetes have been underestimated in the NFHS-3, the observed SES–diabetes associations are plausible and important. Previous studies have largely overlooked the importance of SES markers, which may be a key determinant of diabetes. Further large-scale population-based surveys can be strengthened by using simple finger-prick blood glucose measurements in addition to self-reports.
There has been considerable concern over the rising prevalence of diabetes in India, especially with studies on migrant Indian populations suggesting that South Asians may be more susceptible to the disease. In light of current findings, it appears that, at present, the more well-off segments of the Indian population are at greatest risk. This poses concerns on how to appropriately balance priorities to address the disease burden that afflicts the non-poor versus the poor in the context of India where >40% of the population continue to live in extreme poverty on <$1.25/day.58
References
Supplementary materials
Supplementary Data
This web only file has been produced by the BMJ Publishing Group from an electronic file supplied by the author(s) and has not been edited for content.
Files in this Data Supplement:
- Data supplement 1 - Online STROBE Statement
Footnotes
To cite: Corsi DJ, Subramanian SV. Association between socioeconomic status and self-reported diabetes in India: a cross-sectional multilevel analysis. BMJ Open 2012;2:e000895. doi:10.1136/bmjopen-2012-000895
Contributors SVS and DJC planned the study. DJC conducted statistical analyses and drafted the manuscript with supervision from SVS. Both authors participated in interpretation of the results and critical revisions of the manuscript.
Funding This research received no specific grant from any funding agency in the public, commercial or not-for-profit sectors.
Competing interests None.
Provenance and peer review Not commissioned; externally peer reviewed.
Data sharing statement The NFHS data are available through the Measure DHS project at http://www.measuredhs.com/