Article Text

Abstract
Objective To estimate the impact of achieving alternative average population alcohol consumption levels on chronic disease mortality in England.
Design A macro-simulation model was built to simultaneously estimate the number of deaths from coronary heart disease, stroke, hypertensive disease, diabetes, liver cirrhosis, epilepsy and five cancers that would be averted or delayed annually as a result of changes in alcohol consumption among English adults. Counterfactual scenarios assessed the impact on alcohol-related mortalities of changing (1) the median alcohol consumption of drinkers and (2) the percentage of non-drinkers.
Data sources Risk relationships were drawn from published meta-analyses. Age- and sex-specific distributions of alcohol consumption (grams per day) for the English population in 2006 were drawn from the General Household Survey 2006, and age-, sex- and cause-specific mortality data for 2006 were provided by the Office for National Statistics.
Results The optimum median consumption level for drinkers in the model was 5 g/day (about half a unit), which would avert or delay 4579 (2544 to 6590) deaths per year. Approximately equal numbers of deaths from cancers and liver disease would be delayed or averted (∼2800 for each), while there was a small increase in cardiovascular mortality. The model showed no benefit in terms of reduced mortality when the proportion of non-drinkers in the population was increased.
Conclusions Current government recommendations for alcohol consumption are well above the level likely to minimise chronic disease. Public health targets should aim for a reduction in population alcohol consumption in order to reduce chronic disease mortality.
This is an open-access article distributed under the terms of the Creative Commons Attribution Non-commercial License, which permits use, distribution, and reproduction in any medium, provided the original work is properly cited, the use is non commercial and is otherwise in compliance with the license. See: http://creativecommons.org/licenses/by-nc/2.0/ and http://creativecommons.org/licenses/by-nc/2.0/legalcode.
Statistics from Altmetric.com
Article summary
Article focus
Alcohol consumption is a risk factor for many chronic diseases, while providing modest protection from others. Assessments of the impact of alcohol on individual chronic diseases can therefore result in contradictory advice about the level of alcohol consumption that is optimal for health.
The UK Government currently recommends that men should consume no more than three to four units per day (24–32 g/day of pure alcohol) and women should drink no more than two to three units per day (16–24 g/day). However the net impact of this level of consumption on chronic disease mortality is unclear.
The aim of this study was to estimate the impact of achieving alternative population alcohol consumption levels on chronic disease mortality in England.
Key messages
Results suggest that the optimum population level of alcohol consumption for minimising chronic disease mortality in England is just 5 g (approximately half a unit) per day.
Current recommendations for alcohol consumption are well above this level and may not be compatible with optimum protection of public health. Substantial reductions in recommendations and in population alcohol consumption levels would be needed to minimise the chronic disease burden associated with alcohol consumption in England.
Community beliefs in the protective role of alcohol in cardiovascular disease are widespread; however, our modelling shows that when multiple conditions are considered simultaneously, the levels of alcohol that would actually be likely to be associated with reduced risk of chronic disease are much lower than is generally accepted or recommended by government.
Strengths and limitations of this study
The study used a detailed modelling approach to synthesise the best available evidence from meta-analysis of prospective cohort studies and provide for the first time an estimate of the level of alcohol associated with theoretical minimum risk of a range of chronic diseases, considering both harmful and protective effects simultaneously.
The model is dependent on the meta-analyses selected to define the parameters. Results may vary significantly in other contexts with varying levels of disease, alcohol consumption and other risk factors. Furthermore, results depend on the quality of the available epidemiological evidence, which remains contested in some areas.
The approach used also relies on chronic (average) consumption of alcohol and is not able to take account of to take account of patterns of drinking (eg, binge drinking). Furthermore, the results are based on the assumption of a steady-state relationship between alcohol consumption patterns and RR of disease and cannot estimate the time required between changes in population alcohol consumption levels occurring and the achievement of changes in mortality rates.
Alcohol consumption has significant impacts on chronic disease risk.1–3 In the UK, it has been estimated that alcohol-related ill-health is responsible for £3.3 billion in direct costs to the National Health Service annually.4 The effects of episodes of heavy alcohol consumption are clearly detrimental to health, for example, increasing risk from injuries and violence.5–7 Less is known about the overall effects of long-term alcohol consumption on chronic disease risk in the whole population, due to alcohol consumption at various levels increasing risk for some chronic disease outcomes (eg, liver cirrhosis and cancer), yet decreasing risks of others (eg, cardiovascular disease (CVD) and diabetes).
The World Cancer Research Fund has recommended that there is no safe level of alcohol consumption in relation to cancer risk,8 and Schutze and colleagues9 report that up to 10% of all cancers in men and 3% in women in some European countries may be attributable to alcohol consumption. This has led to calls for public health messages to encourage abstinence or significant reductions in alcohol consumption.9 10 There is, however, a substantial body of evidence that suggests that moderate alcohol consumption protects against other chronic diseases, including CVD and diabetes, which are responsible for a substantial burden of disease.11–13
Substantial research has examined the effects of alcohol consumption on various chronic diseases; however, there has been little integration of the findings across disease outcomes, thereby precluding the development of comprehensive and evidence-based recommendations for population alcohol consumption. The UK government currently recommends that men should consume no more than three to four units per day (one unit =8 g (10 ml) of pure alcohol, one pint of standard beer usually contains between two and three units and a 175 ml glass of wine approximately two units) and women should drink no more than two to three units per day.14 A large proportion of the literature supporting alcohol policy in the UK, however, appears to focus on alcohol ‘misuse’, episodes of heavy drinking and the social consequences of alcohol consumption14; it is not clear that there is evidence that the UK Government recommended that drinking levels offer the maximum protection for public health.
The aim of this study was to estimate the impact of achieving alternative population average alcohol consumption levels on chronic disease mortality in England. The research question was: what proportion of non-drinking in the English population and what level of alcohol consumption among drinkers would result in the greatest number of chronic disease deaths delayed or averted in England compared with recent levels?
Methods
A macro-simulation model was built that assessed the impact on mortality from chronic disease of changing the distribution of alcohol consumption (grams per day) within the population of England. The Preventable Risk Integrated ModEl for Alcohol (PRIME-Alcohol) estimates the impact of population changes in alcohol consumption on chronic disease mortality. Developing the PRIME-Alcohol model involved the following: identifying chronic diseases associated with alcohol consumption, identifying the current (baseline) distribution of alcohol consumption and parameterising the association between alcohol consumption and chronic disease.
Selection of mortality outcomes
The initial list of chronic diseases was generated from those linked to alcohol consumption in the World Health Organization Global Burden of Disease ‘Global Health Risks’ report15 and the World Cancer Research Fund Report8 was used to select site-specific cancers associated with alcohol consumption. Excluding those resulting in small numbers of deaths (fewer than 500 deaths in 2006 in England), 11 chronic diseases were included as outcomes in the PRIME-Alcohol model, including five cancer sites.
The PubMed and Cochrane Databases were searched for meta-analyses of prospective cohort or case–control studies that quantified chronic disease risk for different levels of alcohol consumption. The relationships between alcohol consumption were diverse, including protective effects, linear increases in risk and ‘U’-shaped or ‘J’-shaped relationships. Where multiple suitable meta-analyses were available, preference was given to meta-analyses of cohort studies over case–control studies and to those using lifetime abstainers as the reference category. Age- and sex-specific estimates of risk relationships and estimates adjusted for potential confounders were used where available.
Details of the chronic disease outcomes and the meta-analyses that were included in the model8 11 12 16–18 are shown in table 1.
Details of mortality outcomes included in the model
Identifying the current (baseline) distribution of alcohol consumption in England
The General Household Survey (GHS) from 200619 provided baseline distributions of alcohol consumption for adults aged 16 years and over. The GHS is a multi-purpose survey conducted by the Office for National Statistics in the UK. In 2006, it included 18 214 adults aged 16 years and over (overall response rate 74%). To establish average weekly alcohol consumption, respondents were asked how often over the last year they drank alcoholic beverages and the amount usually consumed on any one day. This information is combined to give an estimate of the respondent’s weekly alcohol consumption in units of alcohol.20 For the current analyses, units of alcohol per week was converted to grams per day and only participants from England were included (n=15 616). Non-drinkers and very low alcohol consumers were removed and analysed as a separate category (referred to as non-drinkers henceforth). Excluding this group, alcohol consumption was shown to be approximately log-normally distributed.
The three parameters for the baseline distribution of alcohol consumption derived from the GHS for each of 30 age-sex groups were therefore percentage of non-drinkers, the mean of ln-transformed alcohol consumption of drinkers and the SD of ln-transformed alcohol consumption of drinkers. Counterfactual scenarios were modelled by altering one or more of these parameters.
Parameterising the association between alcohol consumption and chronic disease
The meta-analyses identified by the literature search provided estimates of the RR of different levels of alcohol consumption on chronic disease (table 1). The RRs used in the PRIME-Alcohol model are shown in supplementary table S1. These risks were used in conjunction with the baseline distribution of alcohol consumption to attribute risk for chronic disease throughout the age- and sex-specific populations. Baseline age, sex and cause-specific number of mortalities (England 2006) were provided by the Office for National Statistics. For each chronic disease and age–sex group, mortality rates were assigned to each level of alcohol consumption such that the RRs from the meta-analyses were maintained and the total risk in the population produced the recorded number of mortalities. These mortality rates were then applied to the counterfactual distributions to calculate the number of deaths that would be expected under the counterfactual scenario. An example is provided in supplementary table S2.
Uncertainty analysis
The alcohol–chronic disease association parameters were allowed to vary stochastically according to the distributions reported in the literature. Five thousand Monte Carlo iterations were run, and the results were used to calculate 95% credible intervals around the estimates. Because of the computing requirements of the Monte Carlo iterations, credible intervals are only presented for key results.
Defining the counterfactual scenarios
To assess the number of chronic disease mortalities in England under different alcohol consumption scenarios, two counterfactual scenarios were analysed: (1) varying the median consumption among drinkers while holding the proportion of non-drinkers and the distribution of consumption levels constant and (2) varying the proportion of non-drinkers in the population while holding the median consumption among drinkers constant.
In the analysis of the first scenario, the percentage of non-drinkers was kept constant while the amount of alcohol consumed by drinkers in the population was varied between 1 and 48 g/day (six units), such that the age–sex distribution of mean alcohol consumption was maintained. In the analysis of the second scenario, the total percentage of non-drinkers in the population was allowed to vary between 0% and 100% such that the age–sex distribution of non-drinkers was maintained, while the amount of alcohol consumed by drinkers remained constant. The aim of the analyses was to find the median level of average alcohol consumption for England that would be likely to result in the lowest number of chronic disease mortalities.
The funding bodies supporting the authors of this work had no role in the present study.
Results
In 2006, 29% of English adults were non-drinkers according to the definitions used here (including those who consume <1 g/day). Rates of non-drinking varied substantially by age group and sex (supplementary table S3). Overall, 20% of men and 36% of women were non-drinkers. In total, there were 170 558 deaths in England in 2006 from the causes of death considered in this study.
In the first counterfactual scenario, varying the median population level of alcohol consumption among current drinkers between 1 and 48 g/day, results showed that approximately 5 g/day (just over half of one unit) was the optimal level of alcohol consumption, resulting in 4579 (2544–6590) deaths delayed or averted (table 2 and figure 1) or approximately 3% of all deaths from partially alcohol-related chronic diseases. At this level of consumption, a small predicted increase in risk of CVD (843 additional deaths per year, +0.7% from 2006 levels) is counteracted by large decreases in cancer (2668 fewer deaths, −8%) and liver disease (2828 fewer deaths, −49%). At this level of consumption, the vast majority (90%) of deaths delayed or averted were premature (before age 75).
Annual chronic disease deaths averted or delayed in counterfactual scenarios in which the median intake of alcohol in drinkers varies from 1 to 48 g/day
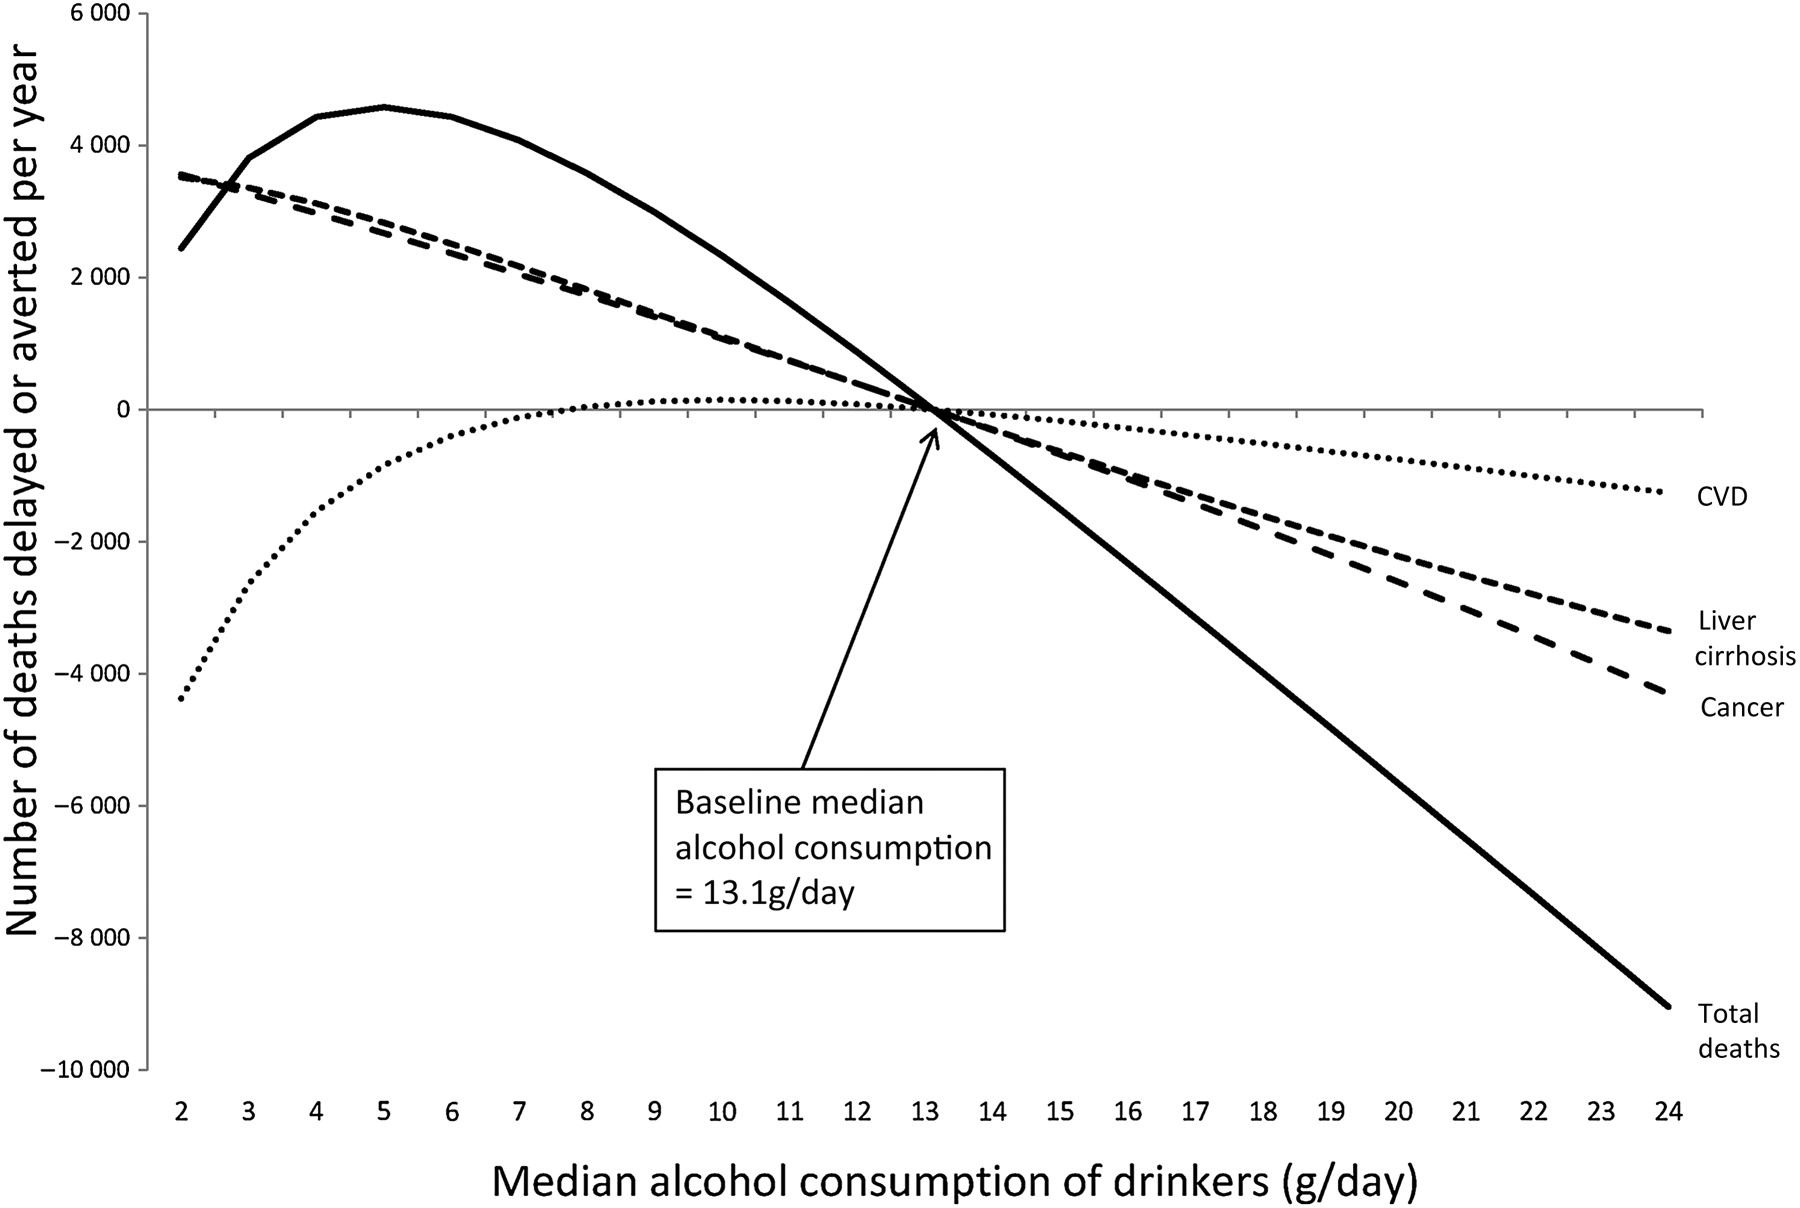
Deaths delayed or averted in the counterfactual scenario varying median consumption of alcohol in drinkers. The median consumption of alcohol among drinkers was allowed to vary from 0 to 24 g/day using England 2006 as the baseline. The percentage of non-drinkers in the population was held constant.
In variations of the scenario with lower levels of median alcohol consumption, the shift of a large proportion of the population into the non-drinker category resulted in a modelled increase in deaths from CVD, which was not offset by reductions in cancer, liver cirrhosis and other chronic conditions. Above 5 g/day, the additional protective effect of alcohol on CVD was not enough to offset the additional risk from cancer, liver cirrhosis and other chronic conditions. For men and women aged under 75 years, the optimum level of consumption was slightly lower than for the whole population, at 3 g/day, at which level 4381 (3327–5400) deaths before age 75 would be delayed or averted each year, a decrease of 8% from 2006 levels.
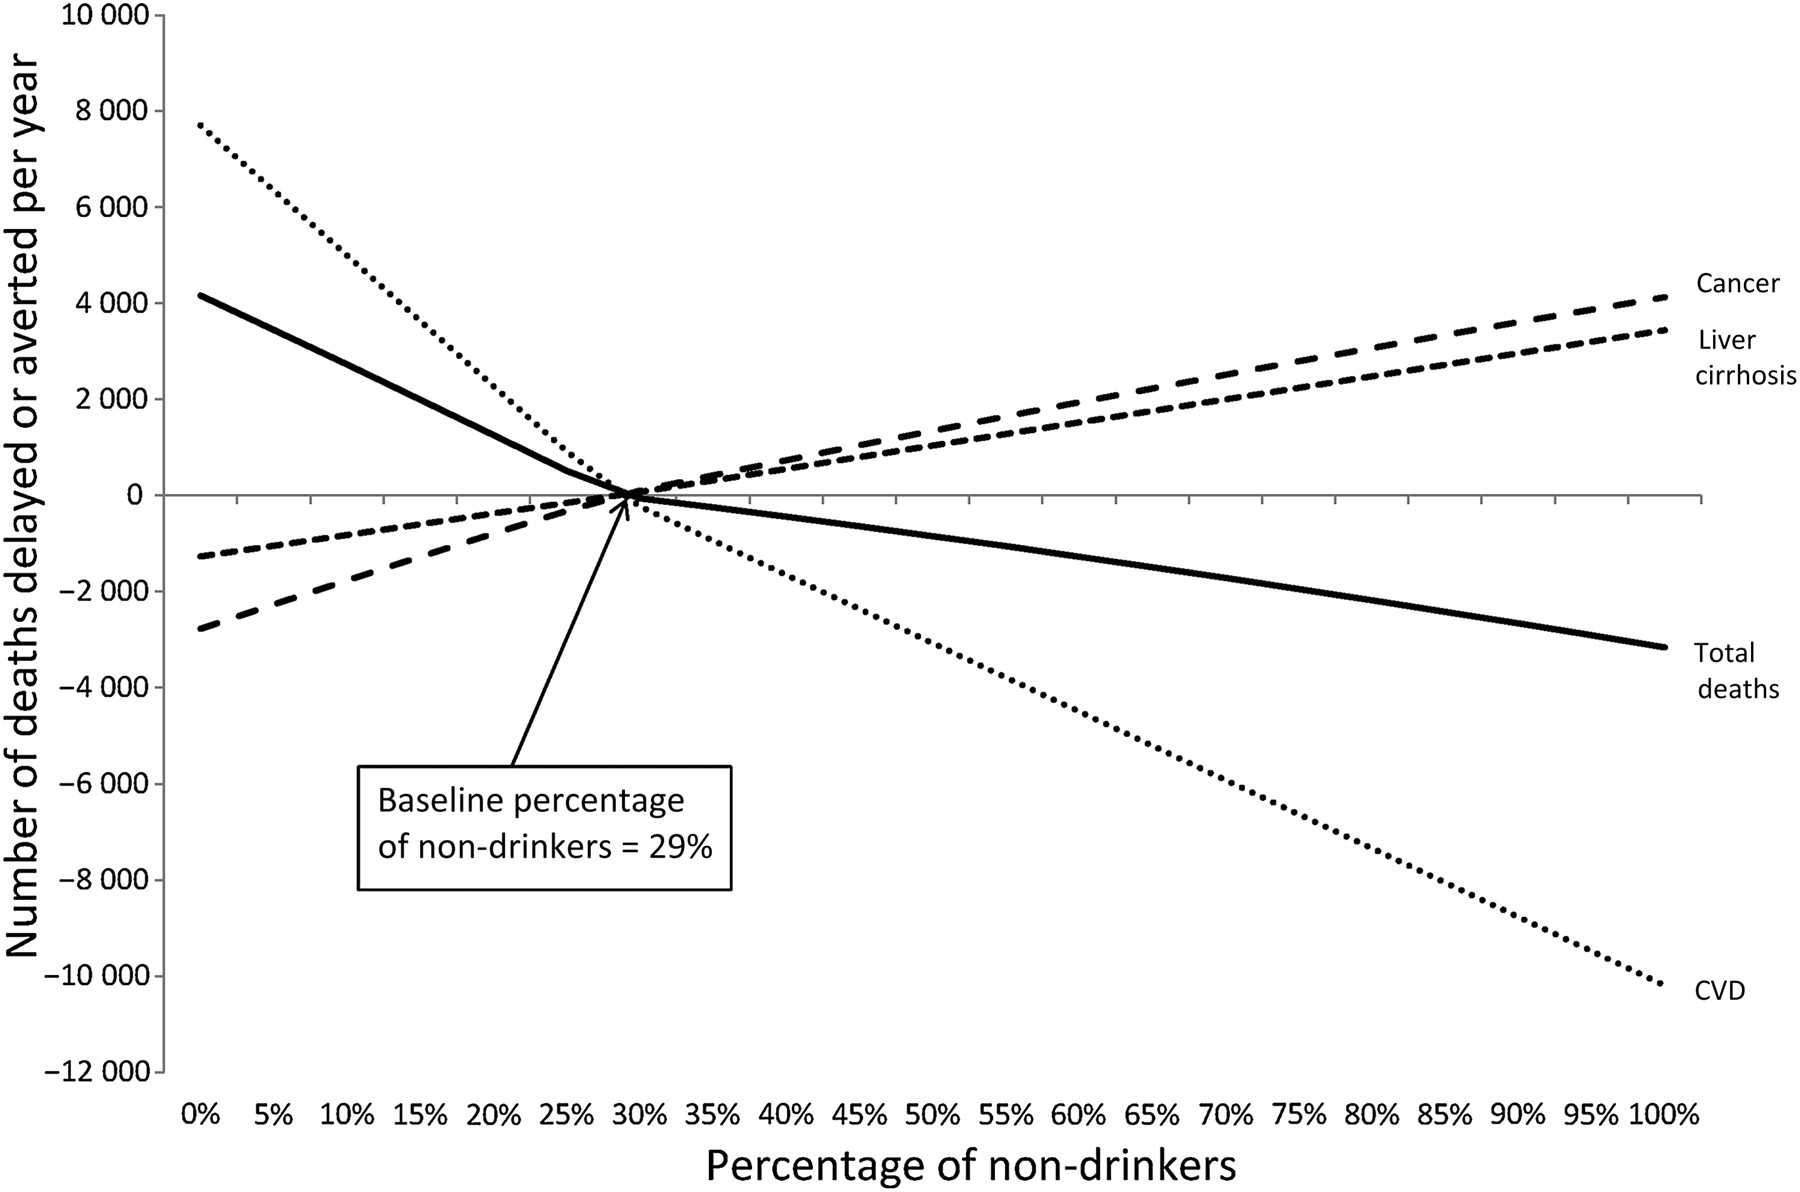
In the second counterfactual scenario, varying the proportion of non-drinkers in the whole population, the model showed a net increase in mortality in all versions of the scenario for which the modelled rates of non-drinking exceeded the 2006 levels, up to an additional 3160 (−436 to 6409) lives lost annually if the entire population were to abstain from alcohol.
Theoretically, optimal results were achieved when there were zero non-drinkers in the population (figure 2 and supplementary table S4), which resulted in 4160 (95% credible intervals: 908–6962) chronic disease deaths averted or delayed compared with 2006 mortality rates. Although a modelled situation in which the whole population consumes some alcohol would increase predicted deaths from cancer by 2771 (credible interval 2443–3898, +8% from 2006 levels) and from liver cirrhosis by 1265 (1166–1360, +22%), this was more than offset by averting 7705 (5248–11 934, −6%) deaths from CVD. As the proportion of non-drinkers was increased in the counterfactual scenarios, the reductions in mortality were attenuated.
Deaths delayed or averted in the counterfactual scenario varying percentages of non-drinkers. The percentage of non-drinkers was allowed to vary between 0% and 100% of the total population using England 2006 as the baseline. The median consumption of alcohol among those drinking was held constant.
Discussion
The PRIME-Alcohol model effectively demonstrates the potential impact of population usual alcohol consumption on chronic disease mortality, bringing together a wide range of risk and protective effects of alcohol, including the increased risks of many cancers and the protective effect of low-to-moderate consumption on CVD. Modelling demonstrated that the optimum population median alcohol consumption level appears to be substantially lower than the currently recommended safe levels in the current UK public health guidance. Based on this model, reducing the median population alcohol consumption among current drinkers to around half a unit (5 g of alcohol) per day would result in around 4600 fewer deaths annually, primarily due to reductions in cancers and liver cirrhosis. This level of consumption would equate to as little as one-quarter of a glass of wine or one-fifth of a pint of beer per day on average.
The model showed no additional benefit to chronic disease mortality if the proportion of the population abstaining from alcohol were to be increased. Results indicated that increasing the proportion of alcohol consumers in the population (drinking moderately) would result in reduced CVD mortality; however, this is of little practical relevance given that there are safer and more socially acceptable means of reducing CVD risk, and there are a number of reasons why it would be imprudent to encourage current non-drinkers to start drinking. These include the following: encouraging abstainers to start drinking while encouraging drinkers to reduce their alcohol consumption is a mixed message that may be difficult to communicate and promote and reducing the number of non-drinkers may have an adverse impact on non-chronic disease health (eg, accidents and injuries). Furthermore, modelled results show that while reducing the proportion of non-drinkers would decrease chronic disease deaths overall, this would increase the number of premature deaths (before 75 years; see supplementary table 4), increasing the impact on years of life lost. On this basis, we recommend that the public health target for alcohol consumption in England should be to reduce median alcohol consumption to half a unit per day for both men and women and to maintain the current level of non-drinkers within the population. The recommendations and public messages around restriction of alcohol consumption that would be required to achieve this target median level of consumption are beyond the scope of this work but should take account of the likely impacts on chronic disease as modelled here, as well as aiming to reduce other known risks and address patterns of consumption.
Public health behavioural recommendations should ideally be based on the best available evidence for optimising population health outcomes. In practice, public health goals in the UK have often been based on a mixture of evidence of health risks and pragmatic considerations about setting a goal that is considered achievable. A counterfactual modelling analysis such as the type reported in this paper is particularly useful for setting public health goals, as its flexibility can provide predicted impacts for a range of counterfactual scenarios, which can then inform policy makers both of the optimum goal and the strength of any pragmatic goal that they may consider.
A limitation of the PRIME-Alcohol model is that it is based on usual average levels of alcohol consumption and is unable to take account of patterns of drinking (eg, binge drinking) or provide any evidence about the least harmful pattern of alcohol consumption. There is evidence that patterns of drinking play an important role in disease risk21 and particularly in morbidity and mortality from accidents and injuries.2 5 The central recommendation from the results of this paper—that a target consumption level for England should be half a unit per day—is, however, likely to be consistent with low levels of risk for accidents and injuries. Heavy irregular drinking has also been linked with increased risk of CVD.21 Guidance to the public about avoiding heavy drinking sessions remains a very important component of any public health guidance around alcohol consumption. In addition, it is not possible to include wholly alcohol-attributable conditions (eg, mental and behavioural disorders due to alcohol use) in the model.
The PRIME-Alcohol model is necessarily limited by the availability of robust meta-analytic estimates of RR for mortality and estimates generated are limited by the quality of available evidence to parameterise the model. The observational studies included in the meta-analyses used to parameterise the PRIME-Alcohol model used self-report of alcohol consumption, which may result in an under-estimate of actual alcohol consumption,22 and results from observational studies cannot account for within-individual variability in alcohol consumption. Although there is a strong body of epidemiological evidence over many years linking moderate alcohol consumption with lower rates of CVD,23–25 concerns remain about possible residual confounding or other methodological explanations for the observed relationship.25 26
Sex-specific estimates of RR at varying levels of alcohol consumption were available only for hypertensive disease and liver cirrhosis, and no age-specific estimates were available, which limits the specificity of the counterfactual scenarios analysed by the model. Furthermore, results are based on the assumption of a steady-state relationship between alcohol consumption levels and RR of disease, while in reality, there is a lag time between changes in alcohol consumption levels and mortality risk. For some conditions included in the model, RR estimates from appropriate meta-analysis were available only for incidence of the disease, rather than mortality; however, this is unlikely to significantly impact on the accuracy of estimates unless there was an additional effect of alcohol consumption on case-fatality ratios for the included conditions.
The predicted results, in terms of increases or decreases in mortality expected at varying levels of alcohol consumption are entirely dependent upon the baseline population inputs—particularly current alcohol consumption levels and current levels of mortality from the included chronic diseases (which will reflect among other things, prevalence of other risk factors and both treatment- and prevention-related healthcare variables). The level of alcohol consumption associated with the most favourable predicted change from existing mortality levels may vary substantially between populations. It is also important to emphasise that the results indicate predicted impacts on mortality only and do not account for alcohol-related chronic disease morbidity, which has a significant impact on population health and the health system.
This study is an important addition to the current debate around alcohol consumption and public health, combining and balancing risk and protective factors to identify an optimal population level of alcohol consumption associated with reduced levels of chronic disease mortality. This is in contrast to recent publications focusing on the associations between alcohol and specific conditions. For example, Schutze and colleagues9 concluded that their analyses of the association between alcohol intake and cancer ‘support current political efforts to reduce or to abstain from alcohol consumption to reduce the incidence of cancer’. In contrast, a recent systematic review of the impact of alcohol on CVD concluded that ‘alcohol, in moderation, may have overall health benefits that outweigh the risks in selected subsets of patients’.11 Only by systematically combining the effects of alcohol on all alcohol-related conditions can appropriate public health messages be developed. The results of this modelling exercise contribute to further building all the evidence required to make such an assessment.
The findings from this paper are consistent with those from a meta-analysis of alcohol consumption and total mortality,27 which also found lowest mortality risk around 5 g of alcohol per day and a Europe-wide study28 that found minimum risk for alcohol-attributable deaths at 10 g/day or less (the smallest consumption category included in that study). A strength of our modelling approach, in comparison to cross-sectional studies or fixed meta-analyses of total mortality, is that it can account for differences between populations in underlying risk of various chronic diseases and can therefore be used to predict population-specific curves of potential changes in chronic disease mortality for international comparisons. Future work should therefore produce comparable results for international populations with varying current levels of exposure and outcomes. Furthermore, there is a significant interaction between alcohol consumption and other lifestyle risk factors for chronic disease mortality, and future work should seek to integrate alcohol consumption with risk behaviours such as poor nutrition, low physical activity and smoking to compare the relative contributions that improvements in these risk factors, both independently and in combination, could have on population health.
Conclusions
Our modelling suggests that the optimum level of reduced chronic disease mortality in England would be achieved at an average alcohol consumption level of around 5 g/day, which should be taken into account in the formulation of health guidance. It is likely that government recommendations would need to be set at a much lower level than the current ‘low-risk’ drinking guidelines in order to achieve this level.
References
Supplementary materials
Supplementary Data
This web only file has been produced by the BMJ Publishing Group from an electronic file supplied by the author(s) and has not been edited for content.
Files in this Data Supplement:
- Data supplement 1 - Online Supplementary information
Footnotes
To cite: Nichols M, Scarborough P, Allender S, et al. What is the optimal level of population alcohol consumption for chronic disease prevention in England? Modelling the impact of changes in average consumption levels. BMJ Open 2012;2:e000957. doi:10.1136/bmjopen-2012-000957
Contributors PS conceived the study and developed the methods, with support from MN, SA and MR. MN conducted literature searches to inform the model and PS and MN built the model and conducted analysis. All authors contributed to interpretation of the results. MN prepared the initial draft and led the preparation of the manuscript. All authors were involved in drafting and reviewing the manuscript. MN and PS act as guarantors for the manuscript.
Funding PS, SA and MR are supported by the British Heart Foundation (grant numbers PPC/Jul05/5b and PPC/JAN05/6biii). MN and SA were partially supported by the Australian Government Department of Health and Ageing.
Competing interests None.
Provenance and peer review Not commissioned; externally peer reviewed.
Data sharing statement The PRIME-Alcohol model is available for use upon request from PS (peter.scarborough{at}dph.ox.ac.uk).