Article Text

Abstract
Background Obesity is a complex trait with both environmental and genetic contributors. Genome-wide association studies have identified several variants that are robustly associated with obesity and body mass index (BMI), many of which are found within genes involved in appetite regulation. Currently, genetic association data for obesity are lacking in Africans—a single genome-wide association study and a few replication studies have been published in West Africa, but none have been performed in a South African population.
Objective To assess the association of candidate loci with BMI in black South Africans. The authors focused on single nucleotide polymorphisms (SNPs) in the FTO, LEP, LEPR, MC4R, NPY2R and POMC genes.
Design A genetic association study.
Participants 990 randomly selected individuals from the larger Birth to Twenty cohort (a longitudinal birth cohort study of health and development in Africans).
Measures The authors genotyped 44 SNPs within the six candidate genes that included known BMI-associated SNPs and tagSNPs based on linkage disequilibrium in an African population for FTO, LEP and NPY2R. To assess population substructure, the authors included 18 ancestry informative markers. Weight, height, sex, sex-specific pubertal stage and exact age collected during adolescence (13 years) were used to identify loci that predispose to obesity early in life.
Results Sex, sex-specific pubertal stage and exact age together explain 14.3% of the variation in log(BMI) at age 13. After adjustment for these factors, four SNPs were individually significantly associated with BMI: FTO rs17817449 (p=0.022), LEP rs10954174 (p=0.0004), LEP rs6966536 (p=0.012) and MC4R rs17782313 (p=0.045). Together the four SNPs account for 2.1% of the variation in log(BMI). Each risk allele was associated with an estimated average increase of 2.5% in BMI.
Conclusions The study highlighted SNPs in FTO and MC4R as potential genetic markers of obesity risk in South Africans. The association with two SNPs in the 3′ untranslated region of the LEP gene is novel.
This is an open-access article distributed under the terms of the Creative Commons Attribution Non-commercial License, which permits use, distribution, and reproduction in any medium, provided the original work is properly cited, the use is non commercial and is otherwise in compliance with the license. See: http://creativecommons.org/licenses/by-nc/2.0/ and http://creativecommons.org/licenses/by-nc/2.0/legalcode.
Statistics from Altmetric.com
Article summary
Article focus
This is a replication study aiming to reproduce BMI association findings from European cohorts in a South African population.
This study focused on genes linked to appetite control that were previously reported to show association with BMI or obesity and included FTO, LEP, LEPR, MC4R, NPY2R and POMC.
Adolescent data were used to facilitate the identification of genetic loci that predispose to obesity early in life, as it is known that overweight/obese children have an elevated risk of becoming obese adults.
Key messages
We found four SNPs were individually significantly associated with BMI: FTO rs17817449 (p=0.022), LEP rs10954174 (p=0.0004), LEP rs6966536 (p=0.012) and MC4R rs17782313 (p=0.045).
Together the four SNPs account for 2.1% of the variation in log(BMI).
We also demonstrated that an accumulation of risk alleles is linked to a significant increase in BMI—individuals with seven risk alleles had an 11.0% increase in median BMI compared with those with two risk alleles.
Strengths and limitations of this study
This study provides the first preliminary evidence of the role of genetic variants in obesity risk in an adolescent black South African population.
This study was only moderately powered to detect association with BMI, and not all genes were exhaustively investigated.
TagSNP selection would have been enhanced if South African data were available for this approach.
Introduction
Being overweight or obese is a significant risk factor for the development of chronic diseases like type II diabetes and cardiovascular disease and is becoming increasingly common in low- and middle-income countries.1 Both environmental and genetic factors influence body mass, with the heritability of body mass index (BMI, kg/m2) estimated at 40%–70%.2
The study of syndromic obesity and genome-wide association studies (GWAS) of common measures of adiposity (eg, BMI) have provided evidence for genetic risk loci for obesity.3 4 Current GWAS have primarily focused on populations of European origin, and only one GWAS for anthropomorphic traits, including BMI, has been performed in an indigenous African population. This study was carried out in a cohort of 1188 Nigerian subjects and replicated the association of MC4R with BMI, but no other significant associations were detected.5 However, the study was underpowered to detect modest effects. Although several replication studies have been performed in African–Americans,6 7 only a few are reported in well-characterised African populations8 9 and showed some supporting evidence of the role of FTO in a Nigerian population but not in the Gambia. Genetic association studies in African populations have the significant advantage that linkage disequilibrium (LD) generally exists over a shorter genomic distance, potentially increasing the efficiency of the identification of causal variants.10
Several of the likely causal genes for increased body fat mass are involved in appetite regulation. Specifically, constituents of the leptin–melanocortin neurotransmission pathway have been implicated in both monogenic and polygenic obesity. Recent evidence that FTO (the only gene consistently associated with measures of obesity) acts on the central nervous system-mediated control of food intake11 lends further support for the hypothesis that obesity may be a heritable neurobehavioral disorder.
Obesity levels are rising at an alarming rate among black South Africans, with 29% and 57% of men and women, respectively, being overweight or obese. The major impact of obesity on the development of chronic diseases within South Africa is demonstrated by data showing that in the year 2000, 87% of type II diabetes cases and 68% of hypertensive disease were attributable to a BMI of ≥21.1 The multifactorial nature of these conditions creates a challenge, and understanding the genetic contribution to obesity in black South Africans may influence the nature of effective interventions. The aim of this study was therefore to assess the association of genetic variants with BMI in black South African adolescents. We focused on genes linked to appetite control that were previously reported to show association with BMI or obesity: FTO, LEP, LEPR, MC4R, NPY2R and POMC.
Methods
Participants
The investigation focused on participants of the South African Birth to Twenty (Bt20) cohort study. Bt20 is a longitudinal study of the health and well-being of children who were born in the metropolitan area of Soweto, Johannesburg, during a 6-week period in 1990. Participants in Bt20 were enrolled at birth, and detailed information has been collected from the participants and their care givers over the past 20 years.12 Following informed consent, blood samples were collected and DNA extracted using a salting-out method.13 The Bt20 research programme has received clearance by the Human Research Ethics Committee: (Medical) of the University of the Witwatersrand (M010556). The Federal-Wide Assurance registration number of the committee is FWA00000715.
A subset of individuals from the Bt20 cohort (524 female and 466 male adolescents, total n=990) were randomly selected for this study. This represents 43% of the total cohort (2290 participants). The following calculation illustrates that this study was adequately powered. Group sizes of 748, 204 and 21 (total=973), corresponding to rs10954174 genotype frequencies observed in this study, will achieve 93% power to detect differences among the means of BMI using an F test with a 0.05 significance level, as is standard in linear regression models. The size of the variation in the means (say 18, 19 and 20) is represented by their SD, which is 0.47. The common SD within a group is assumed to be 4.
Adolescent data (participants were 13 years of age at the time measurements were done) were used to facilitate the identification of genetic loci that predispose to obesity early in life, as it is known that overweight/obese children have an elevated risk of becoming obese adults.14 Anthropometric measurements were obtained using standard methods.15 BMI was computed as weight (measured in kilogram) divided by the square of the height (measured in metres) of an individual. Pubertal stage was assessed using a validated self-assessment method drawing upon the Tanner Sexual Development Tool,16 and exact age at time of measurement was recorded.
Population substructure
A set of 18 ancestry informative markers (AIMs) were included to assess population substructure within the study group, based on previously published data17 and local unpublished data.18 Population substructure was assessed computationally using STRUCTURE V.2.3.3 software.19 For comparative purposes, genotypes of the AIMs were obtained from HapMap (release 24) for three additional populations—the Yoruba from Nigeria (YRI), the Han Chinese population (CHB) and Utah residents with European ancestry (CEU). STRUCTURE implements the value K to distinguish parental populations, with K referring to the number of inferred population clusters. The true value of K may not always be known, but the smallest value of K that captures the majority of structure in the data should be obtained. Ten iterations at K=1 to K=4 with a burn-in of 30 000 followed by 100 000 iterations were implemented. The K value with the highest average posterior likelihood score was calculated and used to identify the best cluster assignment.
Single nucleotide polymorphism selection
Single nucleotide polymorphisms (SNPs) previously shown to be associated with BMI or obesity in FTO, LEP, LEPR, MC4R, NPY2R and POMC were identified from the literature. In addition, tagSNPs were selected for LEP, NPY2R and POMC to ensure that known common polymorphisms are either directly assayed or associated with a tagSNP in these genes. SNPs from the literature were not force included in tagSNP selection. The Tagger algorithm20 was used to select tagSNPs in a multimarker approach at r2>0.80 and with a minor allele frequency >0.05 among publicly available African data (YRI) from the HapMap data set (release 24). The Illumina Assay Design Tool (Illumina, San Diego, California, USA) was used to assess the SNPs' compatibility for inclusion in a custom-design GoldenGate VeraCode Assay, and 62 SNPs were selected for genotyping (supplementary table 1).
Genotyping
Genotyping was performed using the Illumina GoldenGate VeraCode assay (Illumina). Quality control was performed on all raw genotype data according to the supplier's specifications using BeadStudio V.2.0 software (Illumina) (summarised in Tindall et al21). Standard quality control filters were applied to the data22: minor allele frequency >0.01, SNP missingness rate <0.05, individual missingness rate <0.2 and Hardy–Weinberg equilibrium (HWE) <1×10⁻⁴.
LD plots
LD was visualised using Haploview V.4.2,23 implementing the CI method of Gabriel et al24 to construct haplotype blocks. The chromosomal location of SNPs was obtained from NCBI (genome build 37.1).
Statistical analysis
The programming environment R, and R package genetics were used for all statistics (http://www.r-project.org).
Individual genotype associations with BMI
Genotype and allele frequencies were calculated through direct counting. The distribution of BMI was skewed to the right, and therefore, BMI was log-transformed to approximate normality for all analyses. Linear models were used for all analyses (individual association, joint association, sex-specific association and risk score association), starting by comparing BMI between genotype groups, enabling adjustment for confounders. As BMI correlated significantly with sex, sex-specific pubertal stage and exact age, some analyses were adjusted for these variables by including them in the linear models as covariates. All association p values are from linear models of log(BMI). Exact tests of HWE were also performed. Because of its skewed distribution in this study group, BMI is summarised as median values and IQRs, with lower quartile and upper quartiles reported.
Furthermore, each genotype was modelled additively as the number of minor alleles present. Because we modelled log(BMI), the modelled effect of each allele is reported as a percentage change (increase or decrease) in BMI.
Joint model and allele risk score of all associated SNPs
We also created and summarised a linear model containing all the variants that were individually significantly associated with BMI. We used all significantly associated variants to calculate a risk allele score by counting the number of alleles associated with increasing BMI in each adolescent. This risk allele score was also assessed with a linear model, independent of the three confounders.
Sex-specific effects
In order to detect sex-specific effects, we modelled the interaction between sex and each variant and summarised the significant results.
Correcting for multiple testing
Correcting for multiple testing is a contentious issue, and some approaches (such as Bonferroni correction) are considered overconservative and one risks the rejection of true findings.25 26 Given the strong prior information about the role of the variation tested here in obesity, we considered this a replication study, and therefore, p values below 0.05 were considered significant. For tagSNPs, tests of associations could be considered discovery rather than replication, but since these markers are correlated due to LD, the Bonferroni assumption of independence is not upheld.
Results
Participants
The study group consists of 524 (53.0%) female and 466 (47.0%) male adolescents, with a mean age of 13.7 years (SD=0.2 years). Female adolescents had a higher median BMI (19.4 (IQR=17.8–22.3)) than male adolescents (18.0 (IQR=16.6–19.7); p<0.0001). BMI increased across the five pubertal stages in both male (p<0.0324) and female adolescents (p<0.0001), but at significantly different rates. Exact age (days) correlated positively with BMI in male adolescents (p=0.027) but not in female adolescents (p=0.305). In a joint model, sex, sex-specific pubertal stage and age each correlated independently with BMI and together explained 14.3% (p<0.001) of the variation in log(BMI). Pubertal effect when assessed alone had the greatest impact (10.7%) followed by sex (5.7%). As a result, all analyses were adjusted for age, sex and pubertal stage per sex. Unadjusted p values of individual tests are presented for comparison (table 1).
Candidate SNP allele and genotype frequencies in a black South African population, and p values for additive allelic association with log(BMI) in adolescents aged 13 years
Population substructure
One AIM failed quality control measures and was subsequently excluded from analysis. Analysis of allele frequencies of AIMs in the South African cohort (supplementary table 2), and comparison to three other ethnic groups (supplementary table 3), confirmed that there was no significant population substructure within the study cohort (supplementary figure 1). The South African population and the YRI group showed distinctive clustering away from the Caucasian and Asian populations. Although the South African cohort and the YRI had similar clustering patterns, higher order clustering of all individuals included in this analysis (ie, higher values of K, where K indicates the number of parental populations) was shown to highlight the genetic distinction between these two African groups.
LD plot
To illustrate the unique patterns of LD in the South African population, an LD plot of the gene most significantly associated with BMI (LEP) was constructed (supplementary figure 2). Evidence of three LD blocks covering the gene is observed, with the 3′ end of the gene in particular exhibiting high LD.
Statistical analysis
Individual genotype associations with BMI
The genotype and allele frequencies of all candidate SNPs, as well as p values for tests of additive allelic association with log(BMI) are shown in table 1. All SNPs were in HWE (table 1). Table 2 presents the median and IQR of BMI for SNPs that were significantly associated with BMI following adjustment for sex, pubertal stage and age. Estimated effect sizes (percentage difference in BMI associated with each additional minor allele compared with the major allele homozygote) adjusted for age, sex and pubertal stage are also presented. For two SNPs, LEP rs6966536 and FTO rs17817449, the minor allele (G in both cases) is associated with increased BMI, whereas the major allele is associated with increased BMI for the other two SNPs, LEP rs10954174 and MC4R rs17782313 (G and T, respectively). When referring to ‘risk’ allele, it is the allele that is associated with increased BMI.
Summary BMI statistics for SNPs that were individually associated with BMI
For LEP rs6966536, each G-allele was associated with a 2.9% higher BMI (p=0.012), whereas for LEP rs10954174, each A-allele is associated with an estimated decrease of 4.0% in BMI (p<0.001). Thus, for an adolescent of the same age, sex and pubertal stage, we would expect an individual with the A/G genotype at rs10954174 to have a BMI that is 4.0% less than that of a G/G homozygote; and the A/A homozygote is expected to have an 8.0% lower BMI compared with the G/G homozygote. Adolescents who are A/G heterozygotes for LEP rs6966536 are expected to have a 2.9% higher BMI than A/A homozygotes, while the G/G homozygotes would have a 5.8% higher BMI.
Sex-specific effects
Two SNPs—MC4R rs12970134 and NPY2R rs11099992—showed significant sex differences in their effects on BMI (results not shown). In female adolescents, each G-allele of the NPY2R rs11099992 SNP predicted a decrease in BMI by 3.7% (p=0.003), while in male adolescents, the effect was not significant (p=0.523). In male adolescents, each A-allele of the MC4R rs12970134 SNP predicted an increase in BMI of 5.2% (p=0.011), while in female adolescents, the effect was not significant (p=0.785). These SNPs were not associated with log(BMI) in the group as a whole (table 1).
Joint model
To assess the combined effect of the four SNPs that were individually associated with log(BMI) and the three confounders (sex, pubertal stage and age), a model was built based on 908 participants who had complete information. The model explained 16.4% of the variation in log(BMI), so that the four variants contributed 2.1% to the variation, independent of the three confounders (table 3).The two LEP SNPs had the largest effects, followed by the FTO and then the MC4R SNPs, which each had similar effect sizes (2.2 and −2.0, respectively). The seven FTO SNPs in this study explain 0.6% of variation in log(BMI) after adjusting for age-, gender- and sex-specific pubertal stage and 1.4% unadjusted.
Joint model of SNPs individually associated with log(BMI)
Allelic risk score
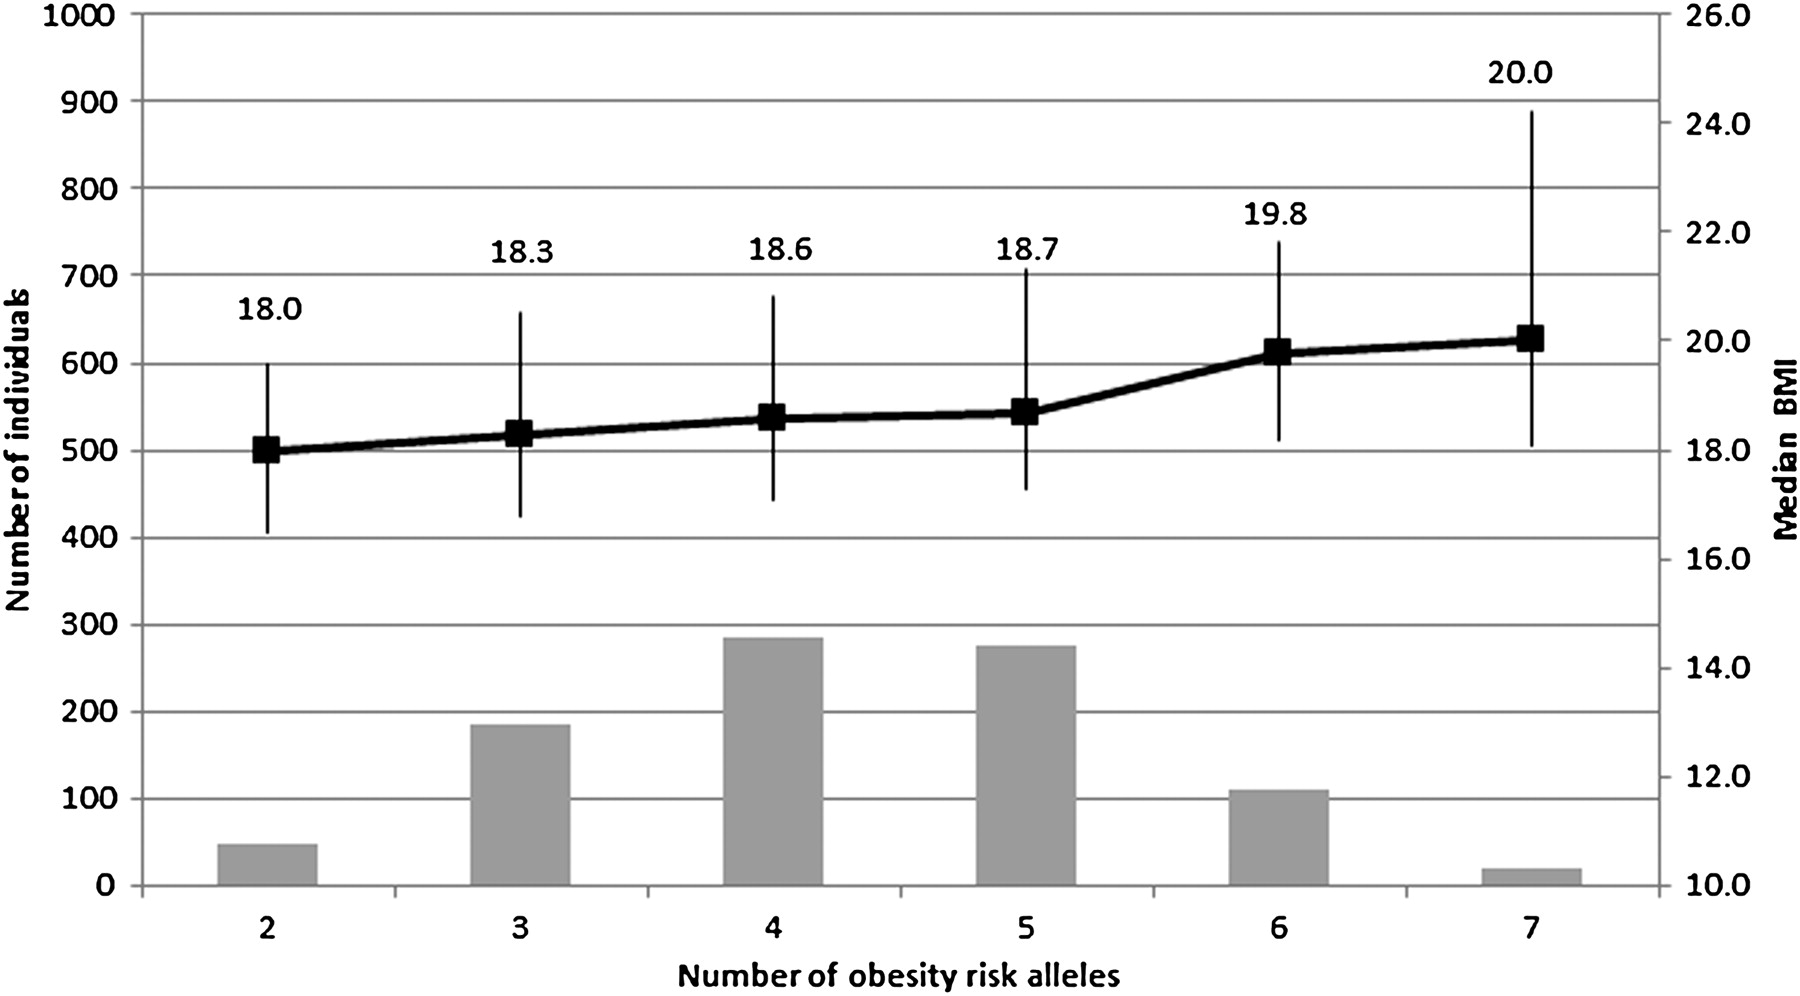
Figure 1 shows the number of adolescents with each number of additive risk alleles (the allele associated with higher BMI—four loci and therefore a maximum of eight risk alleles in an individual) as well as the median and IQR of BMI for each group. Since there were <10 individuals each in the categories of one risk allele (seven individuals) and eight risk alleles (one individual), these were excluded from the figure. The estimated increase in BMI, for each risk allele, is 2.5%, independent of age, sex and sex-specific pubertal stage, and individuals with seven risk alleles had an 11.0% increase ((20.0−18.0)/18.0) in median BMI compared with a group of individuals with two risk alleles.

Observed cumulative effect of high-risk alleles on body mass index (BMI) in a black South African adolescent cohort. The four risk alleles included in this analysis are: LEP rs6966536 (G-allele), LEP rs10954174 (G-allele), MC4R rs17782313 (G-allele) and FTO rs17817449 (T-allele). Bar chart (left axis) shows number of adolescents with specific number of obesity risk alleles. Points show corresponding median (right axis) and vertical lines represent the IQR of BMI.
Discussion
This study provides preliminary evidence of the role of genetic variants in obesity risk in an adolescent black South African group. Individual SNPs in FTO, LEP and MC4R genes were shown to be associated with an increase in BMI, and the cumulative effect of the risk alleles (one to eight alleles) in FTO, LEP and MC4R was demonstrated. Together they contribute 2.1% to the variation observed in log(BMI) in this group of subjects, after adjusting for age, sex and sex-specific pubertal stage. Recent GWAS in populations of European ancestry have identified 32 common loci associated with BMI, explaining only 1.5% of the interindividual variation in BMI.4 We also demonstrated that an accumulation of risk alleles is linked to a significant increase in BMI (figure 1). In our study, individuals with seven risk alleles had an 11.0% increase in median BMI compared with individuals with two risk alleles.
We provide preliminary evidence that SNPs in the 3′ untranslated region (3′UTR) of LEP (rs10954174, p=0.0004 and rs6966536, p=0.012) are associated with BMI in South Africans. Leptin is an integral molecule in energy homeostasis, and circulating leptin is primarily produced by adipocytes. The level of circulating leptin acts as a satiety signal. Coding or splice site mutations in the LEP gene render the leptin protein unable to signal through its receptor, which leads to severe childhood-onset obesity.27 28 These mutations are rare in the general population, and their impact on the common obesity phenotype remains unclear.
The LEP SNPs that have been most consistently associated with obesity are rs2167270 (also known as LEP 19G>A) in the untranslated first exon,29–31 and rs7799039 (LEP −2548G>A) in the 5′-region of the gene.32–35 Studies in a Brazilian population34 36 and adult Samoans37 have also shown obesity to be correlated with variants of the LEP 3′ hypervariable region (HVR). The 3′HVR is a (TTTC)n tetranucleotide repeat located approximately 2000 bp downstream from LEP. The 3′UTR SNPs associated with BMI in this study do not share a haplotype block with the 3′HVR in Africans and could be a manifestation of a uniquely African association to BMI and obesity. There are several plausible mechanisms by which a 3′UTR variant could impact on the functioning of a gene. They could reside in regions of miRNA binding sites or may affect gene expression in other ways as 3′UTRs have been shown to be involved in posttranscriptional regulation of gene expression through the modulation of nucleocytoplasmic mRNA transport, translation efficiency, subcellular localisation and message stability.38
Variants in FTO (the only gene consistently associated with obesity) have been associated with adiposity measures in Europeans,4 39 Asians40 41 and African–Americans,7 with the strongest effect seen with SNP rs9939609. Our study showed a modest association between the FTO SNP, rs17817449, and BMI after adjustment for sex, age and sex-specific pubertal stage. An estimated effect size of a 1.9% increase in BMI for each minor allele of rs17817449 was observed. Inconsistent associations between FTO variants and obesity measures have been observed in native African populations. In Gambians, no associations between FTO and weight-for-height z scores were observed.9 rs17817449 was directly assayed in that study but showed no association. It should be noted that the Gambia has a very low obesity rate, which could possibly explain the null result. In West Africans, rs17817449 was not associated with BMI, but several other FTO variants were found to be associated.8 The role of genetic variation at the FTO locus in predisposing to obesity in African populations warrants further investigation, specifically in relation to the epidemiological transition and access to a calorie-rich diet.
The rs17782313 SNP is one of several variants in MC4R linked to BMI in European populations and has been shown to contribute to a significant increase in extreme obesity in adults.42 In the present study, this variant showed a borderline association with BMI (p=0.045), suggesting that this SNP is not the functional variant. It is located 3′ to the gene, and it is therefore possible that it may be in LD with another polymorphism that disrupts the function of cis-acting elements involved in the control of MC4R gene transcription.43
In this study, the SNP rs11099992 in NPY2R was observed to associate with BMI in female subjects only (p=0.003), whereas, MC4R rs12970134 showed a sex-specific effect in male subjects (p=0.011). It has been observed that SNPs in the NPY2R gene have effects on obesity in male subjects only.44–46 One of these studies also showed that a SNP in PYY (encoding a ligand of NPY2R) associates with obesity-related traits in female subjects only.45 Furthermore, mutations in the MC4R gene that have been associated with morbid obesity have stronger effects in female subjects than male subjects.47 These data suggest that the phenotypic effect of sequence variation in the MC4R gene is differentially modified by sex depending on the site of the variant. Thus, genetic variants relevant to appetite-regulatory pathways seem to have sex-specific effects on body composition, but the mechanism by which this occurs is still poorly understood.
The data in this study are derived from a cohort of adolescents in the midst of puberty. It is therefore possible that the effects on weight of some polymorphisms may have been masked by puberty-associated changes in body fat mass.48–50 It is also possible that the effects of some polymorphisms on BMI are observed only later in life.51 However, it has been shown that the FTO and MC4R polymorphisms do influence anthropometry in adults and children and that other polymorphisms identified in GWAS in adults also have observable effects on childhood measures of adiposity.42 52–54
Replication has become the gold standard for assessing the validity of statistically significant results from association studies. However, a true result can fail to replicate in another independent sample for numerous reasons including differences in allele frequencies and haplotype structure that could influence the indirect detection of functional polymorphisms. A recent study showed that the power to replicate the statistically significant independent main effect of one polymorphism can drop dramatically with a change of allele frequency of <0.1 at a second interacting polymorphism. Differences in allele frequency could also result in a reversal of allelic effects where a putative protective allele becomes associated with increased risk in a replication study.55 These are particularly important considerations when undertaking genomic research and replication studies in African populations, with known high levels of genome diversity and population substructure between different African groups.56 57 The AIM data obtained in this study highlight that there are not high levels of heterogeneity within the South African group, but that the group differs from other African tribes, such as the Yoruba. Despite these differences, 18 AIMs cannot resolve the detailed population differences between this South African population and other African groups, as the Bantu expansion occurred rather recently in history (∼4000 years ago), and one would expect that only major differences would be observable when interrogating a small number of markers.57
Further studies on other candidate obesity loci in African populations will provide a better understanding of the role of variants in these genes in a population with a different LD structure to that of Caucasians.58 In addition, a thorough examination of other measures of obesity is needed to better understand the complexities of obesity risk across different populations.3 Such studies will be enhanced by more detailed phenotypic characterisation of study cohorts that includes body fat distribution, as this is known to be a significant risk factor for other chronic diseases, such as cardiovascular disease and type II diabetes.59
Acknowledgments
The authors thank the participants in the Birth to Twenty study and acknowledge funding from the Wellcome Trust, the South African MRC, the South African National Research Foundation and University of the Witwatersrand for the collection and genotyping of samples.
References
Supplementary materials
Supplementary Data
This web only file has been produced by the BMJ Publishing Group from an electronic file supplied by the author(s) and has not been edited for content.
Files in this Data Supplement:
- Data supplement 1 - Online figure 1
- Data supplement 2 - Online figure 2
- Data supplement 3 - Online table
- Data supplement 4 - Online Supplementary figures
Footnotes
To cite: Lombard Z, Crowther NJ, van der Merwe L, et al. Appetite regulation genes are associated with body mass index in black South African adolescents: a genetic association study. BMJ Open 2012;2:e000873. doi:10.1136/bmjopen-2012-000873
Contributors SAN, MR, ZL and NJC conceived the idea for the study. SAN provided access to all phenotypic data used in this study. ZL and PP performed the SNP selection and laboratory work. PP completed the STRUCTURE analysis, ZL the Haploview plots and NJC the allelic risk score computation. LvdM performed all other statistical analyses. ZL wrote the first draft of the manuscript, and all authors contributed to, read and approved the final manuscript.
Funding This work was supported by the Wellcome Trust (grant number 080535/Z/06/Z to SAN); the South African Medical Research Council and the University of the Witwatersrand for the collection of the samples for the Bt20 cohort and genotyping. In addition, genotyping was funded by the South African National Research Foundation (grant number IFR2011062100004 to MR).
Competing interests None.
Ethics approval Ethics approval was provided by Human Research Ethics Committee: (Medical) of the University of the Witwatersrand.
Provenance and peer review Not commissioned; externally peer reviewed.
Data sharing statement No additional data are available.