Article Text

Abstract
Objective To compare trends in metrics of socioeconomic inequalities in premature coronary heart disease (CHD) mortality in Great Britain.
Design Time trend ecological study with area-level deprivation as exposure.
Setting Great Britain, 1994–2008.
Participants Men and women aged younger than 75 years. No lower age limit.
Interventions None.
Main outcome measures CHD mortality rates.
Results There has been a decrease in socioeconomic inequalities in CHD mortality in absolute terms but an increase in relative terms. CHD mortality rates in men aged younger than 75 years fell by 69 per 100 000 (95% CIs 64 to 74) in the least deprived quintile and by 92 per 100 000 (95% CI 86 to 98) in the most deprived quintile (p for trend: <0.001). Mortality rate ratios comparing the most deprived quintile to the least deprived quintile increased in women aged younger than 75 years from 1.77 (95% CI 1.68 to 1.86) to 2.32 (95% CI 2.14 to 2.52). There was a weak negative association between the average decline of relative rates and area deprivation.
Conclusions It could either be said that inequalities in premature mortality from CHD between affluent and deprived areas have widened or narrowed between 1994 and 2008 depending on the measurement technique. In the context of falling CHD mortality rates, narrowing of absolute inequalities is to be expected, but increases in relative inequalities are a cause for concern.
This is an open-access article distributed under the terms of the Creative Commons Attribution Non-commercial License, which permits use, distribution, and reproduction in any medium, provided the original work is properly cited, the use is non commercial and is otherwise in compliance with the license. See: http://creativecommons.org/licenses/by-nc/2.0/ and http://creativecommons.org/licenses/by-nc/2.0/legalcode.
Statistics from Altmetric.com
Article summary
Article focus
CHD mortality in Great Britain has declined steadily over the past 30 years.
Socioeconomic inequalities in CHD mortality have persisted for many years.
There are different assessments as to whether inequalities in CHD are widening or narrowing, depending on whether absolute or relative measurements are considered.
Key messages
There has been a narrowing in Great Britain of absolute socioeconomic inequalities in premature CHD mortality rates over the past 15 years.
There has been a substantial widening in relative socioeconomic inequalities over this time period, particularly for women.
Although relative decline in premature CHD mortality rates over this time period is clearly socially patterned, area-level deprivation only explains a small amount of the variance in rates of decline.
Strengths and limitations of this study
The strengths of this study are that trends are examined across the whole of Great Britain over a significant period of time.
However, deprivation was only assessed at a single point in time and therefore this may have resulted in misclassification over time.
CHD is a condition with a long aetiology; therefore, area of residence at death is a limited indicator of socioeconomic status over the life course.
Introduction
There have been widespread social inequalities in health for many years, with higher mortality rates in more deprived areas than those that are less deprived.1 The Independent Inquiry into Inequalities in Health in the late 1990s documented a widening of inequalities in mortality2 and most recently the publication ‘Fair Society, Healthy Lives’ reported the persistence of inequalities across a range of health outcomes.3 Coronary heart disease (CHD) outcomes are a good indicator of social inequalities in health since many of the behavioural and medical risk factors for CHD are socially patterned.4 It is the cause for around one in 10 deaths in women aged younger than 75 years and one in five deaths in men aged younger than 75 years,4 and there is wide variation in CHD mortality across different socioeconomic groups, with rates for men living in the most deprived twentieth in England and Wales in 2004 more than three and a half times higher than rates in the least deprived twentieth.5 Reduction in social inequalities in CHD mortality was a key health target for the recent labour government.6
Trends in overall CHD mortality rates have been declining in Great Britain since the 1970s. In the last 10 years, premature (younger than 75 years) mortality rates have fallen by around 45%.4 This reflects both improvements in cardiovascular risk factor profiles (primarily reductions in smoking) and advancements in treatment.7–9 However, improvements in prevention or treatment can occur at different rates for different socioeconomic groups,10 which could result in widening of inequality.
Evidence on socioeconomic trends in CHD mortality is difficult to interpret because of differences in methodology and inconsistencies in definitions of areas and populations. Trends can be expressed in absolute terms or relative terms11 and provide different assessments of whether social inequalities in health are currently widening or narrowing. While some studies have suggested that inequalities in mortality have not only persisted but may have increased in England and in other European countries,12–14 other analyses have reported a narrowing of inequalities.6 ,15 It has been argued that both absolute and relative trends should be presented16 because as Blakely et al17 highlighted, relative differences can often increase in the context of decreasing absolute differences.
This study undertakes a comprehensive analysis of trends in CHD mortality over a 15-year period between 1994 and 2008 in Great Britain reporting inequalities in both absolute and relative terms.
Methods
Annual CHD mortality rates were constructed for each unitary authority and local authority district in Great Britain (n=408, henceforth ‘local authority’) for the years 1994–2008 inclusive. The time period coincides with the provision of statistics using consistent local authority boundaries, allowing for analysis using small areas over a 15-year period. Deaths in Great Britain with CHD listed as the primary cause of death (ICD-9 410–414; ICD-10 I20–25) were included. Mortality rates were constructed for premature mortality (under the age of 75) for men and women separately. Death certificate data were obtained for England and Wales from the Office for National Statistics and for Scotland from the Government Registry Office for Scotland. Data were obtained by sex, 5-year age group and local authority of residence. Population data were taken from local authority estimates extrapolated from the 1991 and 2001 censuses constructed by the Office for National Statistics and Government Registry Office for Scotland. Mortality rates were adjusted for age by using the direct method of standardisation, using the European Standard Population as the reference population.
The Carstairs index for 2001 was used as the area-level measure of deprivation.18 The index is a standardised sum of the proportion of all unemployed men, persons in households with one or more persons per room, proportion of residents in households with no car and proportion of residents in households with head of household in Social Class IV or V (Registrar General's classification).19 For this study, we calculated the index for all local authorities in Great Britain using census data available from 2001 based on methodology available from the University of Manchester.20 Areas were then grouped into quintiles according to their Carstairs score, and the mean mortality rates were calculated for each quintile. The Carstairs index has previously been shown to be strongly correlated with male and female CHD rates for local authorities in England and Wales.5
This study uses several different approaches to assess trends in socioeconomic inequalities in CHD mortality. First, trends in mean absolute CHD mortality rates across different quintiles were calculated. Second, the same trends were calculated in relative terms. For every quintile, the mean absolute mortality for each year was calculated as a percentage of the mean absolute mortality rate in the first year of analysis (1994) to demonstrate the percentage change in rates since the baseline year. Non-parametric tests for trend developed by Cuzick were conducted to assess significance of trends in relative and absolute decline in mortality rates by quintile of deprivation. Third, mortality rate ratios were calculated for each year, with mortality rates in the least deprived quintile used as the base of the ratio. Finally, the association between mean annual percentage decline in mortality rates and area-level deprivation for local authorities was assessed. The annual average percentage decline over the 15-year period was calculated independently for each local authority. This was done using a linear regression analysis of relative mortality rates over the 15-year period in each local authority to generate a β coefficient value that was used as a marker of average annual percentage decline. The relationship between this β coefficient value and the associated Carstairs Deprivation index for each individual local authority was then assessed using a second linear regression analysis. The 95% CIs were calculated for changes in absolute and relative mortality rates by quintile and for rate ratios between the most and least deprived quintile in each year. All analyses were performed using Stata version 10.
Results
Absolute decline
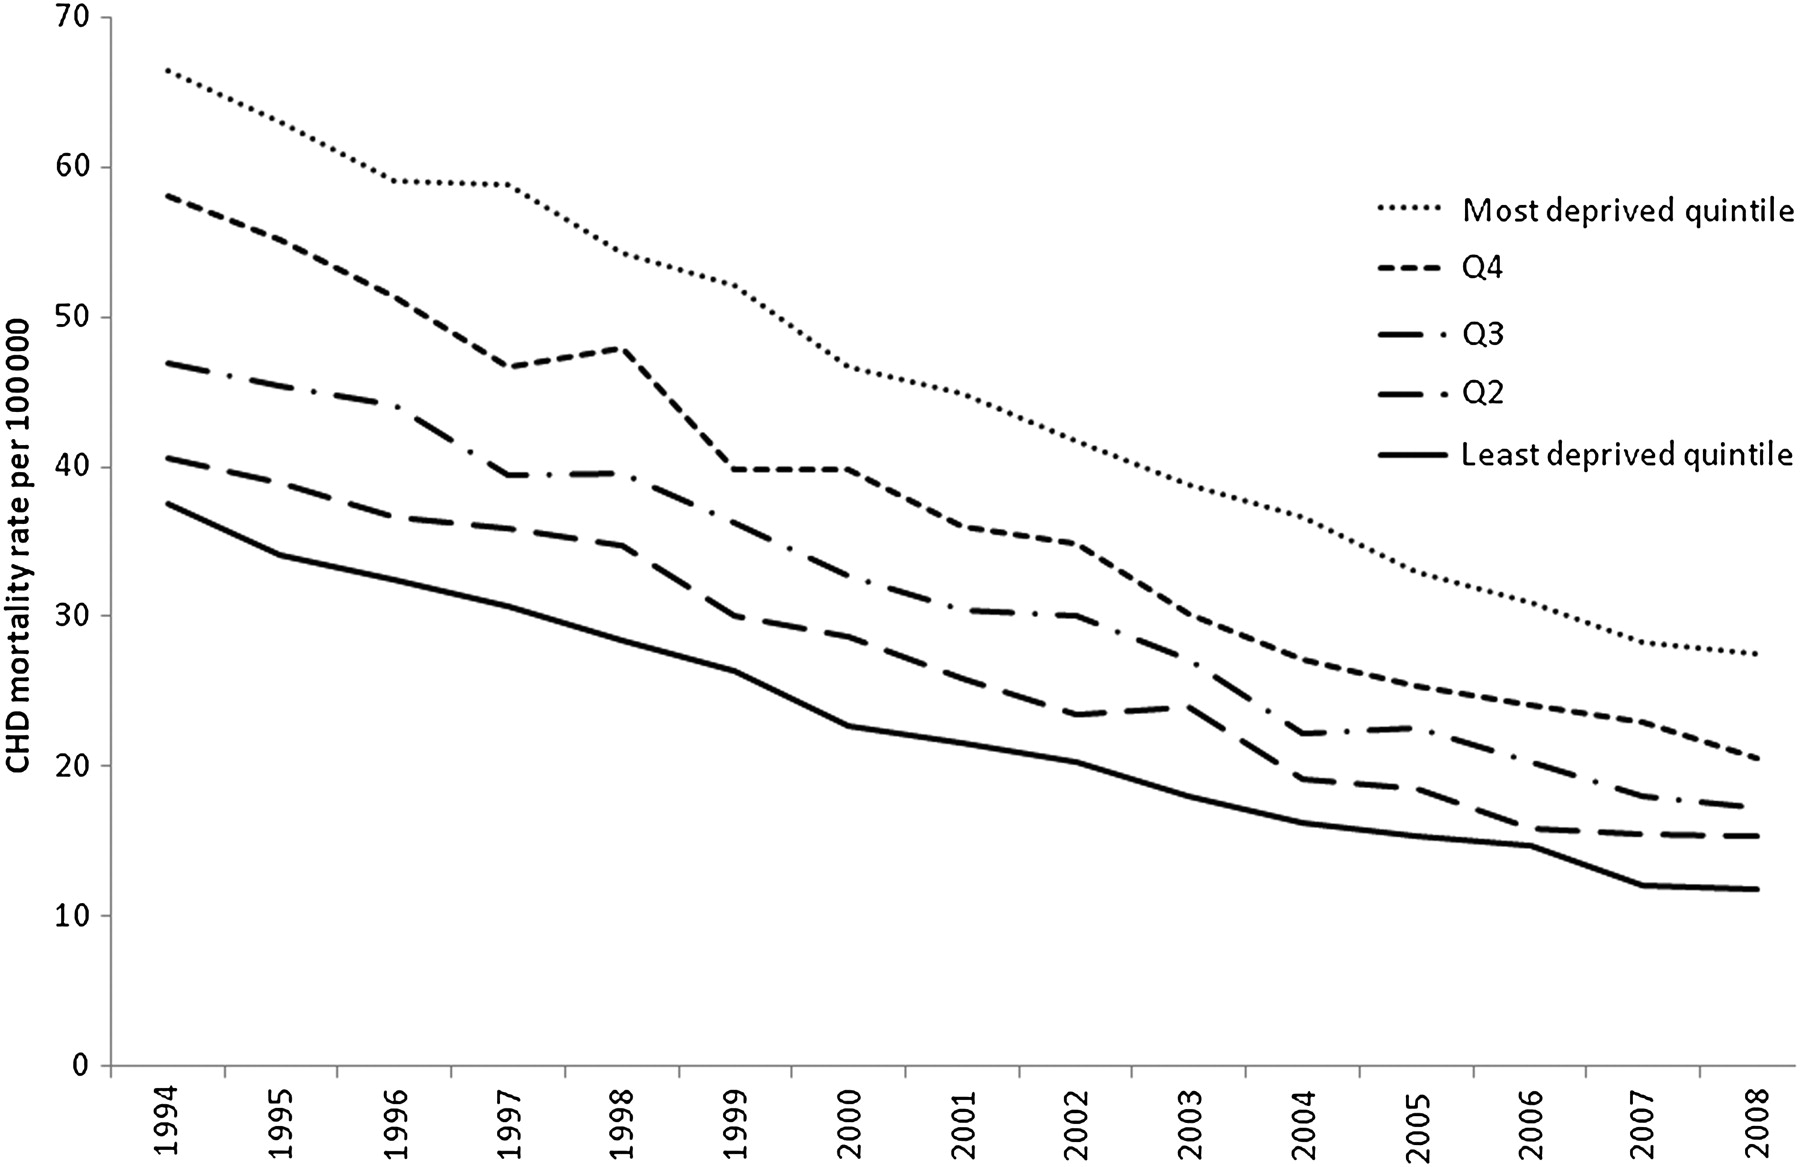
Mortality rates for CHD declined steadily between 1994 and 2008 for areas at all levels of deprivation. Figure 1 shows the decline in CHD mortality rates for women younger than 75 years since 1994, by quintile of deprivation. Mortality rates in the more deprived groups have seen a greater absolute fall than more affluent areas. This has resulted in a narrowing of inequalities in absolute mortality rates over the time period. This pattern was the same for men younger than 75 years. Table 1 shows that the most deprived quintile had a significantly greater decline in CHD mortality rates than the least deprived quintile, for both men and women. For men, mortality rates fell by 69 (95% CI 64 to 74) per 100 000 in the most affluent quintile compared with 92 (95% CI 86 to 98) per 100 000 in the least affluent quintile.

Age-standardised coronary heart disease mortality rates per 100 000 for the period 1994 to 2008, by quintile of deprivation, Great Britain—women younger than 75 years.
Comparison of deprivation quintiles of local authorities in the assessment of (a) change in absolute coronary heart disease (CHD) mortality rates, (b) change in relative CHD mortality rates, (c) change in CHD mortality rate ratio between least and most deprived quintiles and (d) association between average annual percentage decline and deprivation, 1994–2008, Great Britain, n=408
Relative decline
Figure 2 shows the relative decline in CHD mortality rates for men younger than 75 years by quintile of deprivation. The relative decline in the most deprived quintile between 1994 and 2008 was less than the relative decline in the least deprived quintile, and there was a clear gradient in decline within deprivation quintiles. At no point between 1994 and 2008 was the relative decline in the most deprived quintile greater than that in the least deprived quintile. For women, mortality rates in the most affluent quintile declined by 66% (62% to 69%) compared with 57% (95% CI 54% to 60%) for the least affluent quintile (see table 1).

Relative coronary heart disease mortality rates (1994=100%) for the period 1994 to 2008, by quintile of deprivation, Great Britain—men younger than 75 years.
Mortality rate ratios
Mortality rate ratios were calculated using the least deprived quintile as the base. The rate ratios by quintiles of deprivation are shown for women younger than 75 years in figure 3. For both men and women, the rate ratio for the most deprived quintile increased reasonably consistently between 1994 and 2008. In men younger than 75 years, the increased risk in the most deprived group changed from 52% (95% CI 47% to 57%) in 1994 to 84% (95% CI 76% to 93%) in 2008. For women younger than 75 years, the increased risk in the most deprived quintile changed from 77% (95% CI 68% to 86%) in 1994 to 132% (95% CI 114% to 152%) in 2008.

Coronary heart disease mortality rate ratios (least deprived quintile as baseline) for the period 1994 to 2008 by quintile of deprivation, Great Britain—women younger than 75 years.
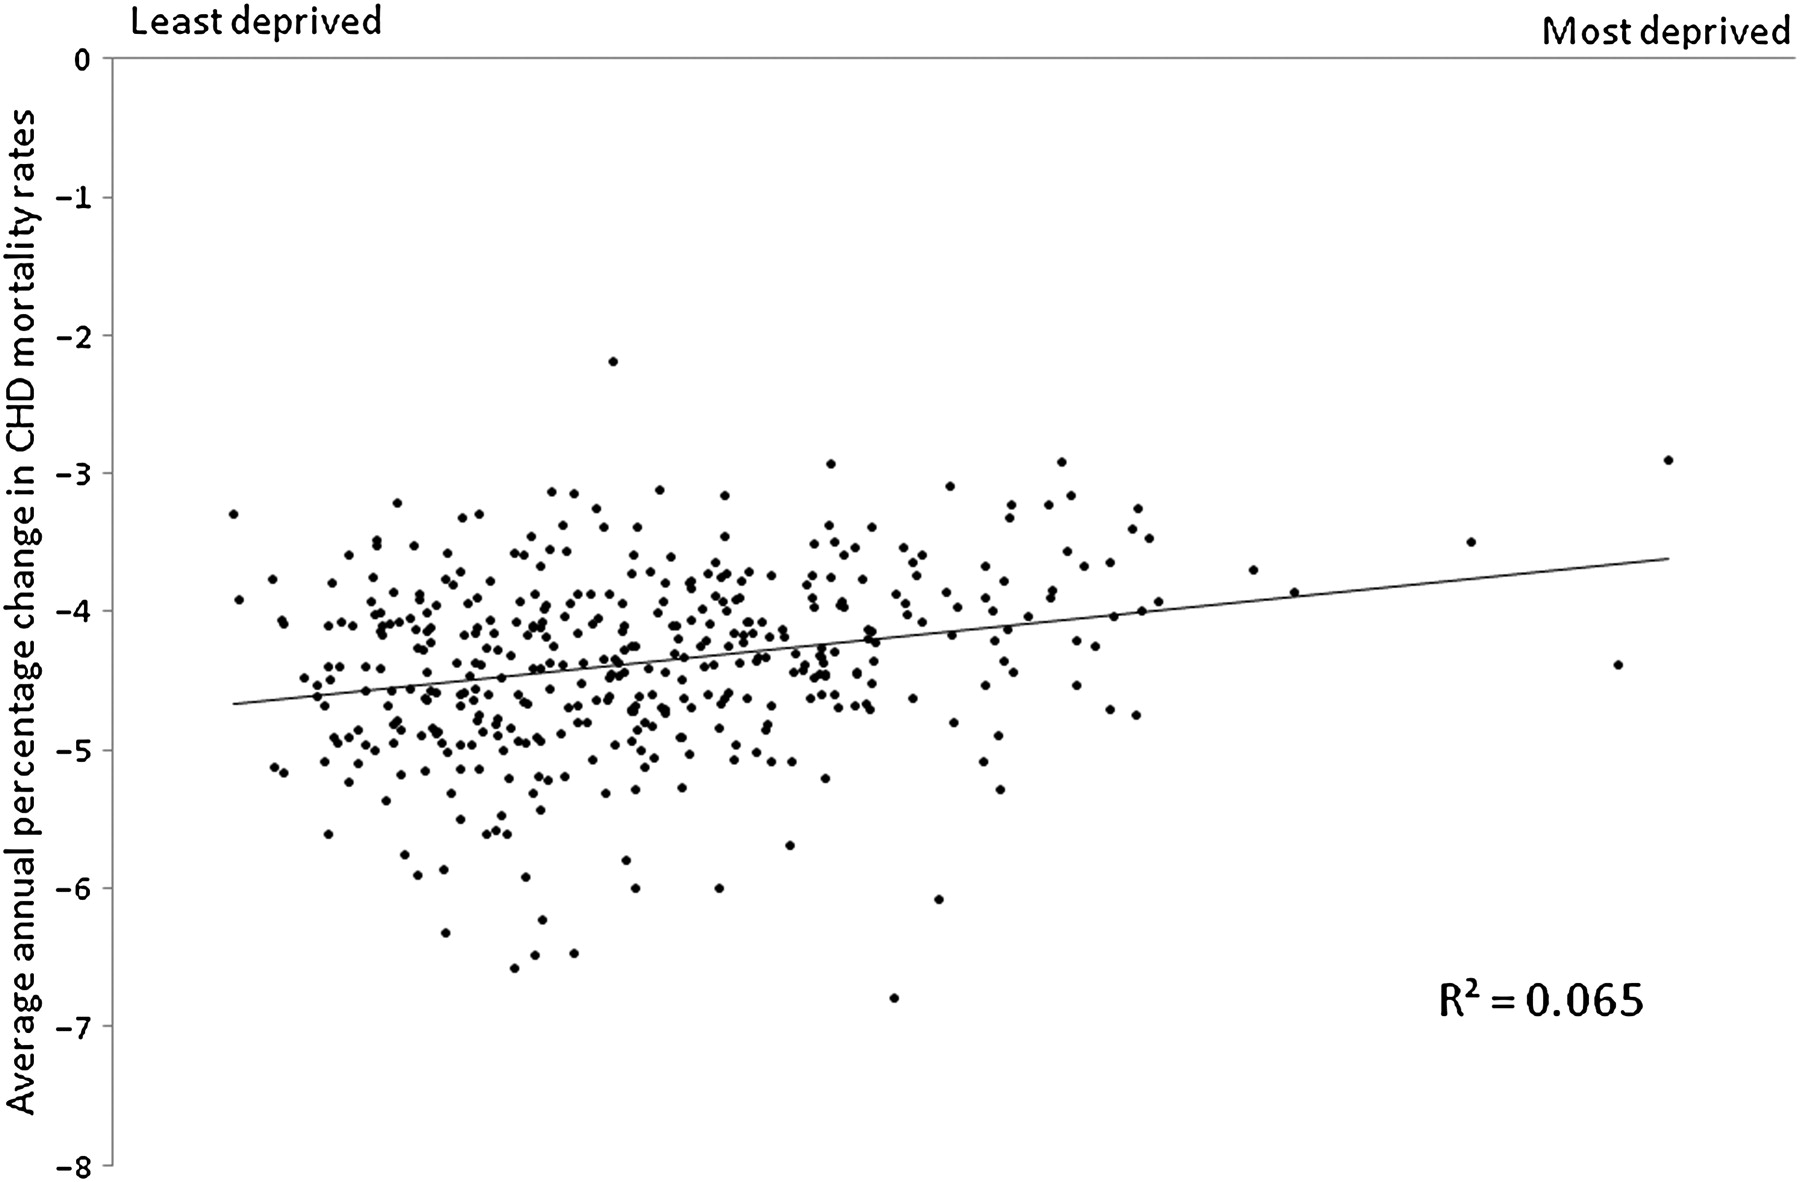
Association between average annual percentage decline and deprivation
Figure 4 shows the association between average annual decline in men younger than 75 years CHD mortality rates and deprivation for all local authorities in Great Britain. The variables demonstrate a weak association (r2=0.06, p<0.001). The association suggests that more deprived areas have a slower rate of decline in relative CHD mortality rates than more affluent areas. However, the weak association suggests that the level of deprivation of the local authority alone does little to describe the variance in decline in CHD mortality rates. This is the case for both men and women younger than 75 years CHD mortality rates and is demonstrated in table 1, where the IQR of average annual decline in CHD mortality rates for local authorities in the most and least deprived quintiles overlap considerably.
Association between average annual percentage decline in coronary heart disease (CHD) mortality rates between 1994 and 2008 and deprivation, Great Britain—men younger than 75 years.
Discussion
This study investigated the trends in premature CHD in relation to socioeconomic inequalities in Great Britain over a 15-year period. The findings show that while absolute inequalities in mortality have narrowed, there has been a clear widening of relative inequalities. A stark consequence is that female premature CHD mortality rates in the most deprived quintile are now more than double those in the least deprived quintile, and this gap is still increasing. The social patterning displayed in these trends is evident across the whole spectrum of deprivation, with the relative gap between any two quintiles of deprivation increasing over the time period 1994–2008 (see figure 3). However, when trends in the individual local authorities are assessed, it is clear that deprivation is not a great predictor of decline in CHD mortality rates: although the general trend shows that decline in CHD mortality between 1994 and 2008 was lower in more deprived areas, there are many examples of deprived local authorities with a large decline over this time period and vice versa (see figure 4).
Well-established behavioural risk factors for CHD such as smoking, poor diet and physical inactivity show an inverse social gradient, as do some medical risk factors for cardiovascular disease (obesity, diabetes and hypertension (in women only)).4 ,21 Recent work has shown persisting inequalities in risk factors for CHD22—if improvements in prevention and treatment had been experienced equally by populations at each level of deprivation (ie, by equal relative decreases in risk behaviour and increases in risk protection), then we would expect the relative trends to be equal for different deprivation quintiles and the absolute trends in mortality rates for different deprivation quintile to be converging. The implication of this is that, in a situation of falling CHD mortality rates where trends in absolute mortality rates would be expected to be converging, it is important that both absolute and relative mortality rates are presented. One way to use trends in absolute rates for conditions with falling mortality would be to assess where absolute rates for different socioeconomic groups converge—if improvements were being achieved equally across groups, then the rates should converge at the natural floor for the condition, where it is no longer possible to achieve any improvements. For premature mortality from CHD, this natural floor is likely to be very close to zero. However, our own work has shown that extrapolation of the trends in absolute CHD rates in Great Britain suggest that convergence will not be achieved until 2030 when mortality rates for men younger than 75 years will be −70 per 100 000.
The results presented here concur with the recent report on social inequalities and health ‘Fair Society, Healthy Lives’, in suggesting that more work needs to be done to reduce social inequalities in health. Suggested mechanisms for reducing inequalities include improving opportunities for active travel, strengthening ill health prevention and ensuring that everyone is able to afford a healthy lifestyle.3
The work presented here allows for observation of long-term trends using a consistent small area definition. Often analyses of social inequalities in health are restricted to single countries within the UK, usually because the measure of deprivation that is used is country specific (eg, the Indices of Multiple Deprivation are calculated separately for England,23 Scotland24 and Wales25), but this analysis incorporates all local authorities from England, Scotland and Wales. However, a limitation of this study is that deprivation was only measured at a single point in time. The score assigned to each area for 2001, the midpoint of the analysis period, has been assumed to represent the level of deprivation of the area for the entire duration of the study and does not take account for any change in deprivation. This was because the Carstairs index relies on variables that are only available from the national census and are not estimated at intermediary years. It was not possible to calculate equivalent scores using the 1991 census as the units of analysis used for this study (local authorities) did not exist at the time of the 1991 census. Individual local authorities that have seen large changes in social, demographic or economic factors between 1994 and 2008 may have been misclassified by the analyses in this paper. However, the evidence suggests that there have not been substantial misclassification: this was assessed in a separate analysis that used a linear regression analysis of deprivation (assessed using the 2001 Carstairs index) against standardised CHD male and female premature mortality rates for each individual local authority. This analysis was conduced for each year from 1994 to 2008. If there had been substantial misclassification of deprivation by the 2001 Carstairs index, this would result in increasing misclassification bias in years further from 2001 and hence a trend towards larger SEs around the deprivation regression parameter and towards a less well-fitted model. However, this was not observed for either male or female rates (results not shown).
Future work
This study has only highlighted trends in inequalities over time and has not established the reasons for this trend. Further work is needed to determine socioeconomic trends in risk factors, particularly those that have been worsening over time such as obesity and diabetes.26 Trend analysis of changing cardiovascular treatments, particular access to surgery, and interventional treatments is worthy of further study. It is also necessary to establish trends in incidence and prevalence of CHD to assess if the gradient mirrors that observed in mortality. Local authority areas that have demonstrated unexpectedly high or low decreases in CHD mortality rates in comparison to other areas of a similar level of deprivation should be examined for potential causal factors.
References
Footnotes
To cite: McCartney D, Scarborough P, Webster P, et al. Trends in social inequalities for premature coronary heart disease mortality in Great Britain, 1994–2008: a time trend ecological study. BMJ Open 2012;2:e000737. doi:10.1136/bmjopen-2011-000737
Contributors DM, PS, MR and PW conceived the study. DM and PS designed the analysis. DM analysed the data and produced the first draft of the manuscript. DM, PS, MR and PW commented on and approved the final manuscript.
Funding MR and PS are supported the by the British Heart Foundation programme grants (PPC/Jul05/5b and PPC/JAN05/6biii).
Competing interests None.
Provenance and peer review Not commissioned; externally peer reviewed.
Data sharing statement There are no additional data available.