Article Text

Abstract
Objective To evaluate the effects of introducing the Chronic Kidney Disease-Epidemiology Collaboration (CKD-EPI) formula for estimated glomerular filtration rate (eGFR) reporting in the adult population in routine clinical practice with clinician-directed testing.
Design Retrospective study of all creatinine measurements and calculation of eGFRs using Modification of Diet in Renal Disease (MDRD) and CKD-EPI formulae.
Setting General population, Oxfordshire, UK.
Participants An unselected population of around 660 000.
Interventions Reporting of eGFRs using MDRD or CKD-EPI formulae.
Primary and secondary outcome measures Evaluation of the effects of the CKD-EPI formula on the prevalence of different stages of chronic kidney disease (CKD).
Results The CKD-EPI formula reduced the prevalence of CKD (stages 2–5) by 16.4% in patients tested in primary care. At the important stage 2–stage 3 cut-off, there was a relative reduction of 7.5% in the prevalence of CKD stages 3–5 from 15.7% to 14.5%. The CKD-EPI formula reduced the prevalence of CKD stages 3–5 in those aged <70 but increased it at ages >70. Above 70 years, the prevalence of stages 3–5 was similar with both equations for women (around 41.2%) but rose in men from 33.3% to 35.5%. CKD stages 4–5 rose by 15% due exclusively to increases in the over 70s, which could increase specialist referral rates. The CKD classification of 18.3% of all individuals who had a creatinine measurement was altered by a change from the MDRD to the CKD-EPI formula. In the UK population, the classification of up to 3 million patients could be altered, the prevalence of CKD could be reduced by up to 1.9 million and the prevalence of CKD stages 3–5 could fall by around 200 000.
Conclusions Introduction of the CKD-EPI formula for eGFR reporting will reduce the prevalence of CKD in a primary care setting with current testing practice but will raise the prevalence in the over 70s age group. This has implications for clinical practice, healthcare policy and current prevalence-based funding arrangements.
This is an open-access article distributed under the terms of the Creative Commons Attribution Non-commercial License, which permits use, distribution, and reproduction in any medium, provided the original work is properly cited, the use is non commercial and is otherwise in compliance with the license. See: http://creativecommons.org/licenses/by-nc/2.0/ and http://creativecommons.org/licenses/by-nc/2.0/legalcode.
Statistics from Altmetric.com
Article summary
Article focus
Estimated glomerular filtration rates form the basis for clinical and health policy decisions in chronic kidney disease.
The new CKD-EPI formula for estimated glomerular filtration rates estimates renal function better than the Modification of Diet in Renal Disease formula in current use.
We have studied the effects of using the CKD-EPI formula in a UK population of over half a million.
Key messages
Overall, the CKD-EPI formula produces higher better estimated glomerular filtration rates, which reduces the diagnosis of chronic kidney disease. However, in men older than 70 years, it produces lower worse estimated glomerular filtration rates and increases the number with chronic kidney disease stages 3–5.
Our results predict a net reduction of around 200 000 in the numbers with chronic kidney disease stages 3–5 in the UK. This would reduce the primary care chronic kidney disease registers, inappropriate disease labelling and patient monitoring.
The chronic kidney disease classification of up to 3 million patients could be altered by the use of the CKD-EPI formula in the UK.
Strengths and limitations of this study
The study is large and unbiased. All primary care samples taken during the study period were analysed, so the results represent current clinical testing practice.
Estimated glomerular filtration rates are sufficient to diagnose chronic kidney disease stages 3–5, but stages 1–2 also require proteinuria or a structural abnormality, which cannot be assessed in this study. However, a change in estimated glomerular filtration rate can still alter the classification of stage 1 or 2.
Introduction
Chronic kidney disease (CKD) is common and important.1 People with CKD have an increased overall mortality and an increased risk of cardiovascular events, even after known risk factors are controlled for.2 Renal impairment also affects the safe prescribing of many common drugs. Some patients will progress to end-stage renal disease with its substantial associated morbidity, mortality and cost. Milder degrees of renal impairment are more common but can also cause morbidity, especially from fluid retention, hypertension and a range of metabolic disturbances such as hyperuricaemia.3 It is unfortunate that there is no routinely available method for the reliable measurement of glomerular filtration rate (GFR), which is the key index of renal function. Serum creatinine is easy to quantify but only rises substantially when there is a major reduction in GFR. Furthermore, creatinine production is influenced by age, sex, muscle mass and ethnicity. For these reasons, formulae have been developed that attempt to incorporate these factors and produce an estimated glomerular filtration rate (eGFR). In the UK and many other countries, versions of the Modification of Diet in Renal Disease (MDRD) formula have been adopted for routine reporting of eGFRs.4 While there is a consensus that eGFR reporting has been clinically helpful, there are problems associated with these eGFRs.5 In particular, they are inaccurate in early CKD such that the true GFR can vary substantially from the eGFR.6
CKD has been classified into stages based principally upon eGFR and the assessment of proteinuria.7 Estimates of the prevalence of CKD in different populations vary from around 5% to 10% of the total population.8 In many countries, guidelines have been developed, such as the guidance from NICE in the UK or the National Kidney Foundation K/DOQI guidelines in the USA, for the management of patients with CKD.5 7 Such guidelines emphasise the value of regular monitoring of patients with estimations of renal function, typically annually for CKD stage 2 and 6 monthly for CKD stage 3.5 However, there are problems associated with this, including labelling millions of asymptomatic people with the term ‘disease’, the cost of repeated monitoring and the inconvenience to the affected individual. In the UK, primary care physicians have a financial incentive to diagnose and follow-up patients with CKD under the Quality and Outcomes Framework scheme (QOF), whereby funding allocations reflect the practice's prevalence of chronic conditions including CKD.9
Given the recognised inadequacies of the MDRD equation, it is important to use the most accurate possible estimates of GFR to avoid potential misclassification of patients, with the concomitant costs to the healthcare system and the individuals concerned. Recently, a new formula, the Chronic Kidney Disease-Epidemiology Collaboration (CKD-EPI), has been developed that shows a much improved concordance between eGFR and true measured GFR, especially in the earlier stages of CKD.10 The US National Kidney Foundation has recently recommended the adoption of the CKD-EPI formula for routine eGFR reporting by laboratories in the USA.11 We have tested whether the use of the new CKD-EPI equation would have a significant effect on the CKD stage classification in a large representative population of patients tested in primary care. Such an effect could have major implications for patients and for the healthcare system.
Methods
We analysed all requests for creatinine measurement in the Oxford University Hospitals Trust Clinical Biochemistry laboratories from the Oxfordshire region during the period October 2009 to January 2011 and identified all requests from primary care on patients aged ≥18 years. Assays were conducted using a kinetic Jaffe method (Siemens, Camberley, UK) calibrated to give isotope dilution–mass spectrometry (IDMS)-compatible results. We recorded the gender, date of birth and the National Health Service (NHS) number of the patient and the date of the specimen. For each patient, we identified the first specimen and calculated the eGFRs using the MDRD and the CKD-EPI equations and compared the CKD stage classifications based on these. We excluded creatinine measurements of <10 μmol/l. The formulae are provided as online supplementary information (http://bmjopen.bmj.com). Estimates for the UK population were scaled on the size of the catchment area we studied and the most recently available UK population census information.12 The similarity of the Oxfordshire population to that of the UK is shown as online supplementary information (http://bmjopen.bmj.com).
The calculation of eGFR is affected by ethnicity, but given the imperfect recording of ethnicity in primary care and that a small percentage of Oxfordshire renal function requests require adjustment for ethnicity, bootstrapping methods were used to test the effects of ethnicity.13 To do this, we first needed to establish the variability in creatinine measures by analysing the results from patients who had more than one specimen collected within 3 months of each other. The distribution of test frequency is shown in online supplementary figure 1 (http://bmjopen.bmj.com). The mean and SD were calculated for each patient, and from this, we calculated the median SD within increasing 10 μmol/l bins from 10 to 200 μmol/l and pooled measurements of >200 μmol. The relevant median SD was used to add a random normal deviate to each creatinine value in Monte Carlo simulations designed to investigate the effects of ethnicity.
The Monte Carlo bootstrap simulations were performed by random selection of samples of 100 000 patients with replacement from the pool of first or only specimens of 175 671 individual patients. All simulations were based on the first creatinine value in this study period for those with >1 measure of creatinine or on the only measure for those with just one. For each patient sampled, we added a random normal deviate using the relevant median SD. We randomly allocated black African ethnicity to 2.8% (on the basis of the ethnic distribution in Oxfordshire as shown in table 2) of the patients in each sample of the total data set that was used in each bootstrap simulation and used these data to generate MDRD and CKD-EPI eGFR values. We performed 10 000 simulations to derive approximate 95% confidence limits for the proportion of patients who would be allocated to each CKD group. We used this method to generate pairs of data for each patient to define the mean proportion of patients who would be allocated to different CKD classes by successive measurements using each method.
Results
Overview
We analysed all creatinine results arising from requests in our Oxfordshire catchment area during the time period from 1 October 2009 to 4 February 2011. This area covers a population of around 660 000, and 738 348 requests were received during this time period. Of these requests, 321 964 requests on 175 671 patients aged at least 18 years were from primary care. The median SD of creatinine measurements in repeat requests is shown in online supplementary table 1 (http://bmjopen.bmj.com). As our laboratory uses an isotope dilution–mass spectrometry-standardised serum creatinine assay, we calculated the eGFR for each result using the revised four-variable MDRD formula and the new CKD-EPI formula.6 10
As figure 1 illustrates, the use of the CKD-EPI formula compared with the MDRD formula results in a general shift to the right, corresponding to higher, and so better, eGFR values. The eGFR values derived from the MDRD and CKD-EPI formulae were highly correlated, the MDRD values being more skewed. Figure 2 shows a Bland–Altman plot of this relationship. This demonstrates that use of the CKD-EPI formula generally results in a higher eGFR than that obtained with the MDRD formula. The discrepancy increases as the eGFR rises but even within the range where CKD classification depends on eGFR, the disparity between the two formulae can be large. Overall, 27.3% (47 882) of all patients had a higher and better eGFR using the CKD-EPI formula compared with the MDRD formula. On the basis of these eGFR results, we stratified the patients by the CKD stage that their eGFR corresponds to in the conventional K/DOQI classification system.7 Overall, 18.3% (32 167of 175 671) of all individuals tested were reclassified on the basis of eGFR by a change from the use of the MDRD to the CKD-EPI formula. Eight-four per cent of reclassifications were to a milder CKD stage with a higher eGFR and only 16% to a more severe CKD stage with a lower eGFR.

Prevalence of different estimated glomerular filtration rates (eGFRs) with the Modification of Diet in Renal Disease (MDRD) and Chronic Kidney Disease-Epidemiology Collaboration (CKD-EPI) formulae. The prevalence within the samples studied is indicated on the y-axis with eGFR on the x-axis. eGFRs were calculated using the MDRD formula (dashed line) or the CKD-EPI formula (continuous line). Overall, eGFRs calculated using the CKD-EPI formula are higher and better than those calculated using the MDRD formula.

Bland–Altman plot of the relationship between the Modification of Diet in Renal Disease (MDRD) and Chronic Kidney Disease-Epidemiology Collaboration (CKD-EPI) estimates of glomerular filtration rate The x-axis indicates the average of the estimated glomerular filtration rates calculated using the MDRD and CKD-EPI formulae and the y-axis indicates the difference between these two estimates.
Effect on overall prevalence of CKD in primary care using eGFR criteria
When the MDRD formula was used, 70.6% (124 187) of all patients tested were shown to have eGFRs that correspond to CKD stage 2 or worse (table 1). However, this number fell to only 59.1% (103 738) of patients when the CKD-EPI formula was used. This reduction resulted in 16.4% of patients who would be labelled as having CKD stage 2 or worse on the basis of eGFR criteria having that stage altered to stage 1 (‘normal’ renal function, eGFR>90 ml/min/1.73m2) or having the disease label removed completely when the CKD-EPI formula was used.
CKD classification by MDRD and CKD-EPI
Ethnic distribution in Oxfordshire and the UK
The boundary between CKD stages 2 and 3 at the eGFR cut-off of 60 ml/min/1.73m2 is important because this is the level at which current policies and guidelines recommend that patients are logged on a CKD register in primary care and monitored more frequently.5 Patients with an eGFR of <60 ml/min/1.73m2 will currently be listed on the primary care kidney disease registers which form part of the QOF funding arrangement in the UK.9 Overall, 15.7% (27 579) of all patients tested were classified as CKD stage 3 or worse on eGFR criteria using the MDRD formula, but this number fell to 14.5% (25 504), a relative fall of 7.5%, when the CKD-EPI formula was used.
Three thousand and forty-eight patients (1.7% of all patients, 11.1% of those classified as CKD stage 3 or worse) were reclassified as CKD stage 2 using the CKD-EPI formula, while 973 patients (0.6% of all patients and 1.9% of patients classified as CKD stage 2) would have been classified as CKD stage 3 rather than stage 2. The use of the CKD-EPI formula resulted in the removal of 1.2% of the entire population tested in primary care from eligibility for CKD registers. This would equate to a fall in the size of CKD registries in primary care by 7.5%, a reduction in the associated monitoring requirements and the proportionate loss of the associated QOF income to general practices. Recent guidance has emphasised the prognostic value of dividing CKD stage 3 into 3A (45–59 ml/min/1.73m2) and 3B (30–44 ml/min/1.73m2).5 Larger numbers of reclassifications are seen in stage 3A than 3B with the use of the CKD-EPI formula, and this mainly reflects reclassification to a lower better CKD stage (online supplementary table 2, http://bmjopen.bmj.com). Current guidance also emphasises that patients with CKD stages 4 and 5 should generally be referred to a nephrologist for a specialist opinion. As table 1 shows, the number of patients with these stages of CKD rose by 338 (15%).
Influence of age and gender on CKD classification using MDRD or CKD-EPI
Differences in the results obtained for eGFR with the two formulae were explored further by analysing specific age groups for both men and women. Figure 3 shows the prevalence of CKD stages 2–5 classified by gender and age group, and the underlying data are provided in online supplementary table 3 (http://bmjopen.bmj.com). For every group except those over 70 years of age, the prevalence of each stage of CKD is lower with the CKD-EPI formula. This shift arises predominantly from a reduction in the numbers with CKD stage 2 in all groups except the over 70s where there is a slight increase. Similarly, there is a smaller reduction in the numbers with stage 3 in all groups except the over 70s men where there is a slight increase. At all ages <70, use of the CKD-EPI formula reduced the number of people with CKD stages 3–5 (figure 3, online supplementary figure 2 and supplementary tables 3 and 4, http://bmjopen.bmj.com). In contrast, in men over 70, there were increases in the percentage of patients with each stage of CKD from stages 2 to 5 with the CKD-EPI formula and the number with CKD stages 3–5 rose from 33.3% to 35.5%. In women over 70, the percentage of patients with stages 3–5 CKD was similar with both equations (around 41.2%), although percentages of patients with stages 2, 4 and 5 were increased in women with the CKD-EPI equation. Apart from this, the results for men and women are essentially analogous for each age group. However, although eGFRs are generally lower in both men and women aged over 70 with the CKD-EPI formula, the increase in CKD stages 3–5 in this age group is due to an increase in the number of men rather than women.

Graph of the prevalence of each stage of chronic kidney disease (CKD) within the samples tested grouped by age and gender. The y-axis indicates the percentage of the patients tested in each age group with estimated glomerular filtration rates in the ranges corresponding to the indicated CKD stages with each formula (M indicates MDRD, Modification of Diet in Renal Disease formula and C indicates CKD-EPI, Chronic Kidney Disease-Epidemiology Collaboration formula). Numbers on the x-axis indicate ages in years.
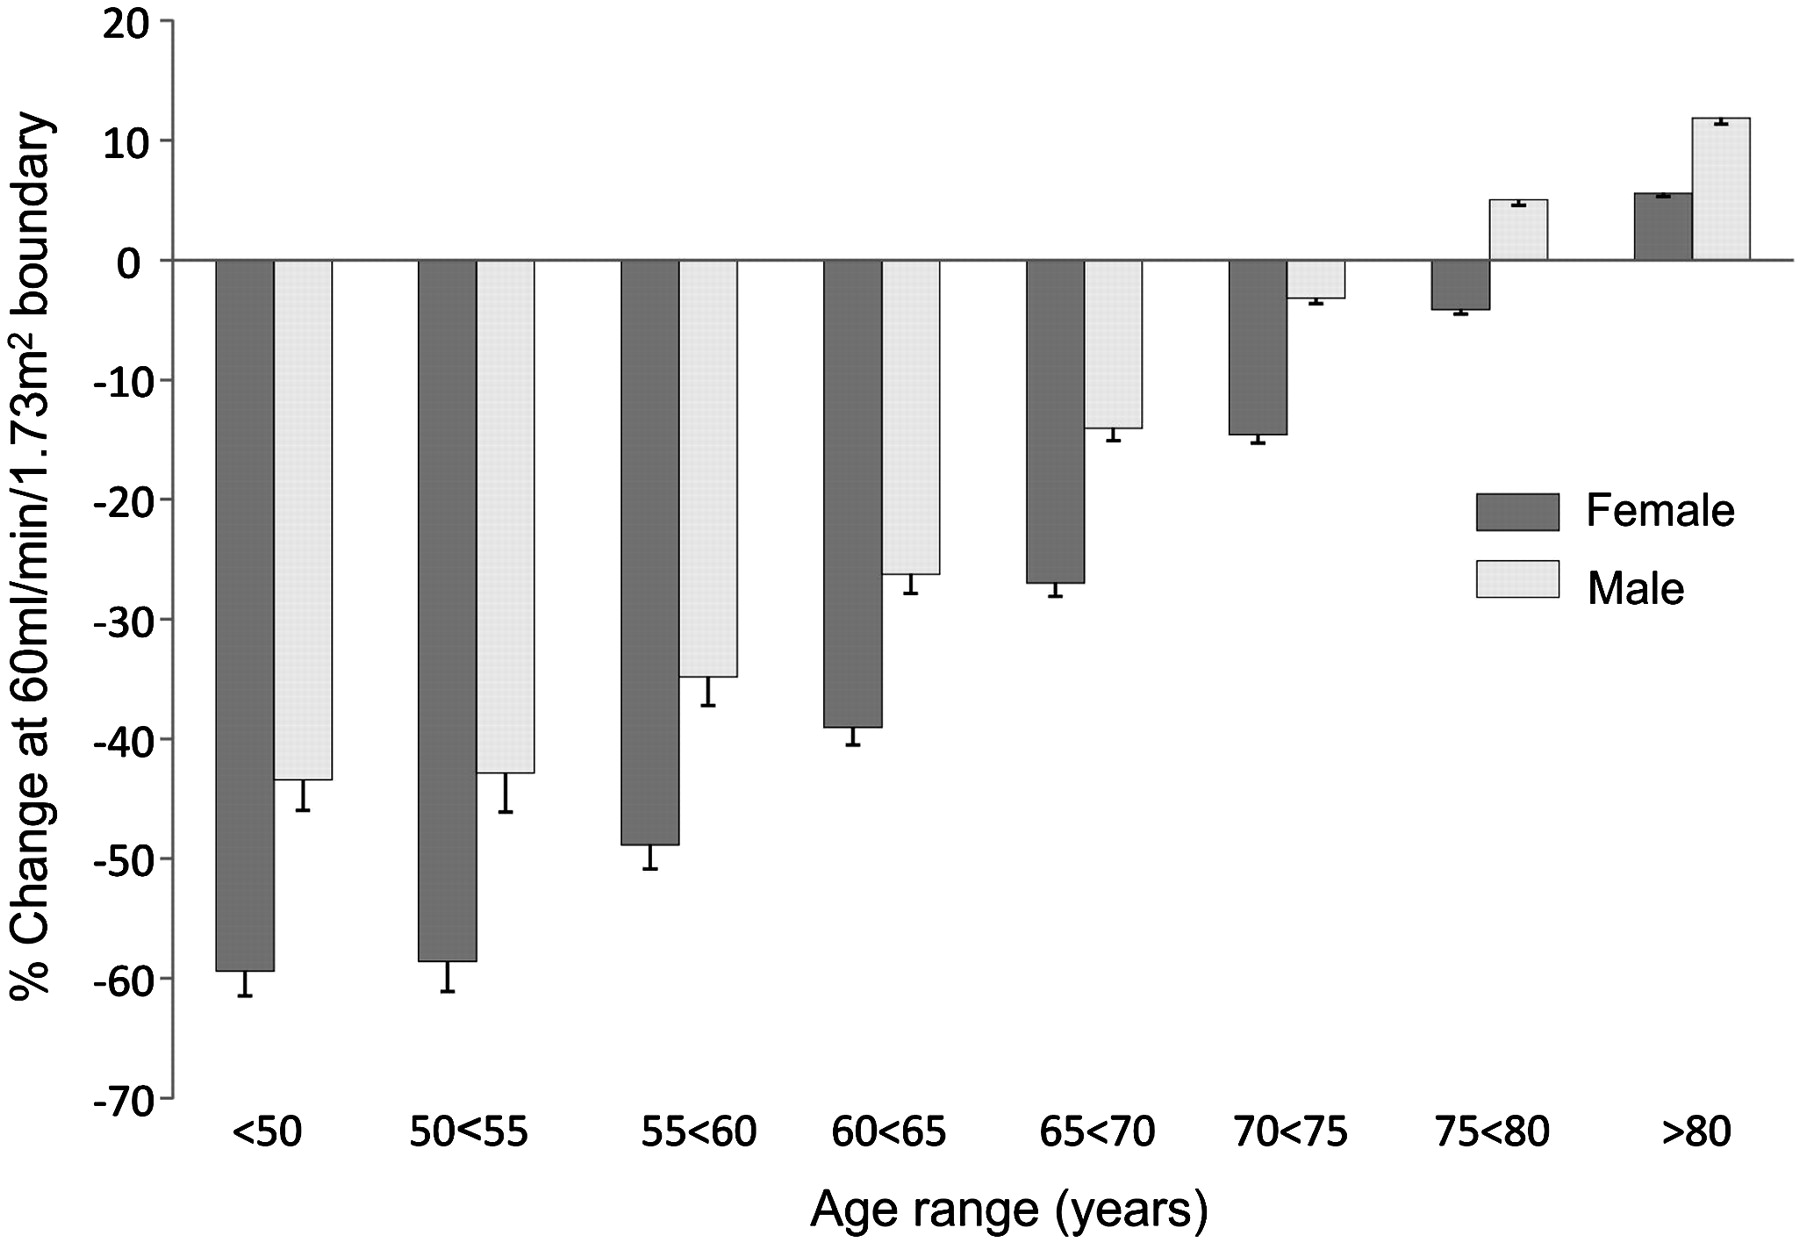
At the important eGFR cut-off of 60 ml/min/1.73m2, the percentage of reclassifications is greatest in the younger age group and greater in women than in men (figure 4). For men and women of all ages <75, there is a net shift to a better higher eGFR and so to the better lower CKD stage 2. However, it is important to note that in older patients (>80 years of age), the opposite is true as there is a net shift to a worse lower eGFR and so to a worse higher CKD stage. In older patients, there is greater reclassification of men than of women into the CKD 3 or higher stages. Use of the CKD-EPI formula rather than the MDRD formula reduced the proportion of younger patients with CKD stage 3 or worse but increased the proportion of older patients with CKD stage 3 or worse. In younger patients, the reduction in the severity of CKD will be greatest in women; in older patients, the increase in the severity of CKD will be greatest in men.

Changes at the estimated glomerular filtration rates (eGFR) cut-off boundary of 60 ml/min/1.73m2 The x-axis represents patient groups divided according to age in 5-year groupings. The y-axis represents the percentage change in the number of people with an eGFR of <60 ml/min/1.73m2 occurring with a change from the use of the MDRD (Modification of Diet in Renal Disease) formula to the CKD-EPI (Chronic Kidney Disease-Epidemiology Collaboration formula. The percentage change is negative if there is a reduction in the number of people with an eGFR <60 ml/min/1.73m2.
Effects of ethnicity on eGFR prediction and CKD classification
An issue of relevance is the ethnic distribution of the population we studied. From the perspective of eGFR estimation, the key ethnicity of importance is that of black African ethnicity where adjustments to the eGFR calculations are made to correct for recognised ethnic differences in the relationship between serum creatinine levels and true measured GFR.14 15 Omitting ethnicity from the calculation of eGFR in an ethnically mixed population would lead to a net underestimation of eGFR and overestimation of CKD. Table 2 demonstrates that the ethnic structure of the Oxfordshire population studied is similar to that of the UK and likely to be representative of the overall UK population. To include the effect of ethnic distribution, we undertook a bootstrap analysis by performing a set of 10 000 Monte Carlo simulations to estimate the 95% confidence limits for the proportion of people with each stage of CKD with each formula and the proportion of people who would be classified differently with each formula on two occasions within 3 months. Table 3 confirms that when ethnicity is included, using the CKD-EPI formula would still result in a lower proportion of people being classified as having CKD overall, with a substantial reduction in the proportion being classified as having CKD stage 2 (43.8% vs 53.3%) and stage 3 (13.1% vs 14.5%) but increases in both stages 4 and 5. The number of patients with CKD stages 4–5 rose by 16.1% in relative terms from 1.25% to 1.46% of those tested. When considered as a percentage of the total population of 660 000 in the geographical region studied, these figures equate to a fall in the overall prevalence of CKD stages 3–5 detected using current testing policies from 4.2% with the MDRD formula to 3.9% with the CKD-EPI formula.
Confidence limits for CKD stage distribution when ethnicity is taken into account
Reclassification on repeat testing
Analysis of repeated measurements shows that using either formula, there would, as expected, be some reclassification of CKD stages on repeat testing (table 4). For instance, with the MDRD formula, 12.1% of patients would be classified as having CKD stage 3 on their first and second tests but 2.2% would be reclassified as CKD stage 2 on retesting and 0.22% as CKD stage 4. Overall, there is more consistency with the CKD-EPI formula such that the classification would be unchanged for about 82% of patients using MDRD and about 85% of patients using CKD-EPI.
Reclassification on repeat testing
Predictions for the UK
Based on the latest UK census information indicating a UK population of 61 792 000 in mid-2009,12 our results indicate that a change to the use of the CKD-EPI formula would alter the classification of over 3 million (3 011 611) individuals (table 5). Specifically, our modelling of the UK population indicates that on the basis of eGFR criteria, a change in formula would result in a net reduction of 1.9 million (1 914 522) in the number of people identified as having reduced renal function and so potentially classified as having CKD stage 2 or worse. At the important eGFR cut-off of 60 ml/min/1.73m2 which separates CKD stages 2 and 3, we predict that there will be a net reduction in the number of people with CKD stage 3 or worse of around 200 000 (194 270) individuals. This is the number of people in the UK who are predicted to be removed from the current CKD registers that form part of the UK QOF funding structure. Our results also indicate that the number of people with CKD stages 4–5 will rise by around 32 000, which could result in an increase in referrals to specialists. The number of people with CKD stage 2 is predicted to fall by up to 1.7 million (1 720 252) and the number with CKD stage 3 by 225 915. These estimates are based on eGFR, and the distinction between the different CKD stages is based on eGFR, but clearly a diagnosis of CKD stage 1 or 2 also requires the presence of proteinuria or a structural abnormality.
CKD classification estimates for the UK population by MDRD and CKD-EPI
Discussion
Our study demonstrates that introduction of the CKD-EPI formula would reduce the number of patients in the UK who are classified as having CKD on the basis of a reduced eGFR. Importantly, it would reduce the number of people with an eGFR of <60 ml/min/1.73m2 and so reduce the numbers who are classified as having CKD stage 3 or worse.
A key strength of our study is that it is based on a complete, unbiased and very large data set of patients seen in primary care who have creatinine requests. The population from which the studies were drawn is relatively typical of the total UK population. Blood samples were taken for a wide range of clinical reasons and were not performed as a population screen for the purposes of establishing the population prevalence of CKD. Therefore, this is not a population prevalence analysis. As no CKD screening policy is in place, the strength of our results is that they are the product of current clinical practice and are a complete picture of primary care testing in the population served by our laboratory. It remains the case that CKD will only be detected if a clinician decides to test an individual, so studies based on current practice for renal function testing could underestimate the true prevalence. There may well be unidentified people with CKD who are not coming to medical attention; this would also apply in other geographical areas. We did not have estimates of albuminuria, but this was not necessary for our aim, which was to explicitly test the consequences for CKD classification based on eGFR of a change from the MDRD to the CKD-EPI formula. All other considerations in CKD classification are unchanged by the choice of formula.
Our study is the largest study of the effect of changing to the use of the CKD-EPI formula in the UK population and is the only such study to factor in the effects of ethnicity. Furthermore, it is based on a well-defined population in a single region and on accurate measurements from a single laboratory service. The Oxfordshire population has a relatively typical ethnic age–gender distribution compared with the rest of the UK (table 2, online supplementary figure 4, http://bmjopen.bmj.com) and only a slightly lower level of estimated deprivation (online supplementary information, http://bmjopen.bmj.com). We have not attempted to assess the accuracy of the estimation of true GFR by the different equations as this has been extensively studied already.4 10 Rather, our aim has been to take a large representative sample of the UK population being tested in the primary care setting and study the practical effects for clinical practice and for patients of a change from the use of the MDRD formula to the CKD-EPI formula.
A smaller study from Kent did not take into account the effect of ethnicity in the analysis of the laboratory results.16 This may have led to an overestimate of the numbers with CKD as 19.1% of patients tested had CKD stages 3–5 with the MDRD formula and 17.2% with the CKD-EPI formula on the basis of eGFR. This equated to a prevalence of CKD stages 3–5 in the population studied of 4.9% with the MDRD formula and 4.4% with the CKD-EPI formula, which are higher than our estimates of 4.2% and 3.9%, respectively, when ethnicity is included. When scaled up, these differences would amount to substantial increases in the estimates of the UK prevalence of around 430 000 for the MDRD formula and 310 000 for the CKD-EPI formula compared with the prevalence predicted from our study after factoring in ethnicity. A smaller study from Scotland examined changes in the numbers of patients with CKD detected by the MDRD and CKD-EPI formulae in 2004 and 2009.17 Ethnicity was not included in this study, although the population is relatively homogeneous and as such is not typical of that of the rest of the UK. In both years, the numbers of patients with CKD stages 3–5 were less with the use of the CKD-EPI equation. Between the 2 years studied, the population from which the samples were taken increased by 0.5%, but the number of creatinine measurements increased by 20%. Despite this increased sampling, the prevalence of CKD stages 3–5 in the population from which samples were taken rose by only 0.19% with the MDRD formula and was static with the CKD-EPI formula.
In participants in the Kidney Early Evaluation Program (KEEP) study in the USA, a change from the MDRD to CKD-EPI formula was associated with generally higher eGFRs.18 This study was not based on routine clinical practice but on a screening programme targeting people at high risk of kidney disease, who were identified as those with hypertension, diabetes or a first-order relative with hypertension, diabetes or kidney disease. In this selected population, CKD staging based on the CKD-EPI formula provided better prediction of mortality than staging based on the MDRD formula. Compared with patients whose CKD stage was not altered, reclassification to a better lower CKD stage with the CKD-EPI formula was associated with reduced mortality and reclassification to a worse higher CKD stage was associated with increased mortality. Similar correlations of improved outcome for people who were reclassified to a better CKD stage using the CKD-EPI formula were also seen for mortality, renal progression and cardiovascular disease in the Atherosclerosis Risk in Communities (ARIC) study and for mortality in the Australian Diabetes, Obesity and Lifestyle study.19 20 These studies suggest that the more accurate estimation of eGFR allows more accurate prediction of prognosis.
A number of other small studies have examined the use of CKD-EPI in different contexts. The CKD-EPI formula certainly reduces bias between measured GFR and eGFR especially in those with an eGFR of <60 ml/min/1.73m2.10 A further study by the same group examined the relative performance of the MDRD and CKD-EPI using a validation data set of 3896 patients and found that in the eGFR range 30–59 ml/min/1.73m2, the bias was decreased from 4.9 to 2.1 ml/min/1.73m2.21 In a study of 1992 individuals recruited for a population screening exercise, a Bland–Altman analysis indicated a mean difference between the MDRD and CKD-EPI formulae of −2.6±7 ml/min/1.73m2.22 Consistent with our data, there was a reduction in the number of patients with CKD stage 3 or worse from 11.04% to 7.98%. As these results are based on small numbers of individuals recruited to a screening study, they do not allow clear estimates of the effects of a change in formula on clinical practice. Application of the CKD-EPI formula rather than the MDRD formula to data derived from the NHANES study resulted in a reduction in the percentage of study participants with CKD stage 3 or worse from 8.2% to 6.7%.10 The major change was in CKD stage 3 that fell from 7.8% to 6.3% of the population studied. However, the NHANES data are also derived from a specific study group rather than from routine clinical activity. Although the NHANES data are detailed, the sample number used was relatively small (16 032 participants) compared with the current study; serum creatinine values were re-calibrated from measurements made with a kinetic rate Jaffe method. In addition, there are well-recognised differences in a range of relevant parameters between the USA and UK populations including body mass index and ethnic distribution. An analysis of the US patients in the Kidney Early Evaluation Program study identified a reduction of 2.1% in the prevalence of CKD stage 2 or worse when the CKD-EPI formula was used.23 However, this was a targeted population screening study and 31.8% of the study group were African–Americans, which is very different to the ethnic distribution of the UK population.
Of 11 247 individuals who were recruited to the Australian Diabetes, Obesity and Lifestyle study of adults over 25 years of age, 13.4% were classified as having CKD stage 2 or worse using the MDRD formula compared with 11.5% using the CKD-EPI formula; the prevalence of CKD stage 3 or worse fell from 7.8% to 5.8%.20 The CKD-EPI formula produces a good estimate of GFR in Japanese patients, and the distribution of patients with different stages of CKD was calculated using data from a Japanese annual health check programme.24 These data are not directly comparable to our own as they are based on people who are attending regularly for routine health checks, regardless of their clinical state, rather than clinician-directed testing. Nevertheless, the number of people classed as CKD stage 3 or worse fell with the use of the CKD-EPI formula from 7.7% to 5.4%. Specifically, CKD stage 3 fell from 7.5% to 5.2%.
Our study is important because it contains an analysis of real working clinical data and thus offers a robust analysis of the impact on the UK National Health Service of a change from the MDRD to the CKD-EPI formula. Such a change would be justifiable given the superior performance of the formula in estimating GFR.10 Using the largest data set examined to date in this context, we demonstrate that the use of the CKD-EPI formula will bring about a substantial reduction in the number of people who will be classified as having CKD. Scaled up to the UK population, this represents a reduction in the number of people labelled as having CKD using eGFR criteria by 1.9 million. Of particular relevance to primary care, we observed a fall in the prevalence of CKD stage 3 or worse, which would represent a reduction by around 200 000 individuals in the UK. It is likely that major reductions in the numbers of patients with CKD will be found in other countries with the use of the CKD-EPI formula. These estimates are based on eGFR and a diagnosis of CKD stage 1 or 2 also requires the presence of proteinuria or a structural or other abnormality.
Current UK guidelines are that all patients with CKD stage 3 or above should be on a primary care CKD register and should be regularly monitored and in some cases investigated. The current QOF provides primary care physicians in the UK with a financial incentive to do this as the practice prevalence of major chronic conditions (including CKD) contributes to the funding received.9 A reduction in the incidence of CKD stage 3 and above would therefore mean that there would be a cut in funding to primary care arising from the use of the CKD-EPI formula, other things being equal, of around £400 for an average practice.25 However, in parallel with this, there may be a reduction in the work required to care for these patients who would then no longer fall within the current NICE guidance for CKD stage 3 or above, depending on co-morbid conditions and other monitoring and surveillance programmes incentivised by QOF, for example, diabetes or ischaemic heart disease. At present, NICE guidelines recommend typically monitoring people with CKD stage 2 annually, stage 3 every 6 months and stage 4 every 3 months.5 Thus, shifts in CKD classification will have significant implications for both patients and doctors, especially in primary care where the care of most patients with CKD takes place.
In principle, the CKD-EPI formula should lead to better estimates of eGFR and so greater precision in the placement of patients into the different CKD stages, which should ultimately make the classification more useful by facilitating better prediction of outcome from CKD staging. Although the use of the CKD-EPI formula will lead to a reduction in the overall numbers of patients with CKD stages 3–5, the number of elderly men in this category will rise leading to an increase in the numbers of older patients on CKD registers. Whether this generates additional work in primary care will depend on whether these patients already require monitoring and input for other co-morbidities and so the extent to which monitoring and management of their CKD increases overall workloads. Current UK guidelines emphasise that the default management of patients with CKD stages 4–5 will include specialist referral to a nephrologist. The rise in the number of patients with these stages when the CKD-EPI formula is used could clearly lead to an increase in the workload in secondary care with training and resource implications. As indicated in figure 3 and online supplementary table 3 (http://bmjopen.bmj.com), this rise is due exclusively to increases in the numbers of both men and women in the over 70s age group, who are identified as having CKD stages 4 and 5 using the CKD-EPI formula. It will be important to establish whether CKD-EPI performs better as a monitoring tool for CKD progression than MDRD, especially in the elderly population. Up to 3 million people in the UK are predicted to have their CKD classification altered by the change in formula, and the cost of altering their healthcare records or informing them about this change would be substantial. The clinical implications of reclassification will vary and caution is certainly necessary in the interpretation of eGFRs >60 where the inaccuracies of the formulae are greatest and other features such as proteinuria are required for CKD classification. In many cases, reclassification will also trigger a need for a review of medication choice and drug doses, many of which change with CKD. Overall, the introduction of the CKD-EPI formula would generate substantial relabelling of individuals but could ultimately reduce the workload attributable to CKD, principally around stage 3, and allow more effective targeting of evidence-based therapies to patients who will benefit from them.
References
Supplementary materials
Supplementary Data
This web only file has been produced by the BMJ Publishing Group from an electronic file supplied by the author(s) and has not been edited for content.
Files in this Data Supplement:
- Data Supplement - Manuscript file of format pdf
- Research Checklist - Manuscript file of format pdf
Footnotes
To cite: O'Callaghan CA, Shine B, Lasserson DS. Chronic kidney disease: a large-scale population-based study of the effects of introducing the CKD-EPI formula for eGFR reporting. BMJ Open 2011;1:e000308. doi:10.1136/bmjopen-2011-000308
Funding This work is underpinned by support from the National Institute for Health Research (NIHR) Oxford Comprehensive Biomedical Research Centre (BRC) and the NIHR School for Primary Care Research. The NIHR BRC and NSPCR had no role in the design and conduct of the study, data collection, management, analysis and interpretation of the data or preparation, review or approval of the manuscript.
Competing interests All authors have completed the Unified Competing Interest form at www.icmje.org/coi_disclosure.pdf (available on request from the corresponding author) and declare that (1) they have no support from companies for the submitted work, (2) they have no relationships with companies that might have an interest in the submitted work in the previous 3 years, (3) their spouses, partners or children have no financial relationships that may be relevant to the submitted work and (4) they have no non-financial interests that may be relevant to the submitted work.
Ethical approval Ethical approval was not required for this study. Clinical databases were only accessed by those with permission to do so. No individual data points were examined manually, and the data were anonymised at all stages of the analysis.
Contributors CAOC, BS and DSL contributed to the study design and concept, were involved in analysis and interpretation of data and preparation of the manuscript. CAOC is guarantor.
Provenance and peer review Not commissioned; externally peer reviewed.
Data sharing statement No additional data available.