Article Text

Abstract
Objectives Obesity is on the rise in the US and is linked to the development of type 2 diabetes and cardiovascular disease. Emerging evidence over the last decade suggests that obesity may also adversely affect executive function and brain structure. Although a great deal of research focuses on how diet affects the brain and cognitive performance, no study focuses on how food choice may be associated with brain integrity. Here we investigated how lean and overweight/obese (o/o) adults differed in their food choices and how brain structure and cognition may be associated with those choices.
Design As part of an ongoing study on diabetes and the brain, participants had routine blood work and a research MRI, received a battery of neurocognitive tests, and were instructed to keep a 3-day food diary.
Results and conclusions The lean group ate more high quality foods and less low quality foods compared to the o/o group. In the o/o group, high quality food choices were associated with orbitofrontal cortex volume. The lean group performed better than the o/o group on neurocognitive measures of executive function, such as the Stroop Interference Test, the Wisconsin Card Sort Test and the Trail Making Test B-A, and on attention and concentration tasks such as the Digit Symbol Substitution Test. Taken together, these preliminary data suggest that in obesity poor food choices may be associated with frontal cognitive impairments that may be the result of, or contribute to, decreases in orbitofrontal cortex volume. Therefore, longitudinal studies are warranted to investigate a causal link between food choice and executive functioning.
This is an open-access article distributed under the terms of the Creative Commons Attribution Non-commercial License, which permits use, distribution, and reproduction in any medium, provided the original work is properly cited, the use is non commercial and is otherwise in compliance with the license. See: http://creativecommons.org/licenses/by-nc/2.0/ and http://creativecommons.org/licenses/by-nc/2.0/legalcode.
Statistics from Altmetric.com
Article summary
Article focus
To investigate differences in executive function, attention and concentration, and orbitofrontal cortex (OFC) volumes in lean and overweight/obese (o/o) adults.
To explore a possible connection between food choice, performance on neuropsychological tests and OFC volume in lean and o/o adults.
Key messages
The o/o group did not perform as well on the cognitive measures of executive function, attention and concentration as the lean group.
The o/o group had smaller OFC volumes than the lean group.
There was a positive association between consumption of high quality foods and OFC volume in the o/o group.
Strengths and limitations of this study
We acquired detailed records of food consumption.
This was a cross-sectional study whose purpose was to explore a possible link between food choice and the brain; further longitudinal studies are necessary to show causal links.
More studies with larger sample sizes are needed to further elucidate the inter-relationship between body mass index, food choice and the brain.
Introduction
Over the last several decades, the number of overweight (body mass index; BMI 25–30 kg/m2) and obese (BMI >30 kg/m2)1 adults in the US has increased dramatically. According to the Centers for Disease Control, as of 2009, 49 states have a prevalence of obesity of 20% or greater and nine states have a prevalence of over 30%. Obesity is associated with increased risk of type 2 diabetes, cardiovascular disease and several forms of cancer.2 The US is considered an ‘obesogenic’ society where consumption of unhealthy foods and lower levels of physical activity are commonplace. Although high caloric/low nutritional value foods, such as fast food and refined carbohydrates, are easily available, this alone does not account for why people do not choose equally available high quality foods, such as fish and whole grains. One hypothesis is that food choice has a strong hedonic component and is partly influenced by the reward centres of the brain. In rats, the over-consumption of high fat foods is positively associated with the reward system3; however, these studies did not focus specifically on food choice. Another hypothesis pertains to disinhibition in eating behaviour such as overeating and opportunistic eating,4 which has long been described among obese youth and adults.5
A growing body of literature suggests a link between obesity and impaired cognition, particularly in the areas of executive function, attention and concentration.6 7 Deficits in inhibitory control are at the core of impulsivity disorders. Deficits in behavioural inhibition can negatively impact executive functions (eg, planning and prioritising), regulation of affect and motivation.8 Executive functions contribute to the self-regulation of behaviour and create a delay during which one can think before acting; thus, lack of response inhibition may be associated with impulsive behaviour. Some studies suggest that obese individuals may be more impulsive and that increased impulsivity might make it more difficult for them to resist the temptation of palatable foods.9 10 Therefore, in the context of eating, impulsivity or disinhibition is defined as the propensity to eat opportunistically in response to environmental cues and it may be expected to play a role in both the development and maintenance of obesity.11
It is suggested that inefficient connectivity among relevant brain regions might represent a neuronal marker for vulnerability to develop abnormal behaviour, including food craving and overeating.12 The orbitofrontal cortex (OFC) is involved in regulating impulse control, self-monitoring and goal-directed behaviours, all of which may play a role in eating behaviour.13–16 The health of the OFC could influence the capacity of an individual to self-regulate his/her eating behaviour, as well as influence food choice11 17 18 and nutrition related planning.13 We recently reported that among obese adolescents disinhibition in eating behaviours is associated with reductions in orbitofrontal volumes.19 Furthermore, the OFC is a component of the reward system and is involved in a positive feedback loop when palatable food is consumed.20 For example, Volkow et al21 found obese subjects had decreased dopaminergic activity and reductions in glucose utilisation in dorsolateral prefrontal and OFC regions, areas important in inhibitory control and salience attribution.
We hypothesised that overweight and obese adults (those with BMIs of 25 kg/m2 and greater) consumed more low quality and less high quality foods compared to adults with BMIs in the lean range. Furthermore, based on what is known about the circuits involved in eating behaviour and impulse inhibition, we hypothesised that differences in food choice may be related to OFC volume as well as the integrity of higher order cognitive functions known to depend, in part, on an intact OFC. To test these hypotheses, we examined 3-day food diaries, MRI and cognitive evaluations from two groups of individuals, lean adults and overweight and obese (o/o) adults. The goal of this study was to determine if future longitudinal studies were warranted to explore a causal link between food choice and executive functioning. To our knowledge, this is the first study to examine how food choice, independent of any intervention, is associated with MRI-derived OFC volumes and performance on standard neurocognitive tests that depend on OFC health.
Methods and procedures
Subjects
A total of 139 adults (98 lean and 41 overweight and obese), matched on age, gender and race (table 1), were included in the study. Subjects were consecutive cases evaluated at the Brain, Obesity, and Diabetes Laboratory (BODyLab), NYU School of Medicine as part of a National Institutes of Health-sponsored study on the brain effects of obesity and type 2 diabetes. Participants were recruited via internet advertisement, referred by collaborating doctors or recruited from an ongoing study of normal ageing. The study was approved by the local IRB. All of the participants signed informed written consent and received compensation for their time and inconvenience. Participants were screened to rule out exclusionary pre-existing medical conditions (other than hypertension, dyslipidemia, insulin resistance or type 2 diabetes) and psychiatric conditions. Other exclusion criteria were a history of significant head trauma, stroke, hydrocephalus, lacunar infarcts, mental retardation or neurological disorders.
Characteristics of lean and overweight/obese (o/o) participants
Height and weight measurements were taken on the first day of the study. BMI was calculated using the following formula: weight (kg)/height (m)2. Participants with a BMI between 19 and 24.9 kg/m2 were placed in the lean group. Participants with a BMI of 25 kg/m2 or greater were assigned to the overweight/obese (o/o) group. Given the modest number of subjects studied as well as the similarities in relevant biological parameters (insulin resistance, cholesterol and blood pressure), overweight and obese participants were pooled into one group.
Three-day food diary
Participants received a 3-day food diary form and were instructed to record everything they consumed (breakfast, lunch, dinner and snacks) with the exception of water. The participants' self-reported diets were quantified into 13 different categories (farm produce, dairy, meat, fish, whole grains, refined carbohydrates, fried food, nuts, fast food, soda, junk food, alcohol, miscellaneous) by JIC, who has a PhD in nutrition. Subcategories were based on the categories in the Healthy Eating Index, a measure of diet quality developed by the United States Department of Agriculture.22 Quantification of all foods was based upon serving sizes, as defined by the American Dietetic Association and the United States Department of Agriculture. Quantity of food consumed was expressed as number of servings per day. The high quality diet consumption score was the sum of farm produce, fish, whole grains and nuts. The low quality diet consumption score consisted of the sum of meat, refined carbohydrates, fried food, fast food, junk food and alcohol. Meat was placed in the low quality category because studies show that meat containing diets are associated with diseases such as diabetes, obesity and hypertension.23 24 Poultry was placed in the low quality group because when the method of preparation was reported, it was most consistently reported as fried. Dairy products were not included in either group because most participants did not give enough detail regarding the type of dairy products consumed (ie, low fat vs full fat yogurt, skim milk vs whole milk, or unspecified cheese) and therefore we could not place it into the high or low quality category. A second trained rater (MD), a graduate student in nutrition, independently assessed a randomly selected subset of 30/139 food diaries, to ascertain inter-rater reliability. During the coding process, both raters were blinded to the participant's group affiliation. These independent ratings showed excellent agreement, with an inter-class correlation coefficient of 0.97 and 0.86 for the high and low quality diets, respectively (figure 1).

Inter-rater reliability for 3-day food diaries. High and low quality food choices were assessed by two independent raters. The inter-class correlation coefficients for the high and low quality food choices were 0.97 and 0.86, respectively.
MRI
MRI scans were acquired on either a 1.5 T GE Vision or 1.5 T Siemens Avanto system, using equivalent sequences. The images on the GE Vision were 3-dimensional coronal T1-weighted spoiled gradient recalled (SPGR) sequences (TR 30 ms; TE 2 ms; 124 slices, slice thickness 1.5 mm with no gap; FOV 250×250 mm; flip angle 60°). Please see Gold et al25 for more detail. For the Siemens system, a set of structural T1-weighted magnetisation-prepared rapid acquisition gradient echo (MPRAGE) sequences (TR 1300 ms; TE 4.38 ms; TI 800 ms; NEX 1; FOV 250×250 mm; 196 coronal slices, slice thickness 1.2; flip angle 15°) were acquired. Although susceptibility issues are of great importance in echo-planar acquisitions such fMRI or DTI, particularly for inferior frontal regions such as the orbitofrontal area, they are not a major concern for the structural images (SPGR and MPRAGE) reported here. Moreover, our two structural imaging sequences are very much equivalent. However, to formally test the correspondence between the two scanners, 10 subjects were scanned on both scanners in close time proximity and then had intracranial vault volume obtained on both instruments. The volumes obtained were indistinguishable (paired t test: t=0.029, p=0.977).26
Grey matter volumetric data
Cortical reconstruction and volumetric segmentation of the SPGR and MPRAGE images was performed by the FreeSurfer image analysis suite, V.4.0.2 (http://surfer.nmr.mgh.harvard.edu). FreeSurfer is fully automated and so a manually drawn region of interest (ROI) was not used, which eliminates any human bias. FreeSurfer divides the brain into the temporal lobe, frontal lobe, OFC, parietal lobe, occipital lobe and cingulate gyrus. In each of these areas FreeSurfer measures multiple subdivisions. The development of this software and the details of how the specific regions are identified are found in a paper by Desikan et al.27 The orbitofrontal ROI was selected a priori based on our very specific hypotheses and its importance in response inhibition and palatability of food (through olfaction) and as an important part of the reward system. Given our use of FreeSurfer, we felt that it was extremely important to be very targeted in our approach and variables selected for analyses.
The FreeSurfer procedure involves the removal of non-brain tissue, automated Talairach transformation, segmentation of the subcortical white matter and construction of a model boundary of the cortical grey and white matter. After the cortical models were complete, parcellation of the cerebral cortex into units based on the gyral and sulcal structures using Desikan parcellation schemes was carried out.27 The final step computes the volumetric labelling of the lateral and medial OFC. For our analyses, we combined the lateral and medial OFC. In addition, by utilising a reliable manual method25 we measured the intracranial vault volume and used this number to adjust (residualise) the OFC data for individual variability in head size. We utilised the rostral middle frontal gyrus as a control region. This region was selected for the following reasons: it is equivalent in size to the OFC, it is also in the frontal lobe, and most importantly, it is related to decision making in the context of food choice,28–30 which will allow us to comment on the anatomic specificity of our findings.
Neuropsychological evaluation
Participants completed a battery of standard neuropsychological tests that included, but was not limited to, executive functioning, attention/concentration, working memory and psychomotor/processing speed. The rationale for the selection of the measures as well as their more detailed description are provided in previous publications.31 32 Measures of various aspects of executive functioning included the Stroop Interference Test, the Trail Making Test and the Wisconsin Card Sort Test (WCST). Number of words completed on the colour-word trial and the interference score were the variables of interest for the Stroop. For the Trail Making Test, we subtracted time to complete Trails A from time to complete Trails B, thus controlling for the motor aspect of the test and allowing for assessment of a more pure measure of executive functioning.33 Total number of perseverative errors was used to evaluate performance on the WCST. Attention and concentration was assessed by two subtests of the Wechsler Memory Scale-Revised (WMS-R): Digit Span and Visual Memory Span. Psychomotor/processing speed and working memory were assessed by the Digit Symbol Substitution Test (DSST) from the Wechsler Adult Intelligence Scale-Revised (WAIS-R).34 General intellectual functioning was assessed using the Shipley Institute of Living Scale. WAIS-R Full Scale IQ score estimates were derived from the Shipley score. For the analyses raw scores were used for each neurocognitive test.
Statistical analysis
Data were analysed using SPSS for Windows V.17.0. The Shapiro–Wilk test was used to test for normality. Independent t tests were used to investigate group differences in food choices and neuropsychological tests. Exploratory analyses were conducted using the Pearson's correlation to investigate if OFC volume was associated with dietary choices. We used linear and hierarchical regressions to account for potential confounders, such as education (step 1), IQ (step 2) and waist circumference (step 3). As both groups had an equivalent percentage of subjects with hypertension, we did not control for hypertension in our analyses. When we controlled for diabetes in the analyses, our findings remained essentially unchanged. This may be due, in part, to the small number of subjects with diabetes in our sample (17 subjects).
Results
Eating habits assessment
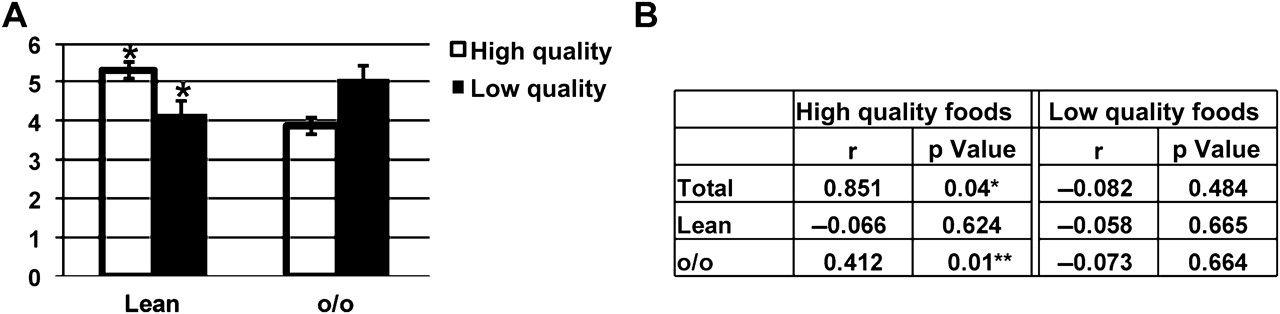
After adding together the 13 food groups, no differences were found in the total number of food servings (combining high and low quality) consumed by the lean and o/o groups (data not shown). However, the o/o group consumed significantly more low quality foods and less high quality foods compared to the lean group (figure 2A). The group differences were not reduced when controlling for education and abdominal adiposity as determined by waist circumference.
High and low quality food consumption in lean and overweight/obese (o/o) adults. (A) The total number of high (farm produce, fish, whole grains and nuts) and low (meat, refined carbohydrates, fried food, fast food, junk food and alcohol) quality foods consumed per day was counted. Values represent means±SEM. Values with (*) are significantly different from other groups with the same bar colour, p<0.05. (B) Associations between orbitofrontal cortex (OFC) volumes and high and low quality food consumption for the lean and o/o groups. *p<0.05; **p≤0.01.
Neuroimaging assessment
Residualised OFC volume positively correlated with high quality food choice in the total subject pool (figure 2B) and was negatively, but not statistically significantly, associated with low quality food choice in the total and o/o groups. Further analysis revealed that the positive correlation was driven by the o/o group, since it was not present for the lean group alone. The control region, the rostral middle frontal gyrus, failed to show group volume differences, and most importantly, also failed to show associations with food quality.
Neurocognitive assessment
Next we investigated potential differences in cognitive function between the lean and o/o groups. A significant difference in the Stroop and WCST perseverative errors was observed between the lean and o/o groups' performance, with the lean group performing better (table 2). There was a positive association between low quality food choice and perseverative errors on the WCST (r=0.616, p=0.000). Lean participants took significantly less time than o/o participants to complete the Trail Making Test B-A (table 2) (shorter time indicates better performance).
Scores on the neuropsychological tests
Similar to the performance on selected executive functioning measures, measures of attention/concentration, working memory and psychomotor/processing speed yielded significantly better results in the lean group compared to the o/o group. The lean group performed better on both digit span forwards and backwards, visual memory span forwards and backwards and on the DSST compared to the o/o group (table 2). Some of the measures were associated with BMI (Digit Symbol Substitution Test r=−0.170, p=0.04; digit span backwards r=−0.164, p=0.05; visual memory span forwards r=−0.172, p=0.04) while others were associated with OFC volume (digit span forwards r=0.182, p=0.04; Trails B-A r=0.166, p=0.04).
Demographic data
As expected from the group assignment, the o/o group had significantly higher weights, waist circumference and BMI compared to the lean group (table 1). Although both groups had some college education, a statistically significant difference was noted between the lean group and the o/o group in education and IQ, with the lean group having more years of education and an overall higher estimated IQ. However, when we controlled for education and IQ in our analyses, our results were unchanged, thus suggesting that the group differences in eating habits, cognition and the brain were not based on differences in education or IQ. Additionally, no difference was seen by gender for either of the two groups.
Discussion
We found that subjects with a BMI greater than or equal to 25 kg/m2 reported eating more low quality and less high quality foods compared to subjects with a BMI of less than 25 kg/m2. In the o/o group, high quality food choice was positively and significantly associated with the intra-cranial vault-adjusted (residualised) OFC volume. Overall, the lean group performed better on neurocognitive tests of executive function, inhibition, attention/concentration and psychomotor/processing speed compared to the o/o group. Taken together, these data suggest that frontal lobe-based cognitive impairments and decreased OFC volume may be associated with food choice. This is an exploratory study and the results will need to be confirmed with future studies utilising larger data sets and broader exploration of possible brain areas and cognitive domains involved, while controlling for multiple comparisons. It is unknown if the decrease in OFC volume precedes or is the result of excessive weight gain.
Previous studies report negative associations between BMI and grey matter volumes, specifically in the prefrontal and frontal areas of the brain.7 35 Moreover, recent evidence suggests that obesity impairs cognitive processes6 36 and that executive functions are the most susceptible to the negative effects of excess weight.6 7 Our findings, demonstrating reductions on tests reflecting predominantly frontal lobe functions, are consistent with those studies. In addition to having reductions in OFC volumes, the o/o group did not perform as well as the lean group on tests that require planning, initiating, shifting, monitoring and inhibiting behaviour, all of which are essential for goal directed behaviours. These findings suggest that OFC volume may be a possible contributing factor to the group cognitive differences.
Education and IQ are consistently found to positively correlate with performance on cognitive tests.37 While our lean group had significantly higher education and IQ (table 1), importantly neither education nor IQ contributed to explaining the significant group differences in food choice, cognitive performance or OFC volumes. It is likely that because both groups were well educated, and the mean IQ fell well within what is considered the normal range, education and/or IQ did not significantly contribute to the variance between the two groups on cognitive test performance.
The construct of disinhibition in eating behaviour is defined as a tendency towards over-eating and eating opportunistically.4 Our study found that compared to their lean counterparts, overweight and obese adults ate more low quality foods and less high quality foods. In addition, they did not perform as well on cognitive tests that reflect frontal lobe functioning, which may also be associated with poorer impulse control. We recently observed similar cognitive dysfunction in obese adolescents,19 which has also been observed in adults with gambling addiction.38 Addicted gamblers are classified as having lower impulse control capabilities.39 It is important to note that while several of our cognitive measures were associated with OFC volume, others were associated with BMI. This highlights the need for further research to elucidate how BMI, the brain and cognitive function are related. Our data support previously observed correlations between overeating and diminished impulse control in both children and adults.11 17 Moreover, functional MRI studies have also established a link between gambling behaviour and OFC.40 Taken together, these data suggest that disinhibited eating and other disorders of impaired impulse control may share similar neural substrates.
The OFC, a component of the frontal lobe involved in both impulse inhibition and the gustatory system of the brain,41 has not been thoroughly investigated with regard to food choice. We chose to focus on the OFC because it is also involved in decision making,13 addictive behaviour40 and the reward system.20 Previously, human studies investigated the link between OFC activity and hunger/satiety.42 Positron emission tomography (PET) studies find that OFC activity is diminished in both lean and obese subjects after eating; however, activity is decreased to a much greater extent in obese individuals compared to lean individuals.42 Reductions in OFC activity may lead to poorer impulse control and may exacerbate poor food choices or contribute to continual eating after a meal. These deeper postprandial reductions in OFC activity in obese individuals are not the result of increased brain energy needs in obese individuals, since FDG-PET studies show similar basal metabolic rates between lean and obese individuals.7 This study supports the hypothesis that OFC integrity, not energy needs, negatively influences decision making and food choice in an o/o population. Repetitive transcranial magnetic stimulation and fMRI studies examining the neural basis of food choice found that other areas of the brain, such as the dorsolateral and ventromedial prefrontal cortex, are known to communicate with the OFC and influence decision making and food choice.28 29 Future studies should also include these regions in the analyses.
While the association between OFC volume and food quality were in the expected directions, only the correlation between OFC and high quality food was significant in the o/o group, namely those individuals with more intact OFC consumed more high quality food (or were more successful in inhibiting the consumption of low quality foods). Alternatively, these results may suggest that other neural mechanism(s) could contribute to the consumption of low quality (more palatable) food. One possibility is that this choice is mediated by the reward system and suggests that potential differences in dopamine between the two groups could be driving food choice.12 43 In both rodents and humans, alterations in normal dopamine production and signalling are associated with overeating.3 44 This possibility is supported by our findings in the OFC which, in addition to executive function, is also central to the reward system.20 The OFC directs signals to the amygdala and hypothalamus, two areas of the brain that are implicated in pleasure and satiety. The frontal lobes are important in the feedback control of the hypothalamic–pituitary–adrenal axis.45 Human studies show that administration of corticotrophin-releasing hormone increases cortisol levels and food intake in healthy adults.46 Furthermore, hypothalamic–pituitary–adrenal axis hyperactivity is observed in obese subjects with type 2 diabetes.47
A particular strength of our study is that the use of food diaries allowed participants to record consumed food items, free of restriction to those contained in a finite list; however, this may also represent a possible limitation of the study. For example, a review of the literature suggests that the act of documenting food intake for >1–2 days may lead to behavioural modification, such as decreasing dietary intake or intentionally not recording consumed foods, both of which could reduce the validity of food diary data as a reflection of the person's usual consumption.48 Furthermore, participants may grow weary of recording over time, leading to cursory documentation and/or food omission.49 Additionally, overweight people tend to under-report what they consume.48 However, our o/o group still reported consuming significantly more low quality food compared to the lean group; therefore, we suggest that if under-reporting did occur, it would have only reduced the strength of our findings, thus making this report likely conservative. Lastly, we observed variability in the amount of detail between diaries such as incomplete entries and lack of adequate description, which led to the elimination of some participants and the removal of dairy data from the data set. Despite these limitations, weighed food diaries remain the gold standard and are used to validate other dietary assessment methods with the exception of observational studies.48 Unlike questionnaires which require memory recall over longer periods of time, food diaries are more accurate as they are recorded close to the time the food is consumed. Another strength of this study pertained to the data coding process that we utilised. We operationalised and standardised diary entries. This process increases data accuracy.50 This strength was clearly reflected in the high inter-rater reliability between coders for both the high and low quality diets.
To our knowledge, this is the first report to illustrate a possible association between everyday food choices, performance on cognitive tests and MRI-derived regional brain volumes. While previously published work established links between obesity and cognitive performance,7 this is the first paper to demonstrate that decreased OFC volume may contribute to food choice. Longitudinal studies are needed to determine if poorer performance on cognitive tests and smaller OFC volumes are the cause or the result of poor food choices. Furthermore, it is important to investigate if weight loss could improve cognitive performance and choice of food.
Acknowledgments
We thank Victoria Sweat for her comments on the manuscript.
References
Supplementary materials
Supplementary Data
This web only file has been produced by the BMJ Publishing Group from an electronic file supplied by the author(s) and has not been edited for content.
Files in this Data Supplement:
- Data Supplement - Manuscript file of format pdf
Footnotes
Correction notice The “To cite: …” information and running footer in this article have been updated with the correct volume number (volume 1).
To cite: Cohen JI, Yates KF, Duong M, et al. Obesity, orbitofrontal structure and function are associated with food choice: a cross-sectional study. BMJ Open 2011;1:e000175. doi:10.1136/bmjopen-2011-000175
Funding This study was supported by grants from the National Institutes of Health (DK064087 to AC and T32-DA007254-16 to JIC) and supported in part by grant 1UL1RR029893 from the National Center for Research Resources.
Competing interests None.
Ethics approval Ethics approval was provided by NYU School of Medicine IRB.
Contributors JIC contributed to analysis and interpretation of data, and drafting and revising of the article, and gave final approval. KFY contributed to data analysis, and drafting and revising of the article, and gave final approval. MD contributed to drafting and revising of the article and interpretation of the data, and gave final approval. AC contributed to drafting and revising of the article, the concept and design of the parent study, and gave final approval.
Provenance and peer review Not commissioned; externally peer reviewed.
Data sharing statement No additional data are available.