Article Text

Abstract
Background Antibiotic resistance is a growing problem worldwide, but communicating this challenge to policymakers and non-experts is complicated by the multiplicity of bacterial pathogens and the distinct classes of antibiotics used to treat them. It is difficult, even for experts aware of the pharmacodynamics of antibiotics, to infer the seriousness of resistance without information on how commonly the antibiotic is being used and whether alternative antibiotics are available. Difficulty in aggregating resistance to multiple drugs to assess trends poses a further challenge to quantifying and communicating changes in resistance over time and across locations.
Methods We developed a method for aggregating bacterial resistance to multiple antibiotics, creating an index comparable to the composite economic indices that measure consumer prices and stock market values. The resulting drug resistance index (DRI) and various subindices show antibiotic resistance and consumption trends in the USA but can be applied at any geographical level.
Findings The DRI based on use patterns in 1999 for Escherichia coli rose from 0.25 (95% CI 0.23 to 0.26) to 0.30 (95% CI 0.29 to 0.32) between 1999 and 2006. However, the adaptive DRI, which includes treatment of baseline resistant strains with alternative agents, climbed from 0.25 to 0.27 (95% CI 0.25 to 0.28) during that period. In contrast, both the static-use and the adaptive DRIs for Acinetobacter spp. rose from 0.41 (95% CI 0.4 to 0.42) to 0.48 (95% CI 0.46 to 0.49) between 1999 and 2006.
Interpretation Divergence between the static-use and the adaptive-use DRIs for E coli reflects the ability of physicians to adapt to increasing resistance. However, antibiotic use patterns did not change much in response to growing resistance to Acinetobacter spp. because physicians were unable to adapt; new drugs for Acinetobacter spp. are therefore needed. Composite indices that aggregate resistance to various drugs can be useful for assessing changes in drug resistance across time and space.
This is an open-access article distributed under the terms of the Creative Commons Attribution Non-commercial License, which permits use, distribution, and reproduction in any medium, provided the original work is properly cited, the use is non commercial and is otherwise in compliance with the license. See: http://creativecommons.org/licenses/by-nc/2.0/ and http://creativecommons.org/licenses/by-nc/2.0/legalcode.
Statistics from Altmetric.com
Article summary
Article focus
The difficulty in aggregating resistance to multiple drugs to assess trends poses a challenge to quantifying and communicating changes in drug resistance over time and across locations.
We developed a method for aggregating bacterial resistance to multiple antibiotics, creating a drug resistance index comparable to the composite economic indices that measure consumer prices and stock market values.
Key messages
Composite indices that aggregate resistance to various drugs can be useful for assessing changes in drug resistance across time and space.
Divergence between the static-use and the adaptive-use DRIs for Escherichia coli reflects the ability of physicians to adapt to increasing resistance. Antibiotic use patterns did not change much in response to growing resistance to Acinetobacter spp., indicating the limited treatment options physicians are left with and the need to develop new drugs against this pathogen.
Strengths and limitations
The resistance index takes a first important step towards making trends in resistance intelligible to non-experts and useful to experts.
Gathering accurate data on antibiotic sales is particularly challenging in countries with a large informal pharmaceutical sector. However, our model only requires consistency in trends in antibiotic consumption and it is likely to be a consistent measure of trends unless there is systematic time-variant bias in measuring components of the index.
We demonstrate the drug resistance index using US data, but alternative applications include all other geographical levels, or the scale of individual facilities, where data on both resistance and antibiotic use are likely to be available.
Introduction
That antibiotics are losing effectiveness around the world is by now clear not just to the medical profession but also to those following media stories on the rise of ‘superbugs’. However, efforts to effectively communicate the challenge of antibiotic resistance to the lay public and policymakers have been somewhat unsuccessful. Despite increased attention in the USA and Europe to the resistance problem, there has been little progress in allocating financial resources either to conserve the effectiveness of existing drugs or to incentivise the development of new antibiotics. As one journal editor put it, ‘it is time that antibiotic resistance became an issue of popular concern rather than the interest of a few experts’.1 Several reasons explain why this has not happened.
First, policymakers are largely unfamiliar with the scientific names of pathogens. To a policymaker, that susceptibility of Streptococcus pneumoniae to penicillin is 40% may carry little meaning.
Second, data on the resistance of a pathogen to one or more drugs may be viewed out of context if substitutes to treat the infection exist. In the USA, growing resistance of Escherichia coli to trimethoprim–sulfamethoxazole has been accompanied by a reduction in the proportion of patients treated with that drug. How should we view the increase in resistance to drugs that are declining in use? Is resistance as critical when we have near-substitutes that clinicians can deploy, such as imipenem in the case of E coli? If doctors use injectable cephalosporins a hundred times more often than they do penicillin to treat invasive infections caused by S pneumoniae, shouldn't resistance to those cephalosporins carry more weight than resistance to penicillin?
Third, resistance goes up in some years and down in others, as seen in resistance of Staphylococcus aureus to oxacillin (MRSA) in several European countries2 and Acinetobacter spp. to ciprofloxacin. In aggregate, has resistance to the antibiotics used most commonly to treat infections caused by these two pathogens increased or decreased over time?
Fourth is a problem specific to bacterial pathogens: antibiotic resistance affects not a single disease, like HIV, TB or malaria, but rather a set of syndromes and infections caused by different bacteria. A policymaker may understand that drugs to treat HIV/AIDS are failing but be unable to grasp the complexity of bacterial resistance. Therefore, information on susceptibility to a single pathogen and a single antibiotic cannot inform priority setting and allocation of health resources.
Here, we propose a drug resistance index (DRI) that can be used to communicate gaps in antibiotic effectiveness to non-experts. This index is based on economic metrics, like the consumer price indices or stock market indices, which are used in nearly every country. The purpose of these indices is simple—to quantify the average cost of purchasing a basic basket of goods and services deemed essential to living (in the case of price indices) or the average price of a basket of shares being traded (in the case of stock market indices). In our case, the metric should communicate the average effectiveness of the set of antibiotics that are used to treat a given bacterial infection.
Methods and data
Drug resistance indices
There are five attributes desirable in a DRI. First, the DRI should be comparable across time and location so that it can be used to measure changes in drug effectiveness in a single country over time as well as to compare effectiveness across countries. Second, the DRI should be calculable with minimal data but be able to incorporate more information to improve precision when additional data become available. Third, the DRI should be simple enough that policymakers, the lay public and non-infectious disease medical practitioners can comprehend gaps in drug effectiveness, affordability and accessibility. Fourth, resistance of a pathogen to a specific drug should be weighted by the extent to which that drug is used for treating the pathogen, in much the same way that an inflation index weights the price of different commodities by the average share of income devoted to them. A change in the price of salt should affect the consumer price index by a smaller amount than an equal percentage change in the price of gasoline, which is used in greater quantities by the average household.
Finally, the resistance index should be sensitive to changes in the types of drugs being used. The first description of high-level resistance to ampicillin (β-lactamase production) in Haemophilus influenzae3 was sufficient to change empiric meningitis treatment from penicillin or ampicillin to the extended-spectrum cephalosporins in the developed world. Despite widespread β-lactamase-producing H influenzae and penicillin-resistant pneumococci, this shift has only recently begun in developing countries, as the extended-spectrum cephalosporins come off patent and become affordable. The adaptive index for treatment of meningitis remains low in the developed world and is much higher in developing countries where alternative therapy thus remains limited in its availability.
Data
Computing the DRI requires data on bacterial susceptibility and antibiotic use. The scale at which these data are needed depends on the scale at which the resistance index is being computed—as low as the level of an individual healthcare facility or as high as a country or region. Ideally, resistance data are representative at the level for which the index is being computed. The weighting data are estimates of the shares of the different types of antibiotics as a proportion of treatments indicated for pathogens covered by the index. These weights are based on antibiotic use data obtained from hospital pharmacies and commercial sources, such as IMS Health. In places where detailed antibiotic use data are not available, structured expert elicitation and other such methods can be used to elicit information on the proportions of antibiotics used to treat specific infections.4 For resistance indices related to infections defined by a specific anatomical site (pneumonia, meningitis, sepsis, urinary tract infection (UTI), etc), additional data are needed to weight each pathogen based on the etiologic fraction, that is, the proportion of infections they cause.
Role of the funding source
The institutions that supported this work had no role in study conception, data collection, analysis and interpretation, and writing of the manuscript. All authors had full access to the data. All authors had the final responsibility for the decision to submit for publication.
Example index
The DRI measures changes through time in the proportion of disease-causing pathogens that are resistant to the antibiotics commonly used to treat them. For the purpose of exposition, we have constructed a DRI for two pathogens, E coli and Acinetobacter spp., using national US data on the proportion of isolates tested that are resistant and antibiotic consumption. The annual percentage change in the DRI is a measure of the rate of depletion of antibiotic effectiveness.
Since antibiotic use may change over time in response to changing levels of antibiotic resistance, we compare trends in the index with the counterfactual case, where antibiotic use remains fixed to a baseline year. A static-use DRI allows assessment of the extent to which drug use has adapted in response to resistance and the burden that this resistance would have caused if antibiotic use patterns had not changed:
Changing antibiotic use patterns over time may mitigate the burden of antibiotic resistance. To incorporate changing trends in antibiotic use, we also construct an adaptive version of the DRI; it aggregates the frequency with which infections from a particular pathogen are resistant to antibiotic treatment and may be estimated as follows:
Implementing the DRI using US data
Prevalence of resistance
CIs for the indices were derived using a non-parametric bootstrap method with n=10 000 observations drawn at random from each of the itemised data sets of antibiotic prescriptions and individual susceptibility tests and replicated m=1000 times. Statistical analysis was performed using STATA V.11 (Stata Corporation) and R V.2.13.1 (Free Software Foundation Inc., Boston, Massachusetts, USA).
Figure 1A,B shows that resistance of E coli and Acinetobacter spp. inpatient and outpatient isolates in the USA increased between 1999 and 2006. Rates of increase were remarkable for Acinetobacter spp. resistant to carbapenems and fluoroquinolones, as well as for E coli resistant to fluoroquinolones, trimethoprim–sulfamethoxazole (TMP-SMX) and aminopenicillins. Figure 2A,B shows prescribing proportions for antibiotics that were featured in The Surveillance Network database of susceptibility tests for Acinetobacter spp. and E coli and are commonly used to treat gram-negative infections. For E coli, usage patterns have shifted towards increased fluoroquinolone and later generation cephalosporin use in lieu of less expensive alternatives, such as aminopenicillins and TMP-SMX.

(A) Resistance rates of Acinetobacter spp. to four antibiotic classes in the USA, 1999–2006. Note: The following drugs were used to test for resistance to antibiotic classes: third-generation cephalosporins—ceftriaxone, ceftazidime; fluoroquinolones—ciprofloxacin, levofloxacin; carbapenems—imipenem; fourth-generation cephalosporins—cefepime. (B) Resistance rates of Escherichia coli to eight antibiotic classes in the USA, 1999–2006. Note: The following drugs were used to test for resistance to antibiotic classes: aminopenicillins—ampicillin; trimethoprim–sulfamethoxazole; increased activity β-lactams—ampicillin/sulbactam, aztreonam, piperacillin; third-generation cephalosporins—ceftriaxone, ceftazidime; fourth-generation cephalosporins—cefepime; fluoroquinolones—ciprofloxacin, levofloxacin; aminoglycosides—gentamicin, tobramycin; carbapenems—imipenem. Source: author's calculations using susceptibility data from The Surveillance Network®.
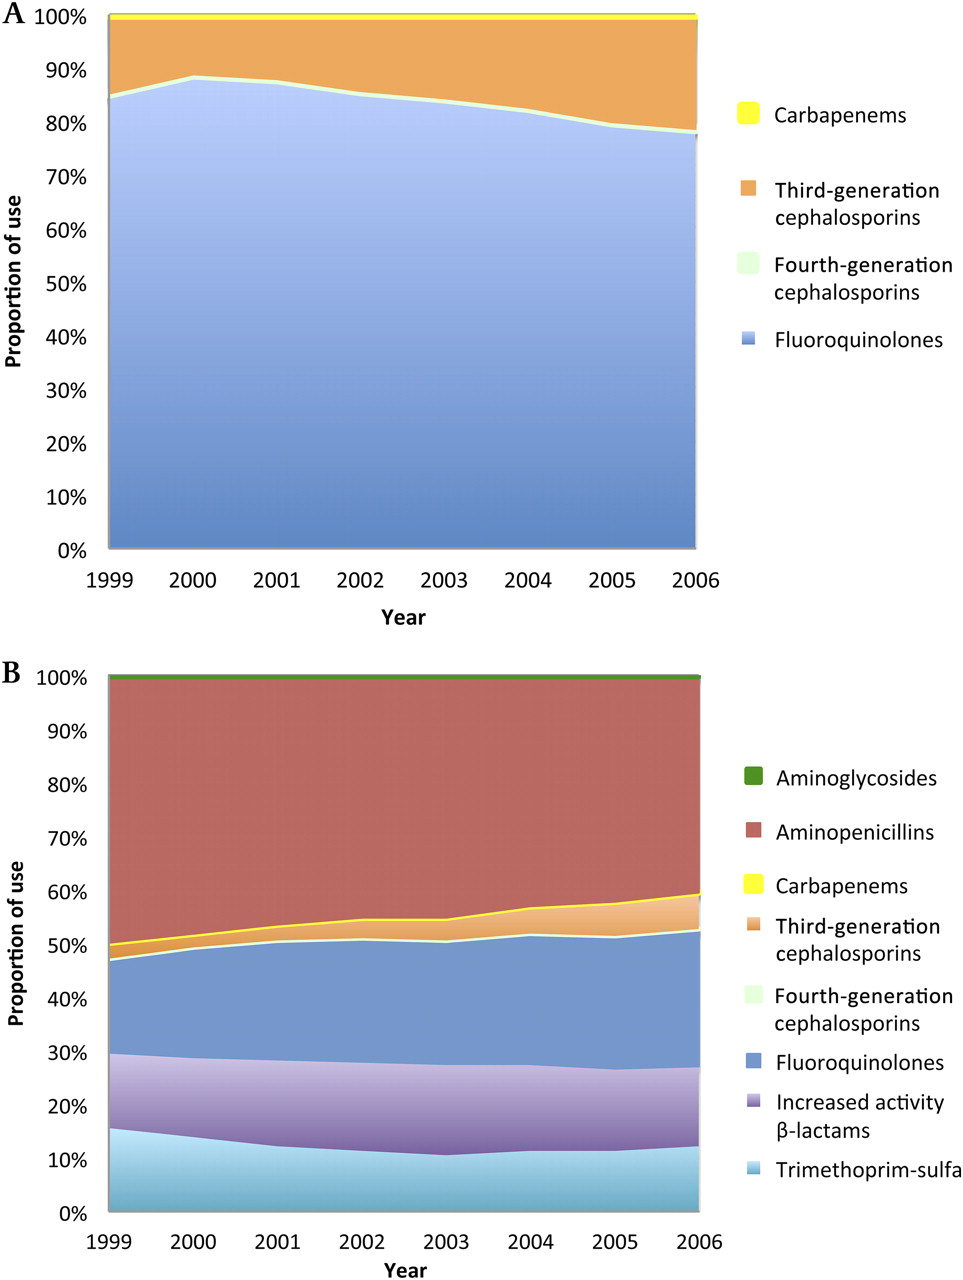
(A) Proportions of most-common antibiotic classes used to treat infections caused by Acinetobacter spp. in the USA, 1999–2006 Source: Author's calculations with prescription data derived from IMS Health Xponent January 1999 to December 2007, IMS Health Incorporated. (B) Proportions of most-common antibiotic classes used to treat infections caused by Escherichia coli in the USA, 1999–2006. Source: author's calculations with prescription data derived from IMS Health Xponent January 1999 to December 2007, IMS Health Incorporated.
Static-use and adaptive-use DRIs are shown in figure 3. For Acinetobacter spp., the static-use DRI increased by 17%, from 0.41 to 0.48, while for E coli, the static-use DRI increased from 0.25 to 0.30. The results show that for E coli, the static-use DRI exceeds the adaptive-use DRI for all years, which increases from 0.25 to 0.27 between 1999 and 2006. This rate of increase is lower than for the static-use DRI with a statistically significant difference for 2006, indicating that clinicians were able to effectively adapt antibiotic use patterns in response to trends in antibiotic resistance.

Static- and adaptive-use DRIs for Acinetobacter spp. and Escherichia coli in the USA, 1999–2006. Note: Dotted lines represent 95% CIs; CIs for resistance and use proportion components derived using a bootstrap method with m=1000 simulations. A t test showed that the difference of means from the bootstrap distribution was statistically significant at 1% level. Source: author's calculations using susceptibility data from The Surveillance Network® and prescription data derived from IMS Health Xponent January 1999 to December 2007, IMS Health Incorporated.
On the other hand, there is little difference between the static- and adaptive-use indices for Acinetobacter. The similarity between the two indices suggests that there is little room for clinicians to adapt antibiotic use patterns to decreasing treatment effectiveness.
DRIs for first-line therapy
Clinicians and policymakers may be more concerned about resistance to first-line treatments. Resistance to these drugs implies the loss of cheaper more widely used alternatives and could affect drug procurement budgets if government facilities are an important source of treatment. Trends in resistance to first-line treatments may also be important for setting national treatment guidelines, essential drug lists or hospital formularies.
Resistance to second-line treatments could indicate that the need to invest in new antibiotics is more urgent. The line of treatment DRI is calculated as.
where Tn is the set of n-line treatments. From here on, for simplicity, we report only the adaptive form of the index for E coli. An important caveat is that when a single antibiotic corresponds to an entire line of therapy, the models are equivalent to summarising trends in resistance to this antibiotic over time.
Over the period 1999–2006, drugs commonly used as first-line therapies for UTIs included, trimethoprim–sulfamethoxazole (TMP-SMX) and fluoroquinolones.6 Results separating antibiotics into first-line and non-first-line categories follow for E coli isolates. The adaptive-use index of resistance to first-line therapies was lower than the resistance to other therapies (figure 4). However, resistance to first-line therapies increased at a much higher rate, a likely consequence of their widespread use. Resistance to non-first-line therapies remained unchanged over time, suggesting that new treatment options among these non-first-line drugs preserved their overall effectiveness.

Adaptive DRIs for first- and non-first-line therapies for Escherichia coli in the USA, 1999–2006. Note: (A) Dotted lines represent 95% CIs; CIs for resistance and use proportion components derived using a bootstrap method with m=1000 simulations. (B) Trimethoprim–sulfamethoxazole and oral fluoroquinolones used as first-line therapies against E coli urinary tract infections based on Taur and Smith.6 Source: author's calculations using susceptibility data from The Surveillance Network® and prescription data derived from IMS Health Xponent January 1999 to December 2007, IMS Health Incorporated.
Affordability indices
Antibiotic resistance may force clinicians to use more expensive antibiotics to treat infections. An affordability index summarises resistance trends among cheaper or more expensive antibiotics. Such an index could mirror a first-line treatment index, but not always. A model of resistance of an organism to drugs in a certain cost range may be estimated as follows:
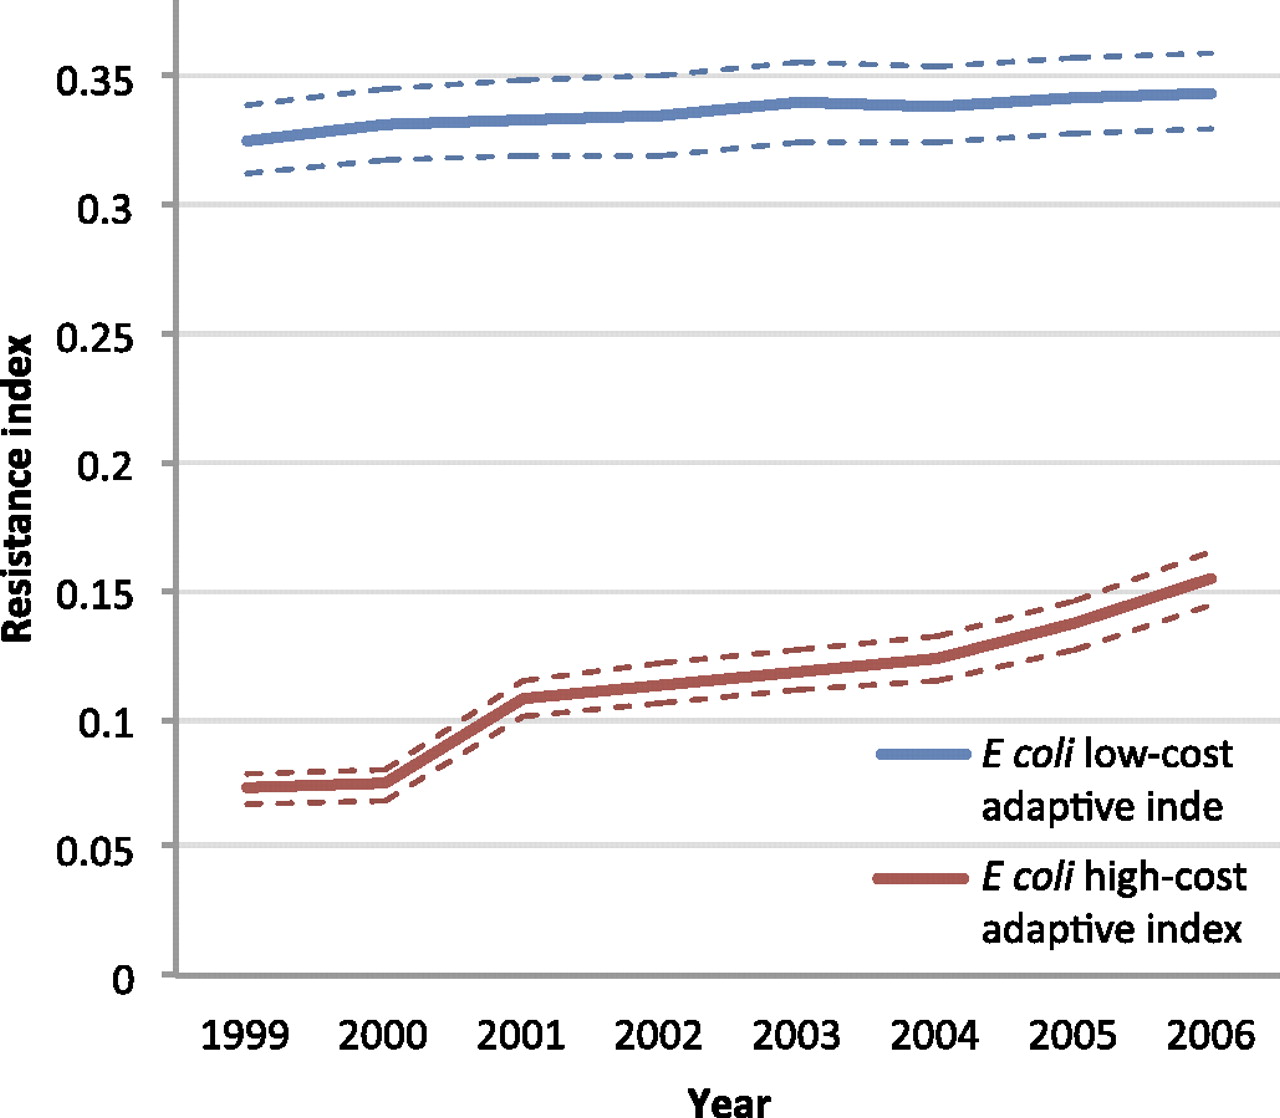
The adaptive DRI for high-cost drugs used to treat E coli was lower, indicating overall lower levels of resistance to higher cost drugs (figure 5). However, there was an upward trend in the adaptive index for higher cost drugs, indicating that as resistance increased, there was a limited set of higher cost drugs that physicians could prescribe leading to an increasing DRI. Interestingly, the low-cost adaptive DRI for E coli has remained relatively flat, consistent with the overall unchanged trend in DRI for E coli.
Adaptive affordability DRIs for high- and low-cost therapy for Escherichia coli in the USA, 1999–2006. Note: (A) Dotted lines represent 95% CIs; CIs for resistance and use proportion components derived using a bootstrap method with m=1000 simulations. (B) Low- and high-cost indices are based on daily cost at or under $30 and exceeding $30, respectively. Cheap drug classes include aminoglycosides, aminopenicillins, third-generation cephalosporins and trimethoprim–sulfamethoxazole; expensive drug classes include fourth-generation cephalosporins, carbapenems, fluoroquinolones and increased activity β-lactams. Daily drug cost data were obtained from Cornell University's Weill Medical College.i Source: author's calculations using susceptibility data from The Surveillance Network® and prescription data derived from IMS Health Xponent January 1999 to December 2007, IMS Health Incorporate.
Other potential indices
Clinicians do not usually have information on the infecting organism at start of empiric therapy, but they do have information on the site of infection. It would also be possible to set up indices based on the anatomical site and type of infection. Antibiotic use patterns would be straightforward, but resistance would have to be weighted against the etiological fraction of the different causative organisms.
Another potential index could contrast the relative drug effectiveness of gram-positive versus gram-negative organisms. Similar indices could cover all pathogens in inpatient versus outpatient settings. Finally, although we have presented results for antibiotic resistance, similar indices can be computed for other infectious diseases, like HIV/AIDS, tuberculosis and malaria, for which resistance is a problem and the choice of therapeutics also varies over time.
For all indices discussed so far, subindices can be computed for different categories and subcategories of pathogens and then combined to produce the overall index with weights reflecting their shares in the total of the antibiotics used for treatment.
Discussion
Antibiotic resistance imposes a substantial public health burden. Quantifying overall changes in resistance over time and across locations is difficult because resistance of pathogens to individual drugs must be aggregated to assess overall burden. Here, we take a first step towards the development of resistance indices, summarising resistance at the level of the infectious agent.
The results indicate that although clinicians have been able to adapt to increasing resistance in E coli by switching to antibiotics that remain active, as indicated by the divergence between the static-use and adaptive DRI, they have had fewer alternatives in the case of Acinetobacter spp., where resistance is increasing to nearly all agents.
Although we have not presented data by disease condition, E coli represents the vast majority of UTIs. Therefore, the DRI for E coli is a useful proxy as a DRI for UTIs. However, for other pathogens, infections in different sites of the body represent different challenges and may not be well represented by a single index. For instance, pneumococcal infection of the bloodstream or lungs may be a different challenge than pneumococcal disease in cerebrospinal fluid, which few drugs penetrate. The index should be based on the most recent and updated clinical breakpoints (S, I and R). These take into account the clinical effectiveness of a drug for a given infection. Clinical resistance in this context is determined by a careful analysis of all available data by international committees such as the Clinical Laboratory Standards Institute (formerly NCCLS) in the USA and the European Committee on Antimicrobial Susceptibility Testing. Thereby, the success of a given drug is defined byi the bacterium's susceptibility to the drug and by its pharmacology with regard to the time course of the drug concentration in the human body (pharmacokinetics) and the biological effect of the drug at these concentrations on the bacteria (pharmacodynamics), and whenever available, by information on clinical outcomes.
Ultimately, the robustness of the resistance index will depend on the quality of surveillance systems that generate the underlying data on susceptibility and antibiotic use. Laboratory capacity remains inadequate in many parts of the world, although surprisingly large amounts of quality data are generated but remain underutilised due to the lack of dedicated surveillance systems. Susceptibility data are more likely to be reported from largely tertiary care facilities, where problems of resistance tend to be greater than in smaller regional hospitals and could also vary by time of specimen collection.7 Thus, trends are likely to be more accurate than absolute levels. However, data-related challenges are not unique to resistance; they confront government agencies charged with computing the consumer price index as well. DRIs could motivate better reporting of resistance data from smaller facilities and provide an impetus to surveillance in both developed and developing countries.
National and regional data on antibiotic sales are increasingly available through companies like IMS Health, although in some countries, hospital prescriptions are not included. Gathering accurate data on antibiotic sales is particularly challenging in countries with a large informal pharmaceutical sector. Here, sales from the formal sector may be indicative of trends and likely mirror sales in the informal sector. A feasible immediate application of DRIs may be at the scale of the hospital, where data on both resistance and antibiotic use are likely to be available.
The resistance index takes a first important step towards making trends in resistance intelligible to non-experts and useful to experts. Policymakers, particularly in developing countries, are interested in the implications of any public health intervention for morbidity, mortality and current and future drug procurement budgets. We need to translate susceptibility into metrics that policymakers can understand and care about. A further step would be to tie the resistance index to estimates of actual disease burden. For instance, how important is resistance to Acinetobacter, which typically causes fewer infections or deaths than E coli? Translating the DRI into disease burden requires a careful unbiased assessment of clinical outcomes of resistant infections, but in the absence of these data, morbidity and mortality rates of untreated infections may well suffice. Correlation between resistance levels and severity of infection does not imply that the direction of causality runs from resistance to poor outcomes. These and other methodological challenges should be the subject of future efforts.
Acknowledgments
The authors thank Nikolay Braykov, Michael Eber, Hajo Grundmann, Eili Klein, Shawn Magnuson, Itamar Megiddo and Yolisa Nalule for excellent research assistance and helpful suggestions. The views expressed in this paper do not necessarily reflect the views of those listed above. The statements, findings, conclusions, views and opinions contained and expressed herein are based in part on data obtained under license from the following IMS Health Incorporated information service: Xponent, January 1999–December 2006, IMS Health Incorporated. All rights reserved. Such statements, findings, conclusions, views and opinions are not necessarily those of IMS Health Incorporated or any of its affiliated or subsidiary entities.
Supplementary materials
Supplementary Data
This web only file has been produced by the BMJ Publishing Group from an electronic file supplied by the author(s) and has not been edited for content.
Files in this Data Supplement:
- Data Supplement - Manuscript file of format pdf
Footnotes
To cite: Laxminarayan R, Klugman KP. Communicating trends in resistance using a drug resistance index. BMJ Open 2011;1:e000135. doi:10.1136/bmjopen-2011-000135
Funding Research time for RL was supported by the Global Antibiotic Resistance Partnership under a grant from the Bill & Melinda Gates Foundation and by the Extending the Cure project under a grant from the Robert Wood Johnson Foundation's Pioneer Portfolio.
Competing interests None.
Patient consent Consent was not obtained as the data are anonymised and risk of identification is low.
Contributors RL initiated and coordinated the research. RL wrote the manuscript with assistance from KK. Both authors saw and approved the final version.
Provenance and peer review Not commissioned; externally peer reviewed.
Data sharing statement Statistical code is available from the corresponding author at ramanan{at}cddep.org. No additional data are available.
↵i http://www-users.med.cornell.edu/∼spon/picu/referenc/abxcost.htm (accessed 23 Dec 2010).