Article Text

Abstract
Introduction It is unclear how much of the geographical variation in coronary heart disease (CHD), stroke and cancer mortality rates within the UK is associated with diet. The aim of this study is to estimate how many deaths from CHD, stroke and cancer would be delayed or averted if Wales, Scotland and Northern Ireland adopted a diet equivalent in nutritional quality to the English diet.
Methods Mortality data for CHD, stroke and 10 diet-related cancers for 2007–2009 were used to calculate the mortality gap (the difference between actual mortality and English mortality rates) for Wales, Scotland and Northern Ireland. Estimates of mean national consumption of 10 dietary factors were used as baseline and counterfactual inputs in a macrosimulation model (DIETRON). An uncertainty analysis was conducted using a Monte Carlo simulation with 5000 iterations.
Results The mortality gap in the modelled scenario (achieving the English diet) was reduced by 81% (95% credible intervals: 62% to 108%) for Wales, 40% (33% to 51%) for Scotland and 81% (67% to 99%) for Northern Ireland, equating to approximately 3700 deaths delayed or averted annually. For CHD only, the mortality gap was reduced by 88% (69% to 118%) for Wales, 58% (47% to 72%) for Scotland, and 88% (70% to 111%) for Northern Ireland.
Conclusion Improving the average diet in Wales, Scotland and Northern Ireland to a level already achieved in England could have a substantial impact on reducing geographical variations in chronic disease mortality rates in the UK. Much of the mortality gap between Scotland and England is explained by non-dietary risk factors.
This is an open-access article distributed under the terms of the Creative Commons Attribution Non-commercial License, which permits use, distribution, and reproduction in any medium, provided the original work is properly cited, the use is non commercial and is otherwise in compliance with the license. See: http://creativecommons.org/licenses/by-nc/2.0/ and http://creativecommons.org/licenses/by-nc/2.0/legalcode.
Statistics from Altmetric.com
Article summary
Article focus
Scotland, Wales and Northern Ireland experience excess cardiovascular and cancer mortality compared to England.
How much of this excess mortality is associated with differences in diet and nutrition in the four countries of the UK?
Key messages
Modelled results suggest that if Wales and Northern Ireland achieved an average diet equivalent in nutritional quality to the average diet in England, then 81% of the excess cardiovascular and cancer mortality experienced in these countries would be removed.
If Scotland achieved an average diet equivalent in nutritional quality to the average diet in England, then 40% of the excess cardiovascular and cancer mortality would be removed.
For Wales, Scotland and Northern Ireland, changes in diet would have the biggest impact on inequalities in coronary heart disease mortality.
Strengths and limitations of this study
The macrosimulation model used for the analysis is parameterised using meta-analyses of cohort and case–control studies, and considers 10 different dietary factors and 10 mortality outcomes.
Uncertainty analysis, allowing parameter estimates to vary stochastically according to distributions reported in the literature, allow for an assessment of the uncertainty of the presented results.
The model is parameterised from meta-analyses of observational studies, and therefore it is not possible to exclude the possibility of residual confounding.
Introduction
Within the UK there is considerable geographical variation in morbidity and mortality associated with chronic disease.1–5 This variation is apparent for coronary heart disease (CHD),5–8 stroke4 9 10 and, to a lesser extent, cancer.10 11 Previous attempts to quantify the impact of modifiable risk factors on these geographical variations have only been able to partially explain them,5 8 and have been restricted to individual cohorts that may not represent the experience of the whole population. It would be helpful to quantify the impact of behavioural risk factors on these geographical inequalities in order to prioritise public health interventions.
It is well established that a poor diet (ie, high in saturated fat and salt, and low in fibre, fruit and vegetables) is associated with increased risk of CHD, stroke and certain cancers, such as oesophageal, stomach and colorectal cancer.6 12 A number of reports have demonstrated consistent geographical differences in the nutritional qualities of national diets within the UK.13 14 It has been speculated that differences in dietary quality could be responsible for much of the differences in health experienced in the different countries of the UK, but no studies have so far attempted to quantify the full impact of diet on geographical health variations within the UK.15 16
A macrosimulation model (DIETRON) has been developed that quantifies the change in population mortality from CHD, stroke and 10 diet-related cancers that would be expected given a change in the average dietary quality within a population. Previous analysis using DIETRON suggested that 33 000 deaths would be delayed or averted per year in the UK if recommended dietary intakes for fats, fruit and vegetables, salt and fibre were achieved.17 The lowest potential reduction in estimated mortality occurred in England (13.8%) compared with Wales (15.0%), Scotland (18.3%) and Northern Ireland (18.9%), suggesting that health inequalities within the UK would be narrowed if dietary quality were standardised. In this paper, we use the DIETRON model to quantify how much of the CHD, stroke and cancer ‘mortality gap’ between England, Scotland, Wales and Northern Ireland would be closed if dietary quality were standardised to the current level achieved in England.
Methods
The DIETRON model17 was used to estimate the annual number of deaths from CHD, stroke and 10 diet-related cancers (mouth/larynx/pharynx, oesophagus, stomach, lung, colon, gallbladder, pancreas, breast, endometrial and kidney) that would be delayed or averted in Wales, Scotland and Northern Ireland if the nutritional quality of the average diets in these countries were equivalent to the average diet in England. The DIETRON model uses age- and gender-specific estimates of relative risks drawn from meta-analyses of trials, cohort studies and case–control studies.12 18–24 The model estimates a change in risk for an individual as a result of changes in dietary quality, and this change in risk is applied to a population to estimate the percentage difference in cause-specific mortalities that would be expected under the assumptions that (a) relative risks are combined multiplicatively, and (b) the relationship between the nutritional quality of a diet, risk factors and CHD, stroke and cancer follows a dose–response relationship. The DIETRON model used in this paper is a slight adaptation of the model described elsewhere17 in that a parameter has been included that models change in body weight as a result of changes in both energy intake and physical activity levels.25 A complete description of the DIETRON model, including the underlying assumptions, parameters used in the model and the supporting literature, is provided in the supplementary appendix.
Dietary data
The Family Food Survey (FFS) annual reports and datasets for 2007, 2008 and 2009 published by the UK Department for Environment, Food and Rural Affairs provided information regarding geographical variations in the energy and nutritional intake derived from household food and drink, and food and drink eaten outside of the home in England, Wales, Scotland and Northern Ireland. The FFS is a subset of the Family Expenditure Survey and estimates of food consumption and nutritional quality of diets are based on food purchases. The unit of data collection is the household, and hence estimates used in this analysis are for average household nutrient intake, adjusted for the size of the household. The nutrients and food components included as inputs in the DIETRON model are: total energy intake (kcal per day), fruit (g per week), vegetables excluding potatoes (g per week), salt (g per day), total fat (% energy), saturated fat (% energy), poly-unsaturated fat (% energy), mono-saturated fat (% energy), dietary cholesterol (% energy) and non-starch polysaccharide fibre (g per day). The DIETRON model requires an estimate of average trans fat consumption, which is not available from the FFS data. For these analyses, it was assumed that there was no variation in trans fat consumption between countries, and average consumption was assumed to be 1.4 g per day, which is the estimated level of consumption in the 2008/2009 National Diet and Nutrition Survey (NDNS).26
Mortality data
Mortality data for CHD (ICD-10: I20–25), stroke (ICD-10: I60–69) and diet-related cancers (ICD-10: C00–14, C15, C16, C18–20, C23, C25, C33–34, C50, C54–55 and C64), stratified by gender and 5-year age band, were acquired from the Office for National Statistics for England and Wales, the General Register Office for Scotland and the Northern Ireland Statistics and Research Agency for 2007, 2008 and 2009. Age- and gender-stratified population data for the same years were supplied by the same sources.
Analysis
The ‘mortality gap’ between England, Wales, Scotland and Northern Ireland was defined as the difference between the actual annual number of deaths in Wales, Scotland and Northern Ireland and the annual number of deaths that would be expected in each country if they achieved English age-, gender- and cause-specific mortality rates. For example, in Scotland in 2007 there were 850 deaths from CHD in women aged 80–84. However, if the English 2007 CHD mortality rate for women aged 80–84 were applied to the Scottish population, then there would be only 678 deaths in this age–sex group. Therefore, the 2007 ‘mortality gap’ between Scotland and England for CHD in women aged 80–84 was 172 deaths.
Estimates of dietary quality and age-, gender- and cause-specific number of deaths for Wales, Scotland and Northern Ireland were used as baseline inputs for the DIETRON model. Estimates of dietary quality for England were used as the counterfactual input for DIETRON. The output of the model was the annual number of deaths delayed or averted in Wales, Scotland and Northern Ireland under the counterfactual scenario of achieving a dietary quality equivalent to that in England. The estimated number of deaths delayed or averted for each country was used as a numerator to calculate the percentage of the mortality gap closed for each country under the hypothetical counterfactual scenario of achieving a diet equivalent to that in England.
Uncertainty analysis
A Monte Carlo simulation was performed to estimate 95% credible intervals around the results. These credible intervals are based on the 2.5th and 97.5th percentiles of results generated from 5000 iterations of the DIETRON models, where the estimates of relative risks used to parameterise the model were allowed to vary stochastically according to the distributions reported in the literature. For example, the DIETRON model uses a relative risk of 0.81 for CHD mortality for every 10 g/d increase in fibre intake. This parameter is taken from a meta-analysis of 10 cohort studies adjusted for age, energy intake, smoking status, body mass index, physical activity, education, alcohol intake, multiple vitamin use, raised cholesterol, raised blood pressure and dietary saturated fat, polyunsaturated fat and cholesterol.24 The meta-analysis reported confidence intervals which were used to estimate the log-normal distribution over which the actual relative risk is likely to lie. The DIETRON parameter for fibre-CHD was allowed to vary stochastically according to this log-normal distribution.
Results
National dietary variation
Table 1 shows the difference in dietary quality between England, Wales, Scotland and Northern Ireland in the years 2007, 2008 and 2009, and average estimated intakes from these 3 years. These data show that the populations of Scotland and Northern Ireland consume a poorer diet than that of England; for example, between 2007 and 2009 Northern Ireland consumed 4% more saturated fat and 7% more salt per day, and approximately 20% less fruit and vegetables per week than England. In contrast, the differences between the Welsh and English diets were small and not consistently unidirectional; for example, in 2008 and 2009 the average Welsh diet contained more vegetables than the average English diet, but also more saturated fat and salt.
Energy and nutrient intakes derived from food and drink by country (includes both household and purchases eaten outside the home)
Deaths from CHD, stroke and cancer delayed or averted
Table 2 shows the mortality gap for CHD, stroke and diet-related cancers in Wales, Scotland and Northern Ireland in comparison with England. Between 2007 and 2009, this was 3723 deaths for Wales, 15 719 deaths for Scotland and 2329 deaths for Northern Ireland.
Deaths from coronary heart disease (CHD), stroke and cancer delayed or averted and percentage of mortality gap closed as a result
The DIETRON model suggests that if Scotland had adopted a diet equivalent to the English diet between 2007 and 2009, 6353 (95% credible intervals (CI) 5217 to 7957) deaths from CHD, stroke and diet-related cancer would have been delayed or averted. This accounts for 40% (95% CI 33% to 51%) of the mortality gap for CHD, stroke and diet-related cancers between Scotland and England.
The modelled result of achieving the English diet was similar for Wales and Northern Ireland, and was substantially higher than the result for Scotland. For Wales, the mortality gap for CHD, stroke and diet-related cancer was reduced by 81% (95% CI 62% to 108%) in the counterfactual scenario, and for Northern Ireland the mortality gap was reduced by 81% (95% CI 67% to 99%).
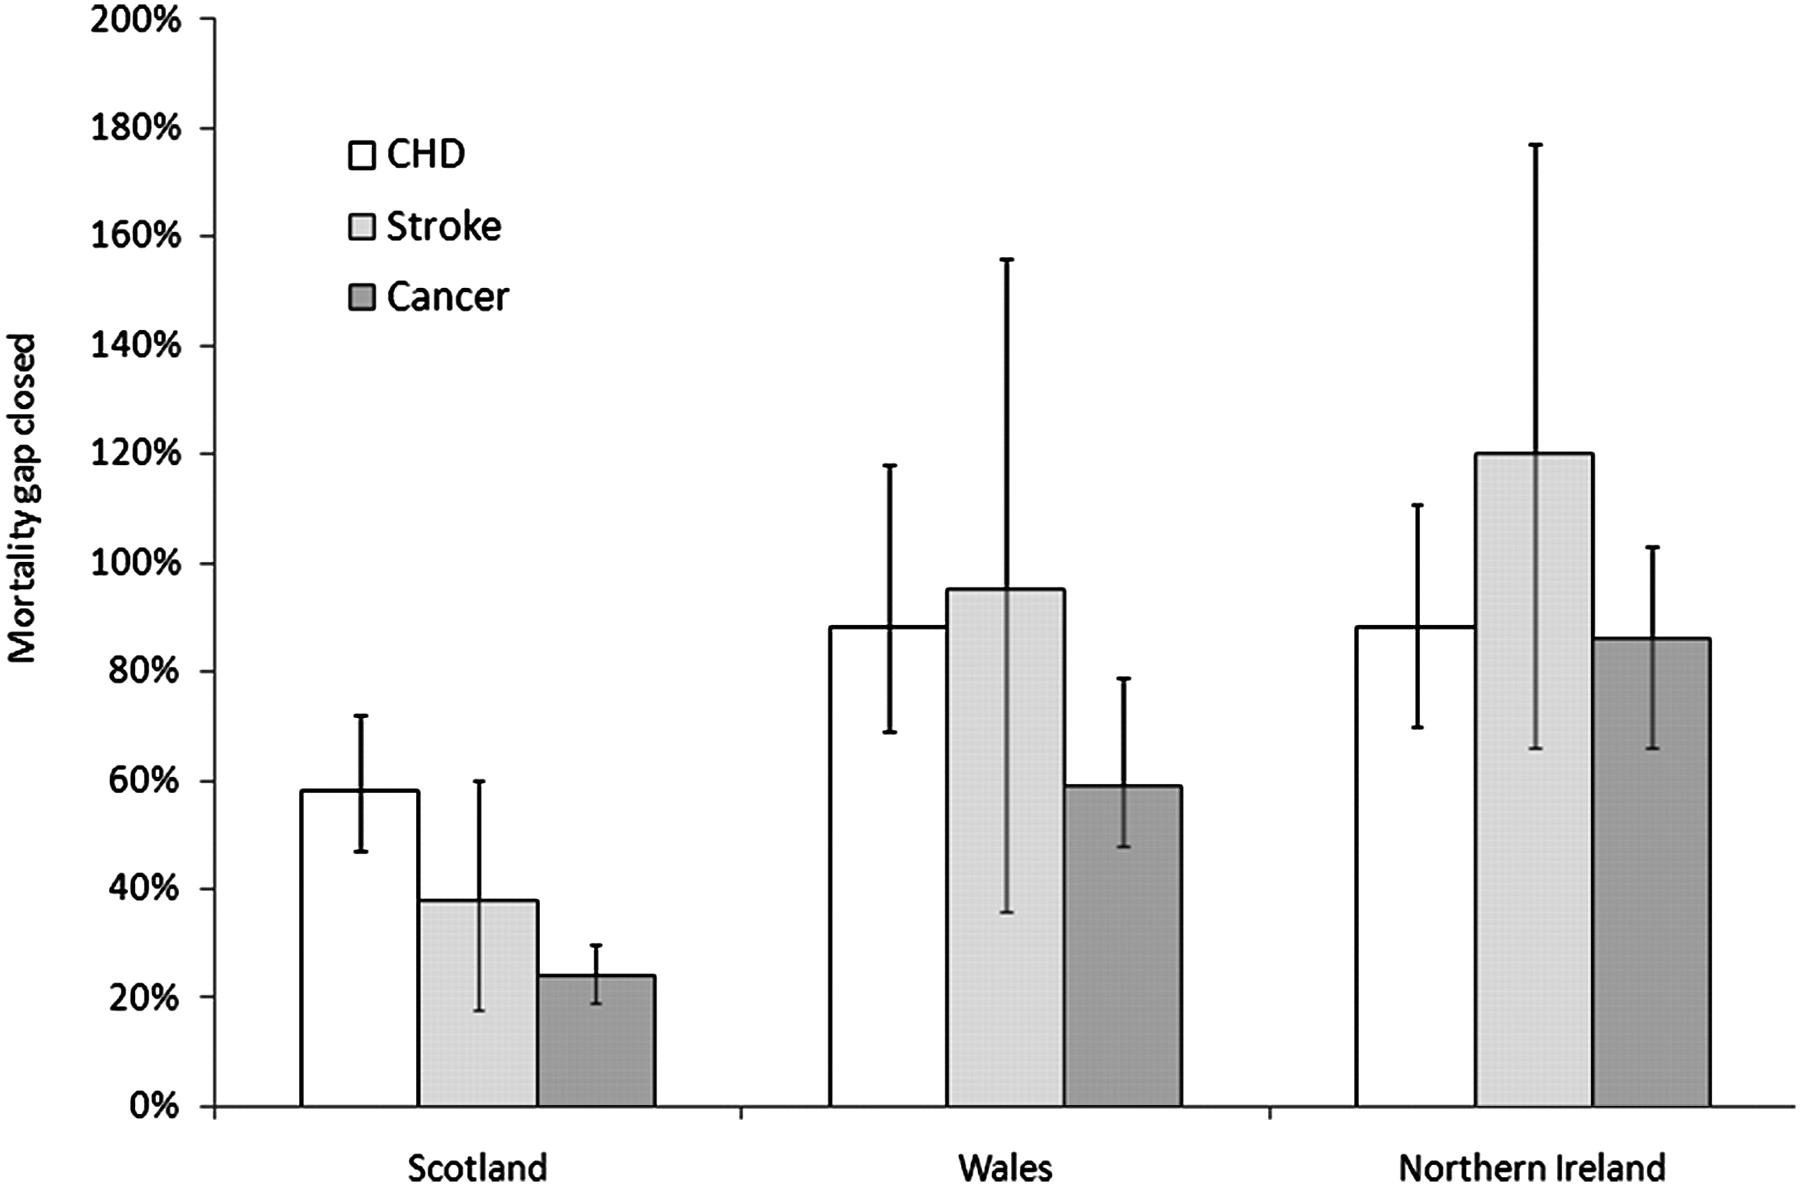
Figure 1 shows the percentage of the mortality gap closed under the counterfactual scenario for each country for CHD, stroke and diet-related cancers separately. In Scotland, the largest reduction in the mortality gap was for CHD (58% reduction; 95% CI 47% to 72%). For Wales, 88% (95% CI 69% to 118%) of the mortality gap for CHD was closed, and 88% (95% CI 70% to 111%) of the mortality gap for CHD in Northern Ireland was closed. In total, 6285 (95% CI 5034 to 7988) deaths from CHD, 2351 (95% CI 1080 to 3714) from stroke and 2612 (95% CI 2072 to 3302) from cancer were delayed or averted in the counterfactual scenario.

Reduction in mortality gap (mean and 95% credible intervals) for coronary heart disease (CHD), stroke and cancer in Scotland, Wales and Northern Ireland.
For Wales, Scotland and Northern Ireland, the dietary factors most associated with excess cardiovascular and cancer mortality are total energy intake and fruit and vegetable consumption.
Discussion
This study suggests four key findings. First, that diet has a substantial impact on geographical variations in mortality from CHD, stroke and various cancers within the UK. Second, that the differences in mortality from CHD, stroke and diet-related cancers within the UK are less affected by diet in Scotland compared with Wales and Northern Ireland. Third, that if Wales, Scotland and Northern Ireland adopted the English diet, the majority of deaths delayed or averted would be from CHD. And finally, that total energy intake and fruit and vegetable consumption are the principle dietary determinants of geographical variations in mortality. However, the results are based on modelling hypothetical scenarios and rely on observational data, which implies that residual confounding cannot be ruled out. With that caveat, these results suggest that relatively small (and achievable) improvements in the diet of Wales, Scotland and Northern Ireland could have a substantial impact on geographical variations in health within the UK. Identifying the specific dietary factors that produce the greatest reduction in health inequalities between countries may help to produce specific national level interventions. For example, the results suggest that fiscal initiatives aimed at increasing the cost of foods high in saturated fat (so called ‘fat taxes’) may be best placed to reduce geographical inequalities in health if they are paired with subsidies for fruit and vegetables. Previous modelling work has suggested that pairing fat taxes with subsidies for fruit and vegetables increases the effectiveness of fiscal initiatives.27 28
The main outcome of our analyses was the percentage of the mortality gap that would be closed if Wales, Scotland or Northern Ireland achieved a diet similar to that of England. This outcome is dependent upon two factors: the size of the existing mortality gap and the difference in dietary quality between the countries. Considering these two factors separately allows for a greater understanding of the results presented in this paper. The mortality gap between England and Wales is small (only 3723 deaths between 2007 and 2009, 9% of all CHD, stroke and diet-related cancer deaths in Wales in this period), and the difference in dietary quality between England and Wales is also small. In comparison, the random error associated with estimates of dietary quality in England and Wales is relatively large, which explains why the primary outcome ‘% mortality gap closed by diet’ is inconsistent in the 3 years studied, and why the credible intervals around the final estimate of 81% are wide. In comparison, the mortality gap between England and Northern Ireland is wider (13% of all CHD, stroke and diet-related cancer deaths) and the difference in dietary quality is also wider. Therefore, the random error associated with the estimates of dietary quality is relatively smaller, and the estimates of ‘% mortality gap closed by diet’ are consistent in 2007, 2008 and 2009, and credible intervals are narrower. The difference in dietary quality between England and Scotland is of comparable size to the difference between England and Northern Ireland, but the mortality gap is much wider (22% of all CHD, stroke and diet-related cancer deaths). As such, the ‘% mortality gap closed by diet’ is much smaller (40%), but the results are consistent in 2007, 2008 and 2009 and credible intervals are narrow.
Comparison with other studies
A number of well established cohort studies have been published showing that established risk factors such as systolic blood pressure and smoking account for a significant proportion of geographical inequalities in cardiovascular disease within the UK.4 5 8 12 29 However, these cohort studies do not directly address the impact of diet on geographical variation. For example, the British Regional Heart Study (a cohort of over 7000 men between 40 and 59 years of age recruited in 1978–80) found that variation in systolic blood pressure explained 27% of geographical variation in CHD incidence in Great Britain, body mass index explained 6%, and serum cholesterol levels had no affect.5 12 29 Although not all of the variations in blood pressure, body mass index and serum cholesterol are due to dietary factors, the results reported in this paper are broadly in agreement, that is, they suggest that variation in saturated fat consumption has very little impact on variation in mortality rates, whereas variations in salt and energy consumption have a substantial impact.
It is now well accepted that intrinsic, albeit undetermined, risk factors are responsible for significant inequalities between Scotland and other countries such as England, referred to as the ‘Scottish effect’.5 30–33 This study adds to the conclusion that geographical variation in known cardiovascular risk factors only partially explains this effect. Our analysis suggests that adopting an English-equivalent diet in Scotland would reduce the mortality gap between these countries by less compared to either Wales or Northern Ireland.
The results of these analyses are dependent upon the estimates of dietary quality that were taken from the FFS. An alternative data source would have been the NDNS, which estimates dietary quality for individuals using a weighed food diary. There were a number of reasons why we chose not to use the NDNS in this analysis. First, the most recent estimates for adult consumption data from the NDNS were published in 2000/2001. Although additional NDNS data were published in 2009,26 this represented only a single year of data collection from a 3-year rolling programme and estimates from the full sample are not available until 2012. Second, the ‘adult’ NDNS survey does not include adults above 64 years of age, the age group in whom the majority of cardiovascular and cancer incidents occur. And third, the NDNS is limited to Great Britain (ie, England, Scotland and Wales). Nevertheless, given these limitations the results of the 2000/2001 NDNS are generally supportive of the dietary trends shown in the FFS; for example, NDNS shows that diets in Scotland are of poorer quality than in England and Wales in terms of salt, fat content, dietary cholesterol, and fruit and vegetable consumption.13
Strengths and limitations of the study
Cardiovascular disease and cancer are the most common causes of mortality in the UK.34 This study attempts to estimate the impact of dietary intake on these wide-reaching conditions. We illustrate that the majority of deaths delayed or averted if the English diet were adopted throughout the UK would occur in CHD, which provides a platform from which to potentially direct public health policy. The results that are reported here are based on a diet that has already been obtained in England, and is therefore realistically achievable by other nations. Wherever possible, the DIETRON model is based on estimates of relative risk that have been adjusted for non-dietary behavioural risk factors (eg, smoking and alcohol consumption),17 and hence the outcomes reported here are likely to be primarily due to diet rather than confounding by other socially patterned behaviours. However, the DIETRON model is based on a synthesis of results mainly from observational studies, so residual confounding cannot be ruled out.
The uncertainty analysis that was used to generate the credible intervals for this paper was based on 5000 iterations of the DIETRON model, allowing the relative risks derived from the literature to vary stochastically according to their reported distribution. This uncertainty analysis incorporates the degree of uncertainty generated by the DIETRON model, but does not account for the uncertainty associated with the estimates of dietary quality generated by the FFS. Therefore, the credible intervals developed for this paper are under-estimates of the true uncertainty of the results reported here.
Further work and unanswered questions
The results reported here show the effect of diet on geographical variations in health within the constituent countries of the UK. To be a true guide for policymakers, these results should be compared with equivalent estimates of the impact of other behavioural risk factors (smoking, alcohol consumption and physical inactivity). This would provide a comparable set of estimates of the likely impact of successful public health interventions on reducing inequalities. These modelled results should be supported by evidence of the effectiveness and cost-effectiveness of interventions to increase healthy life styles in order to provide policy makers with the evidence to make informed decisions.
References
Supplementary materials
Supplementary Data
This web only file has been produced by the BMJ Publishing Group from an electronic file supplied by the author(s) and has not been edited for content.
Files in this Data Supplement:
- Data Supplement - Manuscript file of format pdf
- Data Supplement - Manuscript file of format pdf
- Data Supplement - Manuscript file of format pdf
- Data Supplement - Manuscript file of format pdf
- Data Supplement - Manuscript file of format pdf
- Data Supplement - Manuscript file of format pdf
- Data Supplement - Manuscript file of format pdf
Footnotes
To cite: Scarborough P, Morgan RD, Webster P, et al. Differences in coronary heart disease, stroke and cancer mortality rates between England, Wales, Scotland and Northern Ireland: the role of diet and nutrition. BMJ Open 2011;1:e000263. doi: 10.1136/bmjopen-2011-000263
Funding This work was supported by the British Heart Foundation (grant numbers PPC/Jul05/5b and PPC/JAN05/6biii).
Competing interests None.
Contributors PS contributed to study conception, analysis design, acquisition of data, interpretation of results, drafting of the manuscript, and final approval of the manuscript. RM contributed to acquisition of data, analysis, interpretation of results, drafting of the manuscript, and final approval of the manuscript. PW contributed to study conception, interpretation of results, drafting of the manuscript, and final approval of the manuscript. MR contributed to study conception, interpretation of results, drafting of the manuscript, and final approval of the manuscript.
Provenance and peer review Not commissioned; externally peer reviewed.
Data sharing statement No additional data are available.