Article Text

Abstract
Objectives To determine the contribution of progress in averting premature deaths to the increase in life expectancy and the decline in lifespan variation.
Design International comparison of national life table data from the Human Mortality Database.
Setting 40 developed countries and regions, 1840–2009.
Population Men and women of all ages.
Main outcome measure We use two summary measures of mortality: life expectancy and life disparity. Life disparity is a measure of how much lifespans differ among individuals. We define a death as premature if postponing it to a later age would decrease life disparity.
Results In 89 of the 170 years from 1840 to 2009, the country with the highest male life expectancy also had the lowest male life disparity. This was true in 86 years for female life expectancy and disparity. In all years, the top several life expectancy leaders were also the top life disparity leaders. Although only 38% of deaths were premature, fully 84% of the increase in life expectancy resulted from averting premature deaths. The reduction in life disparity resulted from reductions in early-life disparity, that is, disparity caused by premature deaths; late-life disparity levels remained roughly constant.
Conclusions The countries that have been the most successful in averting premature deaths have consistently been the life expectancy leaders. Greater longevity and greater equality of individuals' lifespans are not incompatible goals. Countries can achieve both by reducing premature deaths.
This is an open-access article distributed under the terms of the Creative Commons Attribution Non-commercial License, which permits use, distribution, and reproduction in any medium, provided the original work is properly cited, the use is non commercial and is otherwise in compliance with the license. See: http://creativecommons.org/licenses/by-nc/2.0/ and http://creativecommons.org/licenses/by-nc/2.0/legalcode.
Statistics from Altmetric.com
Article summary
Article focus
We examined the relationship between high life expectancy and low life disparity.
We determined the relative importance of premature versus late deaths in increasing life expectancy and reducing life disparity.
We examined whether policies to increase life expectancy were compatible with those to reduce lifespan variation.
Key messages
Most of the gains in life expectancy are the result of reducing disparities in how long people live, by averting premature mortality.
Progress in reducing death rates for people who live longer than average has had little effect on life disparity levels and has contributed only modestly to life expectancy gains.
The countries that have been most successful at reducing premature mortality enjoy the highest life expectancies and the greatest equality in individuals' lifespans.
Strengths and limitations
We are the first to examine this issue using a large, comparable database of 40 developed countries from 1840 to 2009 containing 7056 life tables.
Our analysis was limited to countries with data of high enough quality to be included in the database.
Although this database contains high mortality life tables from historic populations, it is unknown whether the patterns we observed would also be seen in contemporary emerging and developing countries.
Introduction
The increase in life expectancy, from under 40 years in all areas of the world two centuries ago to over 80 years today in many developed countries, has fundamentally improved the human condition.1 2 Equally significant and closely linked to the increase in life expectancy has been the reduction in differences among individuals in the age at death.3–6 Even in the most egalitarian societies before the mid-19th century, the fate of most newborns was to die young, although a fortunate minority survived to old age. Death rates today in health leaders such as Japan, Spain and Sweden, imply that three-quarters of babies will survive to celebrate their 75th birthdays.2
The negative correlation between high life expectancy and low lifespan variation has been investigated for several countries, including the USA,4–6 7 England and Wales,7 Sweden6 and Japan.6 The correlation is strong, but there are discrepancies. Some countries, notably the USA, have substantially greater lifespan disparity than might be predicted from their high levels of life expectancy.3–5
Progress in reducing premature deaths reduces variation in lifespans, whereas progress in reducing deaths at older ages increases variation in lifespans. A recently-developed demographic formula permits ready determination of the ages at which deaths are premature.8 We use this new formula and apply it to a large dataset on developed countries to gain a deeper understanding of the relationship between high life expectancy and low lifespan variation. We find that the countries that have been the most successful in reducing premature deaths, and consequently in reducing lifespan variation, have consistently been the life expectancy leaders.
Methods
Our calculations are based on all period life tables of the Human Mortality Database (HMD) from 1840 to the most recent year available in the data set (7056 life tables covering 170 years).2 This is a freely available database with reliable, comparable data covering 40 countries and areas (online supplementary table 1 lists the countries or regions and years used in the analysis).
We measure dispersion in age-at-death by the life disparity measure, e† (a technical description is given in the online supplementary appendix).8 9 Life disparity is defined as the average remaining life expectancy at the ages when death occurs; it is a measure of life years lost due to death. The more egalitarian the lifespan distribution is, the lower the life disparity. In the Swedish female life table for 2008, life expectancy reached 83 years; for those women who survived to age 83, remaining life expectancy was 7.5 additional years. Hence, a death shortly after birth would contribute 83 years, whereas a death at age 83 would contribute 7.5 years. The average of such values over the Swedish female population, weighted by the number of deaths at each age, gives a life disparity of 9. In 1840, life expectancy for Swedish women was only 46 and life disparity was 24. Over time, as deaths became concentrated at later ages, the average gap was reduced between the age at which a person died and the remaining lifespans of people who survived beyond this age.
Saving lives (ie, averting deaths) at any age increases life expectancy. Lifespan disparity, on the other hand, narrows or widens depending on the balance between saving lives at ‘early’ ages, which compresses the distribution of lifespans, and saving lives at ‘late’ ages, which expands this distribution by increasing the average remaining life expectancy of survivors. Separating the two is a unique threshold age, a†, which is generally just below life expectancy. Henceforth, we refer to deaths occurring before the threshold age as ‘premature deaths’, while those occurring after this age are ‘late deaths’. Thus ‘premature deaths’ according to our definition are defined relative to the mortality level of the population. This is in contrast to other definitions which use a fixed age, for example, age 65; use of a fixed age is problematic over long periods of time. This new definition implies that deaths at surprisingly old ages can be premature deaths. In 2008 deaths up to age 82 were premature deaths for Swedish females (table 1).
Countries and regions in the Human Mortality Database2 used in our analysis, ranked by female life expectancy for the latest year available
The life disparity measure has the property that it can be additively decomposed at any age such that the components before and after this age sum to the total life disparity.8 When it is decomposed at the threshold age, the components are defined as ‘early-life disparity’ and ‘late-life disparity’.
While it is known that high life expectancy is associated with low lifespan variation, we wanted to establish whether life expectancy leaders had the most egalitarian lifespan distributions. For each sex, year, and for up to 40 countries depending on the year, we determined the male and female record high life expectancy and record low life disparity. We calculated how many fewer years of life expectancy and additional years of life disparity each country experienced compared with the record-holding country in that year.
We next investigated the relative importance of premature versus late deaths in determining the relationship between high life expectancy and low life disparity. To do so, we calculated first the number of premature and late deaths as a proportion of all deaths, measured by 10-year averages across all countries and years. We then compared this to the respective contributions of averting premature and late deaths to increases in life expectancy,8 9 using a 20-year moving average to smooth mortality trends over exceptional years of war, pandemics or famine (see the online supplementary appendix for a technical description).
Finally, we ranked countries according to their life expectancy and life disparity for the latest year for which we had data.
Results
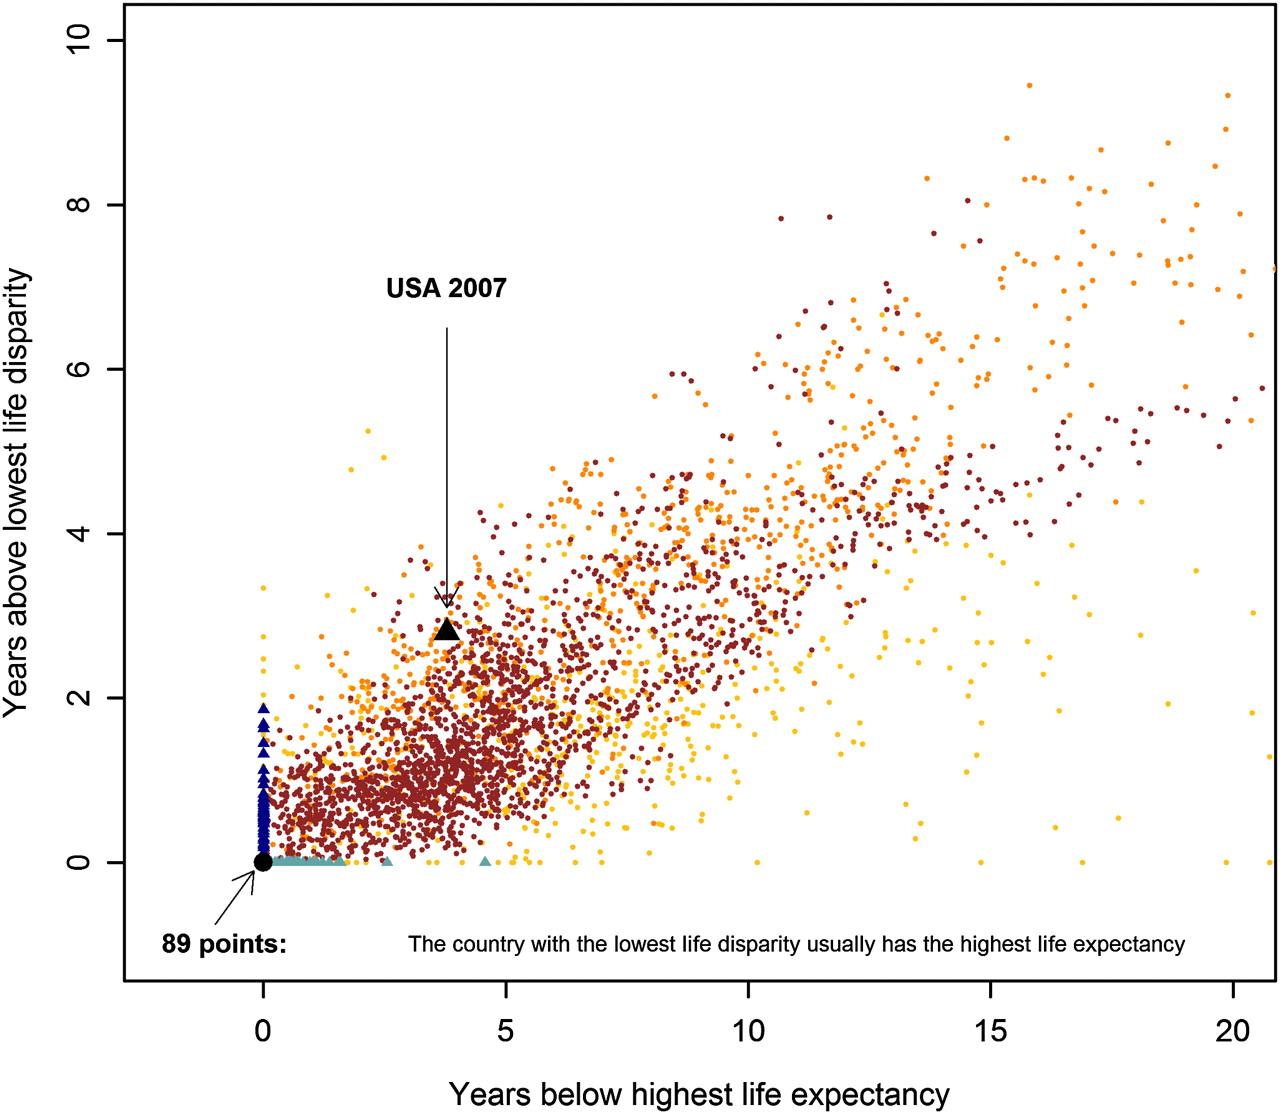
Populations with high life expectancy enjoy low life disparity. In 89 out of 170 years, holders of record life expectancy for males also enjoyed the lowest life disparity (figure 1). For females this happened 86 times (see online supplementary figure 1). More generally, the country with record life expectancy usually had an exceptionally low life disparity and vice versa. This is remarkable because life expectancy is a measure of the average length of life and life disparity is a measure of variation among individuals in the length of life. In principle, the two measures could be unrelated to each other. The set of countries with the highest life expectancies could be completely different from the set of countries with the lowest life disparities, but it turns out that the two sets largely overlap.

The association between life disparity in a specific year and life expectancy in that year for males in 40 countries and regions, 1840–2009 (see online supplementary table 1). The correlation coefficient between them is 0.77 (95% CI 0.76 to 0.78). The black triangle represents the USA in 2007; the USA had a male life expectancy 3.78 years lower than the international record in 2007 and a life disparity 2.8 years greater. The brown points denote years after 1950, the orange points 1900–1949 and the yellow points 1840–1900. The light blue triangles represent countries with the lowest life disparity but with a life expectancy below the international record in the specific year; the dark blue triangles indicate the life expectancy leaders in a given year, with life disparities greater than the most egalitarian country in that year. The black point at (0,0) marks countries with the lowest life disparity and the highest life expectancy. During the 170 years from 1840 to 2009, 89 holders of record life expectancy also enjoyed the lowest life disparity. The equivalent figure for females is presented in online supplementary figure 2.
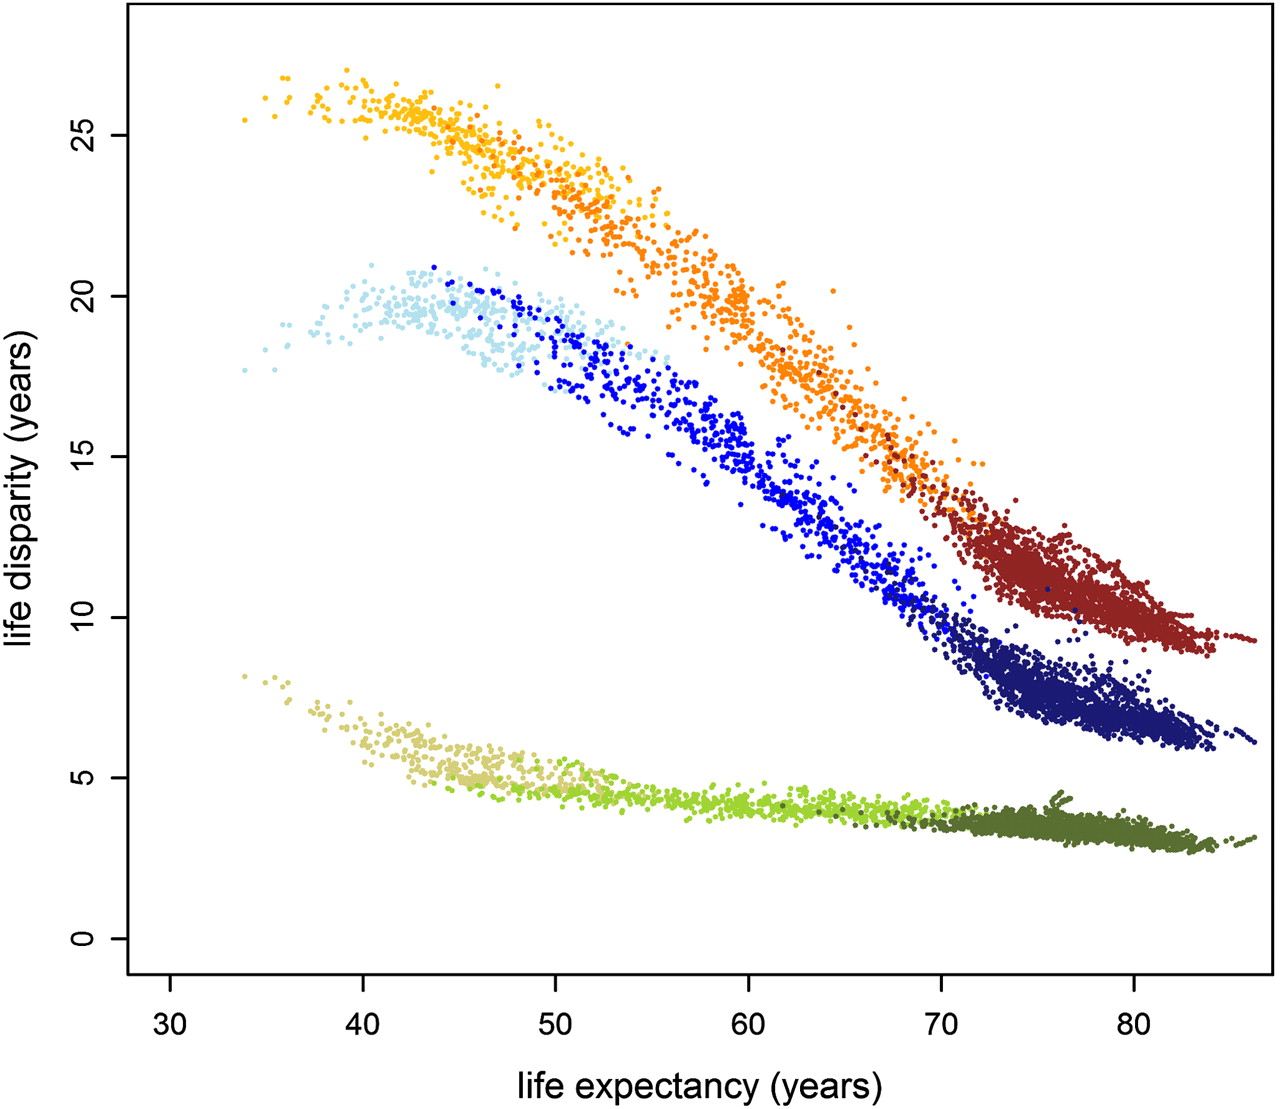
The most successful countries increased life expectancy not because of a general decrease in mortality at all ages, but because of a decrease in premature mortality. Figure 2 shows that the reduction in life disparity—from around 25 years in 1840 to between 9 and 15 years at present—is overwhelmingly due to reductions in early-life disparity caused by tackling premature mortality. Although mortality rates at old ages have come down considerably (which might cause one to expect increases in late-life disparity), the shifting of the threshold age to higher ages has caused late-life disparity to stay roughly constant at around or just under 5 years.

The relationship between total life disparity (red), early-life disparity up to the threshold age (blue) and late-life disparity after the threshold age (green). The darkest hues relate to data from 1950–2009, middle hues 1900–1949 and lightest hues 1840–1899. Total disparity is an additive function of early-life disparity and late-life disparity. Since 1840 the decrease in total life disparity has resulted from reductions in early-life disparity. The correlation coefficient between early-life disparity and total life disparity is 0.997 (95% CI 0.997 to 0.997). Late-life disparity has remained remarkably constant at about 5 years across a wide range of life expectancies. Hence, according to this measure, there has been neither a marked compression nor expansion of mortality at advanced ages as life expectancy has increased. Data are for females from the 40 countries and regions of the Human Mortality Database (see online supplementary table 1).
For females since 1840, premature deaths have accounted for only 38% of all deaths, but fully 84% of the increase in life expectancy resulted from decreases in premature deaths (see online supplementary figure 2). During this time the threshold age rose considerably, rising from 47 for Swedish women in 1840 to 85 for Japanese women in 2009. Historically (and today in less developed countries), infants, children and younger adults suffered most premature deaths. In today's more developed countries, premature deaths have shifted primarily to older adults in their 60s and 70s. The rise in the threshold age is highly correlated with the rise in life expectancy: the correlation coefficient is 0.96 for males and 0.98 for females.
Table 1 displays the latest life expectancy, threshold age and life disparity calculated for each country. In Russia, life expectancy is extraordinarily low and life disparity is very high. In the USA, life expectancy is much greater than in Russia but short compared to other highly developed countries. Females in most Eastern European countries, and males in some of them, do better than the USA in life disparity and hence face more certainty in their lifetimes. In contrast, Japanese females are remarkably successful. They hold the record for life expectancy, 86.4 years in the life table for 2009. Half of deaths occurred after age 88 and the most common age of death was 93: deaths up to age 85 were premature in the sense that averting such deaths would decrease life disparity.
Discussion
These findings make clear that the correlation between high life expectancy and low lifespan variation is due to progress in reducing premature mortality. The countries that have the highest life expectancy today are those which have been most successful at postponing the premature deaths that contribute to early-life disparity.
In addition to life disparity, several other measures of lifespan dispersion have been proposed.3 4 6 10 We analysed the extent to which our findings depend on our use of life disparity as our measure of lifespan variation. We calculated Pearson correlation coefficients between pairs of the more commonly used measures of lifespan variation, based on all male and female period life tables available from the Human Mortality Database (see online supplementary table 1). As shown in online supplementary table 2, these measures are highly correlated with each other. In particular, the correlation of life disparity with the other measures never falls below 0.966 for females and 0.940 for males. Hence, life disparity can be viewed as a surrogate for the other measures. Although the various measures are highly correlated, they differ somewhat in their sensitivity to deaths at different ages in the lifespan distribution.4 11 The use of an alternate measure of lifespan variation would result in some changes in the ranking of countries with similar life disparity levels, but the high correlation between measures implies that such changes would be minor.
Some researchers have examined whether lifespan variation above the adult modal age at death has changed with increased survivorship. These studies also tend to find a gradual decline in later life mortality variation.10 12–14 Exploring the relationship between life disparity and compression around the modal age at death is a promising avenue for further research. More generally, whether expansion or compression of the lifespan distribution is observed over time can depend on the age range examined.15–17 While being a life expectancy leader is associated with low life disparity when the entire lifetime is examined, this relationship might not hold for selected age ranges.
Reducing early-life disparities helps people plan their less-uncertain lifetimes. A higher likelihood of surviving to old age makes savings more worthwhile, raises the value of individual and public investments in education and training, and increases the prevalence of long-term relationships. Hence, healthy longevity is a prime driver of a country's wealth and well-being.18 While some degree of income inequality might create incentives to work harder, premature deaths bring little benefit and impose major costs.19
Moreover, equity in the capability to maintain good health is central to any larger concept of societal justice.20 The tenet that everyone should be entitled to a long, healthy lifespan has gained support as mortality at younger ages has declined. Currently, rates of change for adult mortality vary more across countries than those for infants and children.21 In Williams' concept of “fair innings”,22 individuals dying early are “cheated”, while those living beyond a “normal” lifespan are “living on borrowed time”. Groups and areas with lower socioeconomic status account for a disproportionate share of lifespan variation,3 4 7 which compounds the inequity of premature death.
If death rates continue to decline, most babies born in advanced nations today may live to enjoy their 100th birthday.23 As we celebrate this progress in extending lives, it is reasonable to question whether we ought to continue aiming for ever longer lives on average or should ensure that more individuals avoid premature death. Policymakers face a choice of where to target healthcare spending. Reducing life disparity would lead to health policies that prioritise early mortality and to social protection schemes designed to shield vulnerable individuals and groups. We are not the first to make this argument. Heath poignantly reasoned that if healthcare services were serious about reducing health inequality, they should direct their attentions to reducing premature mortality—even if this meant reducing expensive medical treatments for the elderly.24 The accompanying editorial in BMJ proclaimed that “premature deaths should be the priority for prevention”.25
Russia, the USA and other laggards can learn much from research on the reasons why various countries (including Japan, France, Italy, Spain, Sweden and Switzerland) have been more successful in reducing premature deaths. The reasons involve healthcare, social policies, personal behaviour (especially cigarette smoking and alcohol abuse), and the safety and salubriousness of the environment.26–33 Genetic variation plays a modest role in determining variation in how long we live34 35 and cannot account for the major declines in life disparity and increases in life expectancy or the large differences in life expectancy and disparity among countries.
Smits and Monden5 recently showed that countries achieving some level of life expectancy earlier than others did so with higher levels of lifespan variation. This led them to conclude that “reducing inequality and gaining increases in life expectancy might be alternative goals that require different policy measures to be achieved”. Our results differ because we examine differences between countries in lifespan variation for each year, whereas they examine differences over time in lifespan variation within each country. These different set-ups can lead to different conclusions. In a study comparing the USA to England and Wales, reductions in circulatory diseases were causing most of the changes in lifespan variation over time (in each country), whereas differences in external mortality explained much of the difference in life disparity between countries at any given time.7 As can be seen in figure 3, the relationship between being pioneers in life expectancy and having high life disparity is weak, especially after 1960. We take issue with Smits and Monden's conclusion, which our cross-sectional results do not support. Over the past 170 years, the country with the lowest life disparity most often had the highest life expectancy. Even today, the most egalitarian countries are all among the longest living.

The relationship between remaining life expectancy at age 15 (e15) and life disparity at age 15, according to the year in which e15 was first reached. Up until 1960 and for e15 from 54 to 59, the pioneers in first attaining a level of remaining life expectancy did so with higher levels of life disparity than the laggards. Since 1960 and at higher remaining life expectancies, the relationships between remaining life expectancy and life disparity at age 15 are not correlated. Ages 15 and over were examined to make the results comparable to those obtained by Smits and Monden.5 Data are for females from the 40 countries and regions in the Human Mortality Database (see supplementary online table 1)
The increase in life expectancy is given by the product of two factors—life disparity and the rate of progress in reducing age-specific death rates.9 The lower life disparity is, the greater is the rate of progress needed to achieve an additional year of life expectancy. Consequently, it might be thought that countries would aim for life expectancy increases by maintaining high levels of inequality in the lifespan distribution. The opposite is true (figure 1). The reason is that the countries with long life expectancy have gained this victory by focusing on reductions in premature deaths—and reductions in premature deaths reduce life disparity. It is not a question of either long life or low disparity: countries can achieve both by averting premature deaths.
Acknowledgments
We thank A Baudisch, JR Goldstein, E Loichinger, J Oeppen, VM Shkolnikov, KW Wachter and H Wilkoszewski for helpful comments. We are grateful to V Canudas-Romo, A Leyland and M Murphy for reviewing the paper.
References
Supplementary materials
Supplementary Data
This web only file has been produced by the BMJ Publishing Group from an electronic file supplied by the author(s) and has not been edited for content.
Files in this Data Supplement:
- Data Supplement - Manuscript file of format pdf
- Data Supplement - Manuscript file of format pdf
Footnotes
To cite: Vaupel JW, Zhang Z, van Raalte AA. Life expectancy and disparity: an international comparison of life table data. BMJ Open 2011;1:e000128. doi:10.1136/bmjopen-2011-000128
Funding This work was supported by the Max Planck Society and the US National Institute on Ageing (NIA P01-08761).
Competing interests None.
Contributors JWV conceived the research idea and co-wrote the drafts, ZZ managed the data analysis and commented on the drafts, and AAvR contributed to data analysis and co-wrote the drafts. All authors approved the final manuscript.
Provenance and peer review Not commissioned; externally peer reviewed.
Data sharing statement Data from the Human Mortality Database are freely available at http://www.mortality.org.