Article Text

Abstract
Objective To study the relationship between body mass index (BMI) and mortality among 75-year-olds with and without diabetes mellitus type 2 (DM) or impaired fasting glucose (IFG).
Design Prospective population-based cohort study with a 10-year follow-up.
Participants A random sample of 618 of the 1100 inhabitants born in 1922 and living in the city of Västerås in 1997 were invited to participate in a cardiovascular health survey; 70% of those invited agreed to participate (432 individuals: 210 men, 222 women).
Outcome measures All-cause and cardiovascular mortality.
Results 163 of 432 (38%) participants died during the 10-year follow-up period. The prevalence of DM or IFG was 41% (35% among survivors, 48% among non-survivors). The prevalence of obesity/overweight/normal weight/underweight according to WHO definitions was 12/45/42/1% (14/43/42/1% among survivors, 9/47/42/2% among non-survivors). The hazard rate for death decreased by 10% for every kg/m2 increase in BMI in individuals with DM/IFG (HR 0.91, 95% CI 0.86 to 0.97; p=0.003). After adjustment for sex, current smoking, diagnosed hypertension, diagnosed angina pectoris, previous myocardial infarction and previous stroke/transient ischaemic attack, the corresponding decrease in mortality was 9% (HR 0.92, 95% CI 0.86 to 0.99; p=0.017). These findings remained after exclusion of individuals with BMI<20 or those who died within 2-year follow-up. In individuals without DM/IFG, BMI had no effect on mortality (HR 1.01, 95% CI 0.95 to 1.07; p=0.811). The HR for BMI differed significantly between individuals with and without DM/IFG (p interaction=0.025). The increased all-cause mortality in individuals with DM/IFG in combination with lower BMI was driven by cardiovascular death.
Conclusion High all-cause and cardiovascular mortality was associated with lower BMI in 75-year-olds with DM/IFG but not in those without DM/IFG. Further studies on the combined effect of obesity/overweight and DM/IFG are needed in order to assess the appropriateness of current guideline recommendations for weight reduction in older people with DM/IFG.
- BMI
- cardiovascular diseases
- elderly
- fasting glucose
- mortality
- obesity paradox
- epidemiology
- Computers
- meta-analysis
- statistics
- BMJ open
This is an open-access article distributed under the terms of the Creative Commons Attribution Non-commercial License, which permits use, distribution, and reproduction in any medium, provided the original work is properly cited, the use is non commercial and is otherwise in compliance with the license. See: http://creativecommons.org/licenses/by-nc/2.0/ and http://creativecommons.org/licenses/by-nc/2.0/legalcode.
Statistics from Altmetric.com
- BMI
- cardiovascular diseases
- elderly
- fasting glucose
- mortality
- obesity paradox
- epidemiology
- Computers
- meta-analysis
- statistics
- BMJ open
Article summary
Article focus
To explore the combined effect of hyperglycaemia and body mass index (BMI) on all-cause and cardiovascular mortality in the elderly.
Key messages
There was a significant inverse relationship in 75-year-olds with type 2 diabetes mellitus (DM) or impaired fasting glucose (IFG) between BMI and rate of all-cause and cardiovascular mortality.
An obesity paradox or reverse epidemiology was found in 75-year-olds with DM or IFG.
Further studies on the combined effect of obesity/overweight and DM/IFG are needed in order to assess current guidelines for weight reduction in older people with DM/IFG.
Strengths and limitations of this study
Restricting our investigation to one age group enabled us to omit age as a confounding factor, allowing meaningful estimation of the relationship between all-cause and cardiovascular mortality and BMI in individuals with and without hyperglycaemia, despite the relatively small number of study participants. Furthermore, because of the high participation rate, the participants are more representative of the population in a defined geographical area than described in most other studies on this topic. These advantages are, however, offset by difficulty in generalising our findings to those in other age groups and from other geographical areas. Nevertheless, it seems likely that our results are applicable to Northern Europeans and white North Americans in their seventies.
A further limitation of the study is the fact that mortality among invited individuals who did not participate in the study (30%) was considerably higher than among those who participated (70%), mainly reflecting a higher prevalence of diseases under treatment among non-participants.
Introduction
Obesity and overweight are well-known risk factors for increased mortality. Thus, a large collaborative analysis1 of baseline body mass index (BMI) versus overall mortality in 57 prospective studies with 894 576 participants (mean (SD) recruitment age 46 (11) years) provides overwhelming evidence that overweight and obesity, as reflected by BMI, are strong predictors of all-cause mortality in the general population. This excess mortality is mainly driven by an excess of cardiovascular death.
Similarly, observational studies indicate that diabetes mellitus type 2 (DM) and impaired fasting glucose (IFG) play an important role in atherosclerotic cardiovascular morbidity and mortality as well as in all-cause mortality.2–6 IFG refers to a condition in which fasting glucose levels are elevated above normal values but are not high enough to be classified as diabetes mellitus.7 IFG is a prediabetic state8 and a risk factor for cardiovascular and all-cause mortality.9 DM and IFG are caused—or at least aggravated—by obesity.5
The association between obesity and mortality weakens10–12 among the elderly and even disappears13 14 among individuals above 80 years of age. Among elderly (≥65 years) non-institutionalised relatively healthy adults, Heiat et al15 found a U-shaped relationship between BMI and both all-cause and cardiovascular mortality with a long flat region between BMI 20 and BMI 31. Similarly, the hazard ratio for the mortality rate between diabetic compared with non-diabetic subjects decreases among the elderly.16 17
In certain chronic diseases, especially among older people, an ‘obesity paradox’ or reversed epidemiology has been observed18–22 implying a paradoxically decreased mortality and morbidity in association with increasing BMI up to and including obesity. Better survival among overweight/obese individuals is ‘paradoxical’ from a primary prevention perspective in view of the large body of evidence that obesity confers an increased mortality risk.1 To our knowledge, the obesity paradox has not been reported among individuals with DM/IFG.
The purpose of this study is to explore the combined effect of BMI and DM/IFG on survival among 75-year-olds. The examined cohort, comprising both men and women, was randomly selected from the general population.
Methods
Study population
The city of Västerås (130 000 inhabitants) in central Sweden has a population considered socioeconomically representative of Sweden. In 1997 a random sample of 618 of the 1100 inhabitants born in 1922 (ie, 75 years old) were invited to take part in a cardiovascular health survey and 432 agreed to participate (70% of those invited; 222 women, 210 men). Reasons for non-participation of those invited were unknown (n=46), never reached (n=29), died before examination (n=2), language or logistical problems (n=27), locomotive impairment (n=28) or unwilling due to diseases under treatment (n=54).
The study was approved by the research ethics committee of Uppsala University, Sweden and was conducted in accordance with the Declaration of Helsinki. All study subjects gave their informed consent.
Baseline examination
Recorded information included history of cardiovascular and/or pulmonary diseases, hypertension, diabetes mellitus, ongoing medication, height, weight, waist circumference, heart rate, blood pressure and lifestyle habits such as self-reported smoking.
Venous blood was sampled in the morning with the subjects in a fasting state (≥12 h). The blood glucose samples were treated with a haemolytic reagent (Merck Diagnostica, Darmstadt, Germany) and glucose was determined enzymatically with glucose dehydrogenase using a Cobas Mira analyser (Roche Diagnostics, Rotkreuz, Switzerland). Fasting plasma glucose (FPG) was determined from venous whole blood glucose using the formula: FPG=0.558+1.119×whole blood fasting glucose.23
Known diabetes was defined as self-reported physician-diagnosed diabetes (confirmed from medical records by PH, one of the authors). Seven patients with known diabetes were on insulin treatment and 20 patients were on oral glucose lowering drug treatment. Newly detected diabetes was defined as FPG ≥7.0 mmol/l24 without previously known diabetes. According to the WHO recommendations,7 diabetes can be diagnosed for epidemiological purposes on the basis of only one fasting blood glucose value. IFG was defined according to WHO recommendations24 as FPG ≥6.1 mmol/l and <7.0 mmol/l without previously known diabetes.
BMI was calculated as weight in kilograms divided by the square of height in metres. BMI categories were defined according to the WHO recommendations25 (underweight <18.5, normal weight 18.5–24.9, overweight 25.0–29.9, obesity ≥30.0). Waist circumference was measured in the horizontal plane at the midpoint between the lowest rib and the iliac crest.
Information on previous myocardial infarction and stroke/transient ischaemic attack (TIA) was based on self-reported case history and verified by medical records. Hypertension was defined by self-reported physician-diagnosed high blood pressure in combination with regular blood pressure lowering treatment. Smoking status was classified as non-smoker, former smoker or current smoker.
Prospective follow-up
All-cause mortality served as the primary end-point. The study cohort was followed from the index examination in 1997 until 31 December 2007 or to the first primary end-point, resulting in a median follow-up of 10.6 years. Dates and reasons for death were obtained from the Swedish population register and the Swedish National Cause of Death register. No participants were lost to follow-up.
The registers were linked to the study participants via the unique personal identification number allocated to all Swedish citizens. The 10th revision of the International Statistical Classification of Diseases (ICD) was used to identify primary causes of death. For the present analyses, causes of death were grouped into two categories: cardiovascular (ICD-10: I 00–I 99) or non-cardiovascular comprising all other causes of death (confirmed by PH, one of the authors). The study was not powered to analyse more specific causes of death.
Statistical analysis
Continuous variables were summarised by means and SD or, in the case of skewed distributions, by medians and IQR. Categorical variables were summarised by numbers and proportions. The Student t test and Wilcoxon Mann–Whitney's rank sum test were used to compare continuous variables. In case of skewly distributed variables only the p value for the Wilcoxon Mann–Whitney's rank sum test is given. Categorical variables were compared using Fisher's exact test. The association between BMI and waist circumference was assessed using Pearson's correlation coefficient.
Crude and adjusted prospective associations between BMI, FPG and all-cause mortality were assessed by HRs and corresponding 95% CIs using uni- and multivariable Cox proportional hazards regression (PHREG) models. The interaction between BMI and FPG was explored by introducing the interaction term of these variables into a Cox PHREG model. For continuous variables, the assumption of proportional hazards was assessed by examining their interaction with time to death in the Cox PHREG models. The proportional hazard assumption for categorical variables was assessed by visual inspection of the log(−log(cumulative survival)). Cumulative survival was estimated by means of the Kaplan–Meier method.
A two-sided p value <0.05 was regarded as statistically significant in all analyses. SPSS v 15.0 was used.
Results
During a median follow-up of 10.6 years (range 0.2–11.0 years), 163 individuals (38%) died (98 men and 65 women). The total number of person-years with follow-up was 3918, implying 4.2 deaths per 100 person-years at risk (men 5.5, women 3.1). Overall, 77 deaths were from cardiovascular causes and 81 were non-cardiovascular deaths (including 40 attributed to malignancy). The cause of death was unknown in five cases. Mortality among the 30% of invited individuals who did not participate in the study was considerably higher (67%) than among participants.
The baseline characteristics of participants are shown in table 1. No unexpected differences between survivors and non-survivors were found. There was a strong correlation between BMI and waist circumference (men r=0.82, p<0.001; women r=0.86, p<0.001), suggesting that BMI strongly reflects abdominal obesity.
Baseline characteristics of the study cohort according to survival status
The results of the Cox PHREG analyses of the association between BMI and all-cause mortality across DM/IFG status are shown in table 2. Significantly better survival was found by increasing BMI in individuals with DM/IFG (HR for death per kg/m2 increase in BMI 0.91, 95% CI 0.86 to 0.97; p=0.003) but not in individuals without DM/IFG (HR 1.01, 95% CI 0.95 to 1.07; p=0.811). These findings did not change noticeably when excluding individuals with a BMI <20 or individuals who died within 2-year follow-up. As shown in table 2, the above relationship pattern between BMI and all-cause mortality across DM/IFG status also applied to cardiovascular mortality but not to non-cardiovascular mortality.
HRs and 95% CIs for all-cause mortality (if not otherwise stated) per 1 unit increase in BMI and FPG or versus reference in individuals with and without DM/IFG
After adjustment for sex, current smoking, diagnosed hypertension, diagnosed angina pectoris, previous myocardial infarction and previous stroke or TIA, the decrease in death per kg/m2 increase in BMI was 9% in individuals with DM/IFG (HR 0.92, 95% CI 0.86 to 0.99; p=0.017).
Additionally, we performed a Cox PHREG analysis of all participants using a model including, in addition to categorised BMI (≤25/>25) and DM/IFG status (no/yes), the interaction between BMI and DM/IFG status. A significant negative interaction was found (log(HR) −0.10, HR 0.90, 95% CI 0.83 to 0.99; p=0.025).
Although not powered for it, some pertinent subgroup analyses were performed. Thus, HR for death per kg/m2 increase in BMI for individuals with known diabetes was 0.90 (95% CI 0.79 to 1.02; p=0.102), for known or newly detected diabetes 0.89 (95% CI 0.81 to 0.97; p=0.008) and for IFG alone 0.93 (95% CI 0.85 to 1.02; p=0.136). These HR were clearly lower than for individuals without DM/IFG (HR 1.01).
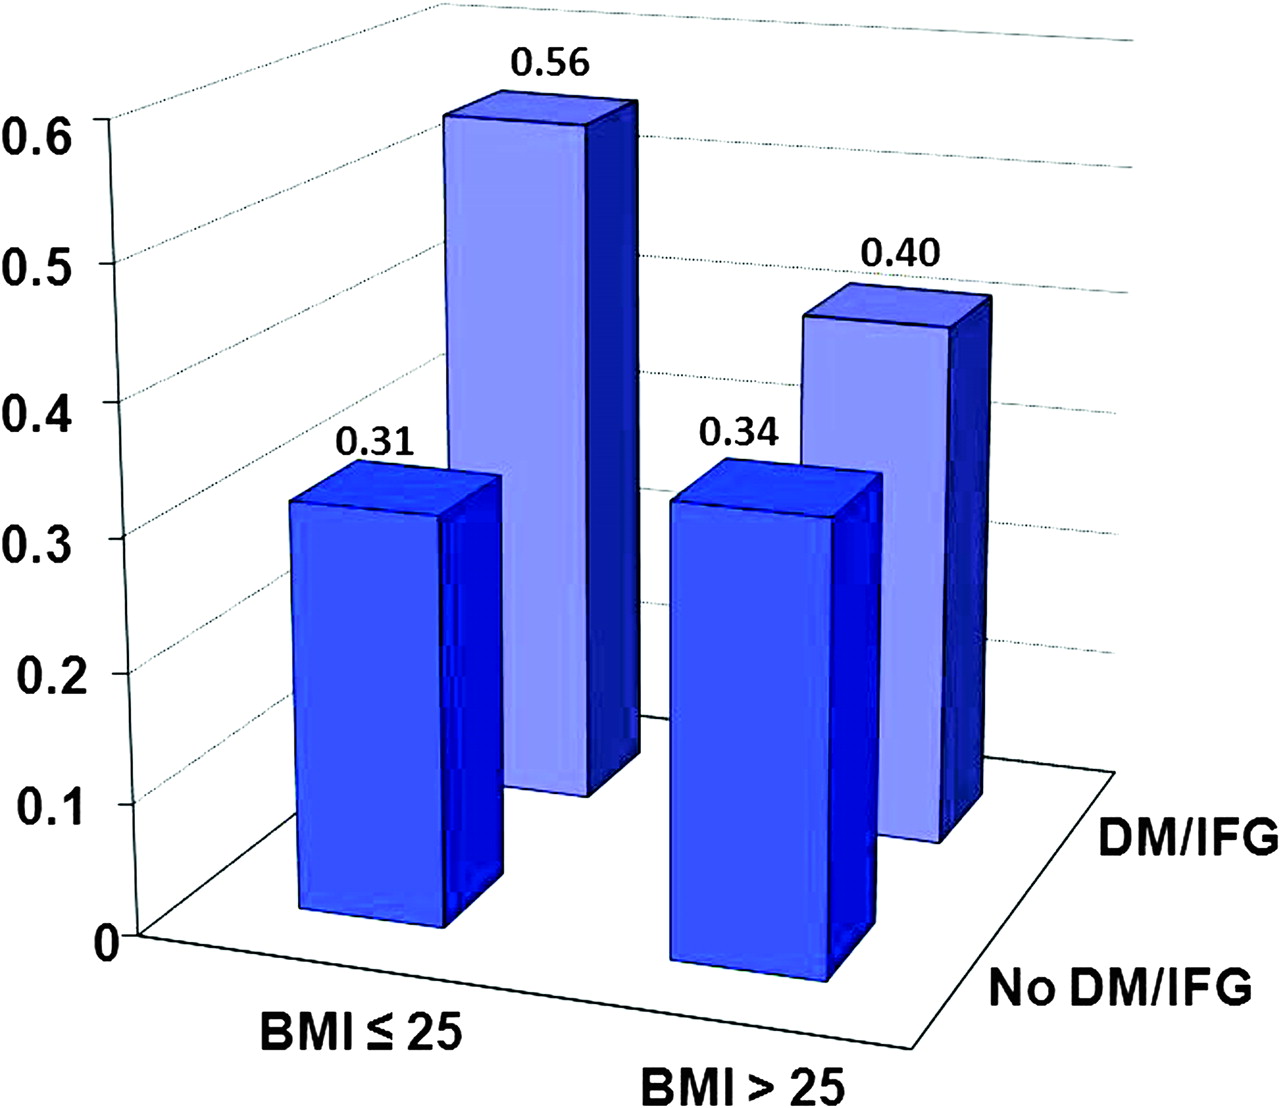
BMI by time interaction was non-significant (p=0.328 for individuals with DM/IFG, p=0.812 for individuals without DM/IFG), suggesting that the proportional hazard assumption was satisfied for BMI. The log(−log(cumulative survival)) curves for the DM/IFG status categories (no/yes) were reasonably parallel, indicating that the proportional hazard assumption was not violated for DM/IFG status. Table 3 and figure 1 illustrate survival according to different combinations of absence/presence of overweight/obesity and DM/IFG. Among individuals with BMI ≤25 there was a conspicuous survival difference between those with and without DM/IFG.
HRs and 95% CIs for all-cause mortality and combinations of (BMI≤25)/(BMI>25) and (No DM/IFG)/(DM/IFG)

Ten-year all-cause mortality categorised by body mass index (BMI) (≤25/>25) and diabetes mellitus type 2 (DM) or impaired fasting glucose (IFG) status (no/yes). The proportion of non-survivors in the different categories are given above each bar.
Cumulative survival according to different combinations of absence/presence of overweight/obesity and DM/IFG is illustrated by Kaplan–Meier curves in figure 2. Evidently, absence of overweight/obesity in combination with DM/IFG delineates a subgroup with a particularly poor prognosis. See table 3 for the results of the corresponding Cox PHREG analyses.

Kaplan–Meier curves showing cumulative all-cause mortality according to dichotomised body mass index (BMI) (≤25/>25) and diabetes mellitus type 2 (DM) or impaired fasting glucose (IFG) status (no/yes). The numbers of individuals at risk at 2, 4, 6 and 8 years were 420, 393, 357 and 328.
Discussion
The main finding of the present study was that, among 75-year-olds with DM/IFG, increased BMI is associated with improved survival. This association remained significant when adjusting for prevalent cardiovascular disease and cardiovascular risk factors. The above unadjusted and adjusted associations did not change noticeably when excluding individuals with a BMI <20 or individuals who died within 2-year follow-up. To our knowledge, this is the first reported study comparing the association between mortality and BMI in elderly subjects with and without DM/IFG. The mean fasting blood glucose levels as well as the prevalence of DM/IFG in the present cohort were very similar to the findings in several European populations studied in the DECODE project.23 This suggests that the present cohort of 75-year-olds is representative of a general European population.
The lack of a significant association between mortality and BMI within the cohort of 75-year-olds agrees with current knowledge. Thus, among individuals aged ≥70 years, only underweight and pronounced obesity (BMI >35)26 were associated with a significantly higher mortality risk relative to normal weight. A Japanese study with an 11-year follow-up of 26 747 Japanese subjects aged 65–79 years demonstrated that lowest all-cause mortality was found within a broad BMI range of 20.0–29.9.27 Flicker et al28 did not observe any greater mortality among obese and overweight elderly subjects in comparison to those with normal weight. In an 80-year-old community based Japanese population, Takata et al14 even observed decreased mortality among obese individuals.
The obesity paradox
Our finding that obese hyperglycaemic individuals do better than lean hyperglycaemic individuals is another example of the so-called obesity paradox observed in patients with certain diseases.18–22 The obesity paradox implies paradoxically decreased mortality and morbidity in association with increasing BMI up to and including obesity and has been reported among patients with severe chronic diseases, for example renal insufficiency,18 chronic obstructive pulmonary disease,18 hypertension21 and heart failure,20 29 30 and in patients undergoing percutaneous coronary interventions19 31 32 and in those with known coronary disease.21 33–35 Advanced age is also associated with the obesity paradox. The phenomenon has been demonstrated in an 80-year-old community based Japanese population by Takata et al.14
It is unknown whether a low BMI is a marker of disease severity or is harmful as such. Reverse causation implying cachexia with a lowering of BMI caused by chronic diseases has been proposed as an explanatory mechanism for the obesity paradox.18
Some recent research findings may be considered in relation to the obesity paradox. Thus, studies of body weight changes in healthy general populations over 5 years,36 16 years37 and 26 years38 have demonstrated that a decrease in body weight, even among those originally overweight/obese, was associated with increased mortality compared to weight stability. In one of the above studies, Strandberg et al38 categorised 1114 healthy Finnish men (mean age 47) according to whether their BMI was above or below 25 at baseline and at re-examination after 26 years. Mortality during 7-year follow-up was clearly highest in the group which had changed from overweight to normal weight and was fairly equal between the other groups (log-rank test between groups, p<0.001). The findings were robust for adjustment for prevalent diseases at re-examination. The mortality difference was due various causes, including coronary artery disease, stroke and cancer.
It is not surprising that obvious chronic diseases cause loss of body weight, but this Finnish study over 26 years suggests a long cachectic process without the presence of manifest chronic disease. Hypothetically, such a process may be caused by, for example, slowly developing undiagnosed atherosclerosis. It is tempting to speculate that the obesity paradox demonstrated in the present investigation among elderly subjects with DM/IFG may be a consequence of such a ‘sub-cachectic’ process. However, it must be noted that the consensus definition of cachexia includes an inflammatory state39 and the present investigation provides no data on this topic.
It is noteworthy that the excess mortality among lean individuals with DM/IFG in the present investigation applies only to death from cardiovascular disease and not from non-cardiovascular disease. This finding suggests that atherosclerosis has a key role in the sub-cachectic process supposed above.
Traditionally, BMI is regarded as a proxy for body fat. In the present cohort a strong correlation between BMI and waist circumference indicates that BMI closely reflects abdominal fat mass. However, the volume of fat-free mass also influences BMI. Physiologically, loss of lean body mass, particularly muscle mass, occurs with ageing12 and sometimes leads to sarcopenia, characterised by a marked decrease in muscle mass and muscle strength.18 40 In a Danish cohort of 50–64-years-olds, in whom body composition was estimated by measuring bioelectric impedance, both high body fat and low fat-free mass were independent predictors of all-cause mortality.41 Similar results were reported by Heitmann et al42 among 60-year-old Swedish men.
Possible underlying mechanism
Modulation of the inflammatory response is a potential mechanism underlying the obesity paradox. Differences in the cytokine tumour necrosis factor-α (TNF-α) system are observed between lean and obese patients with heart failure.29 43 Leaner patients with heart failure have been shown to have increased levels of TNF-α and other inflammatory cytokines compared with obese patients.44 Furthermore, there is a large body of evidence that inflammation is closely related to atherosclerosis,45 but there is no simple answer as to whether the immune response promotes or retards atherogenesis.46
Considering the obesity paradox in older people with DM/IFG demonstrated in the present investigation, it is noteworthy that several markers of inflammation including white blood cell counts, C reactive protein and interleukin-6 predict the development of DM47 48 and that cytokines such as TNF-α and interleukin-6 are raised in individuals with DM.49
Policy implications
The results from the present study do not necessarily apply to intentional weight loss. For example, lean subjects with diabetes may have lost weight because of unrecognised cardiovascular complications related to their disease. This does not exclude the possibility that obese patients with diabetes may benefit from intentional weight loss. Nevertheless, as regards older people, the present findings raise questions concerning the current guideline recommendations50 of weight loss “for all overweight and obese individuals who have or are at risk of diabetes”. These recommendations50 are mainly based on observations that “modest weight loss has been shown to reduce insulin resistance”. Further research on this clinically important topic is needed.
A general finding from the literature is that intentional weight loss improves cardiovascular risk profile but the effect on mortality is not consistent.51 Two studies concerning older study populations (aged>60 years) found some survival benefit from intentional weight loss.52 53
The present investigation demonstrates that lean older people with DM or IFG constitute a high-risk group for total and cardiovascular mortality. Consequently, they deserve particular medical attention and the possibility of undiagnosed chronic disease must be considered. Screening for DM/IFG and intensified glycaemic control of known DM and IFG are possible options. However, the evidence from long-term studies in older adults demonstrating a possible benefit of glycaemic control is scarce.54 55
References
Supplementary materials
Supplementary Data bmjopen-2010-000012
Files in this Data Supplement:
Footnotes
To cite: Nilsson G, Hedberg P, Öhrvik J. Survival of the fattest: unexpected findings about hyperglycaemia and obesity in a population based study of 75-year-olds. BMJ Open 2011;1:e000012. doi:10.1136/bmjopen-2010-000012
Funding The original cardiovascular health survey was supported by grants from SparbanksstiftelsenNya and Västmanland's Research Foundation Against Cardiovascular Diseases. The authors are independent from the funders of the original study.
Competing interests None.
Ethics approval The study was approved by the research ethics committee of Uppsala University, Sweden.
Contributors GN and JO conceived and designed the study, performed the data analyses and interpreted the results. GN wrote the first draft of the manuscript. PH contributed to the initial collection of the data and verified the medical diagnoses. All authors critically reviewed the manuscript for important intellectual content and approved the final version of the paper. JO acts as guarantor of the paper.
Provenance and peer review Not commissioned; externally peer reviewed.
Data sharing statement Statistical code and datasets are available from the corresponding author at john.ohrvik{at}ki.se.