Article Text

Abstract
Background In October 2012, the Chinese government established maximum retail prices for specific products, including 30 antineoplastic medications. Three years later, in June 2015, the government abolished price regulation for most medications, including all antineoplastic medications. This study examined the impacts of regulation and subsequent deregulation of prices of antineoplastic medications in China.
Methods Using hospital procurement data and an interrupted time series with comparison series design, we examined the impacts of the policy changes on relative purchase prices (Laspeyres price index) and volumes of and spending on 52 antineoplastic medications in 699 hospitals. We identified three policy periods: prior to the initial price regulation (October 2011 to September 2012); during price regulation (October 2012 to June 2015); and after price deregulation (July 2015 to June 2016).
Results During government price regulation, compared with price-unregulated cancer medications (n=22, mostly newer targeted products), the relative price of price-regulated medications (n=30, mostly chemotherapeutic products) decreased significantly (β=−0.081, p<0.001). After the government price deregulation, no significant price change occurred. Neither government price regulation nor deregulation had a significant impact on average volumes of or average spending on all antineoplastic medications immediately after the policy changes or in the longer term (p>0.05).
Conclusion Compared with unregulated antineoplastics, the prices of regulated antineoplastic medications decreased after setting price caps and did not increase after deregulation. To control the rapid growth of oncology medication expenditures, more effective measures than price regulation through price caps for traditional chemotherapy are needed.
- price regulation
- deregulation
- Laspeyres index
- antineoplastic medications
This is an open access article distributed in accordance with the Creative Commons Attribution Non Commercial (CC BY-NC 4.0) license, which permits others to distribute, remix, adapt, build upon this work non-commercially, and license their derivative works on different terms, provided the original work is properly cited, appropriate credit is given, any changes made indicated, and the use is non-commercial. See: http://creativecommons.org/licenses/by-nc/4.0/.
Statistics from Altmetric.com
Strengths and limitations of this study
An interrupted time series design with two breakpoints was adopted to assess changes in price, volume of use and spending following implementation of two price policies.
The study adds value to the understanding of the effects of government regulation and deregulation on the prices of cancer medications.
We were unable to obtain the full list of products under government price regulation since 1996, which could have led to selection bias.
Given our use of aggregated hospital procurement data, we could not assess policy impacts on numbers of patients treated or appropriateness of use at a given level of medication spending or use.
Introduction
Cancer medications account for the highest proportion of pharmaceutical spending among all therapeutic classes.1 Rising cancer medication prices contribute to the rapid rise of medical and pharmaceutical expenditures, drawing criticism from leading academics, patients, cancer specialists and policy experts.2–4 In response, policymakers are implementing a variety of regulatory controls.5
International studies of the roles of regulation and competition in pharmaceutical markets have addressed various challenges and benefits of government price control policies from different perspectives.6 7 Srinivasan et al 8 argue that the pharmaceutical market requires government regulation because of market failures,8 such as information asymmetry and perverse incentives which affect pricing, professional behaviour and competition.9 Studies in a number of settings have found that direct price cap government regulation can be effective in reducing medication prices.10–12 However, researchers have reported favourable effects of unregulated generic market competition on medication prices13 14 and argued that the high price of medications is due in part to interfering government controls.15 In critics’ eyes, government regulations, such as price caps, constitute a barrier to dynamic competition in the generics market, resulting in consumers not benefiting fully from competition on pharmaceutical prices.16–18
In China, the government has introduced complex medication price control policies to decrease medication prices. First, after the Urban Employee Basic Medical Insurance was established in 1998, the National Development and Reform Commission (NDRC) was required to set a highest retail price using a cost-plus calculation for each medication listed in the National Reimbursement Drug List (NRDL).19 20 Rules for price differences and price ratios of medicines were applied to convert a substance’s price into different prices for medicines with different dosage forms or specifications.21 From 1998 to 2015, the NDRC used price caps to reduce drug prices 31 times, involving 1029 substances (not including traditional Chinese medicines).22 23 In addition, because medication expenditures accounted for 40.4% of total health expenditures (in 2009) and almost 70% of medication sales were in hospitals (in 2013),24 25 since 2010, provinces had to conduct a centralised bidding and tendering process to procure all hospital medications, with the intent to decrease prices and curb medication expenditures.26
In October 2012, the NDRC established maximum retail prices for specific products listed in the 2009 National Reimbursement List, including 36 antineoplastic medications.27 Following the central government’s requirement to limit regulatory controls in economic management, China loosened administrative controls over medication prices and the NDRC formally abolished price ceiling policies in 2015.28 Price decreases and increased use of price-regulated medications after the 2012 price regulation and price increases after the 2015 government price deregulation were expected. However, the effects of government price regulation and deregulation on anticancer medications are unknown. We studied the impacts of NDRC price regulation and deregulation on the relative prices and sales volume of and spending on antineoplastic medications in China.
Methods
Study design
We used the strongest quasiexperimental design, an interrupted time series (ITS) design,29 with two breakpoints to assess changes following implementation of two price policies. The first breakpoint, October 2012, served to assess the effects of the government retail price regulation that was announced on 14 September 2012 and came into effect on 8 October 2012. The second breakpoint, June 2015, served to assess the effects of government retail price deregulation that was announced on 4 May 2015 and came into effect on 1 June 2015. To compare the effects of each policy intervention, we conducted analyses of medication groups for which 2012 price caps were and were not applied. The intervention group of medications had retail price caps since October 2012 and the control group was without price caps throughout the study period. We use the term ‘price-regulated medications’ for the medicines that were under price regulation during the intervention period; these products are no longer price regulated (figure 1). We hypothesised that the impacts of price regulation or deregulation on purchase prices, volumes and spending would differ between the two groups.

Timeline of price regulation and deregulation of 52 antineoplastic medications.
Data source
Data on products purchased between October 2011 and June 2016 were extracted from the observational Chinese Medical Economic Information database of public hospital medication purchasing records.30 We conducted a search of all antineoplastic medications in the database by Anatomical Therapeutic Chemical code (L01).31 We excluded those antineoplastic medications with missing data. We included antineoplastic medications that were regulated in October 2012 as intervention group. Antineoplastic medications which were not listed in the NRDL and thus not subject to price caps during the study period constituted the control group. We extracted procurement data for 52 antineoplastic medications (30 medications with retail price caps from October 2012 to June 2015 and 22 medications without any price caps from the year before to the year after the price policy changes, between October 2011 and June 2016, online Supplement 1A and 1B) from 699 public hospitals, including 476 tertiary hospitals, 217 secondary hospitals and 6 primary health facilities in 28 of the 31 provinces in China. Aggregated procurement data were accessed based on data elements in the data set for each product comprised the International Nonproprietary Name, dosage form, strength, manufacturer, medication purchase price per package, monthly purchasing volumes and monthly hospital spending.
Supplemental material
Outcome measures
The primary outcome was the Laspeyres index (Lp), an index formula used in price statistics for measuring the price development over time of baskets of goods and services consumed in the base period 0 by weighting prices by the volume purchased in period 0.32 In this study, the Lp was calculated based on equation (1):
 (1)
(1)
where P ijt stands for price of medication i with strength j in period t, and Q ij 0 stands for the volume for this medication used in period 0; P and Q were calculated in terms of defined daily doses (DDD). The DDDs used in this paper were the recommended daily amounts of each study medication based on dosage regimens recommended in the manufacturers’ instructions, as approved by the China Food and Drug Administration. An Lp value of less than 1 means that the price of the basket of goods in a given period of time was lower than that in period 0, and an Lp greater than 1 means that the basket price has increased from baseline. The currency of price and spending was Chinese yuan (CNY).33
Other outcomes of interest were average monthly purchasing volumes (number of DDDs) of and average monthly hospital spending (CNY) on the 30 price-regulated, 22 price-unregulated and all 52 pharmaceuticals. All price and spending data were adjusted to October 2011 prices using the consumer price index for healthcare.34
Statistical analysis
We assessed outcomes over time for price-regulated medications (intervention group), price-unregulated medications (control group) and all 52 products together. We also modelled intervention effects using the monthly differences in outcomes in the two groups to estimate the relative impacts of regulation and deregulation among the regulated products, controlling for any other externalities that may have affected outcomes in the control group products.
ITS models were used to estimate levels and trends of the outcomes in the preintervention periods and changes in levels and trends in the postintervention periods. ITS models with two interruption points were formulated to detect the effect on Lp, monthly average purchasing volumes and spending, as in equation (2):
 (2)
(2)
We used β 0 to estimate the baseline purchasing volume and spending; β 1 estimated the preregulation trend; β 2 estimated the change in level after the regulation policy; β 3 estimated the change in trend after the regulation policy; β 4 estimated the change in level after the deregulation policy; β 5 estimated the change in trend after the deregulation policy. Key coefficients were β 2, β 3, β 4 and β 5. To estimate the combined level and trend impacts of the policy changes, we calculated the absolute difference in Yit at 12 months after regulation and after deregulation, respectively, compared with the counterfactual, that is, the estimated Yit had the intervention not happened.35
We performed the Durbin-Watson test to estimate the level of residual autocorrelations36 and used the Cochrane-Orcutt autoregression procedure to correct for first-order serially correlated errors when needed.37 All analyses were performed using Stata V.14.0.38
Patient and public involvement
There were no patients and public involved in in the design or planning of the study.
Study results
Influence of government pricing policies on relative purchase prices
The Lp declined over time in both intervention and control medication groups (ie, prices decreased relative to baseline) (table 1, figure 2). After government price regulation in October 2012, the Lp for price-regulated medications dropped suddenly (level change β=−0.082, p<0.001), with significant declines in Lp relative to price-unregulated medications (β=−0.081, p<0.001). At 12 months after the regulation, there was an estimated reduction in the Lp for price-regulated medications of 0.058 (p<0.05) and an estimated increase in the Lp for price-unregulated medications of 0.029 (p<0.05).

Influence of government price regulation and deregulation on monthly Laspeyres index (Lp) among price-regulated medications (n=30), price-unregulated medications (n=22), all medications (n=52) and the difference between regulated and unregulated medications, 2011–2016.
Results of interrupted time series analyses of the impacts of government price regulation and deregulation on Laspeyres price index, monthly average purchase volumes and spending for price-regulated, price-unregulated and all antineoplastic medications, as well as group differences, 2011–2016
After the government price deregulation in June 2015, the Lp for price-unregulated medications decreased significantly (level change β=−0.013, p<0.05), but no significant discontinuities in Lp levels or trends were observed for the price-regulated medications or for the relative change compared with price-unregulated medications. At 12 months after price deregulation, there was no change in Lp for price-regulated medications and an estimated reduction in the Lp for price-unregulated medications of 0.043 (p<0.05).
Influence of government pricing policies on average purchase volumes
The average volume purchased of all 52 antineoplastic medications, measured in DDD, rose from 33 370 DDDs in October 2011 to 66 189 DDDs in June 2016 (table 1, figure 3). There were no statistically significant changes in volume levels or trends after government price regulation or deregulation in any group.

Influence of government price regulation and deregulation on monthly average purchase volumes among price-regulated medications (n=30), price-unregulated medications (n=22), all medications (n=52) and the difference between groups, 2011–2016. DDD, defined daily dose.
Influence of government pricing policies on hospital spending
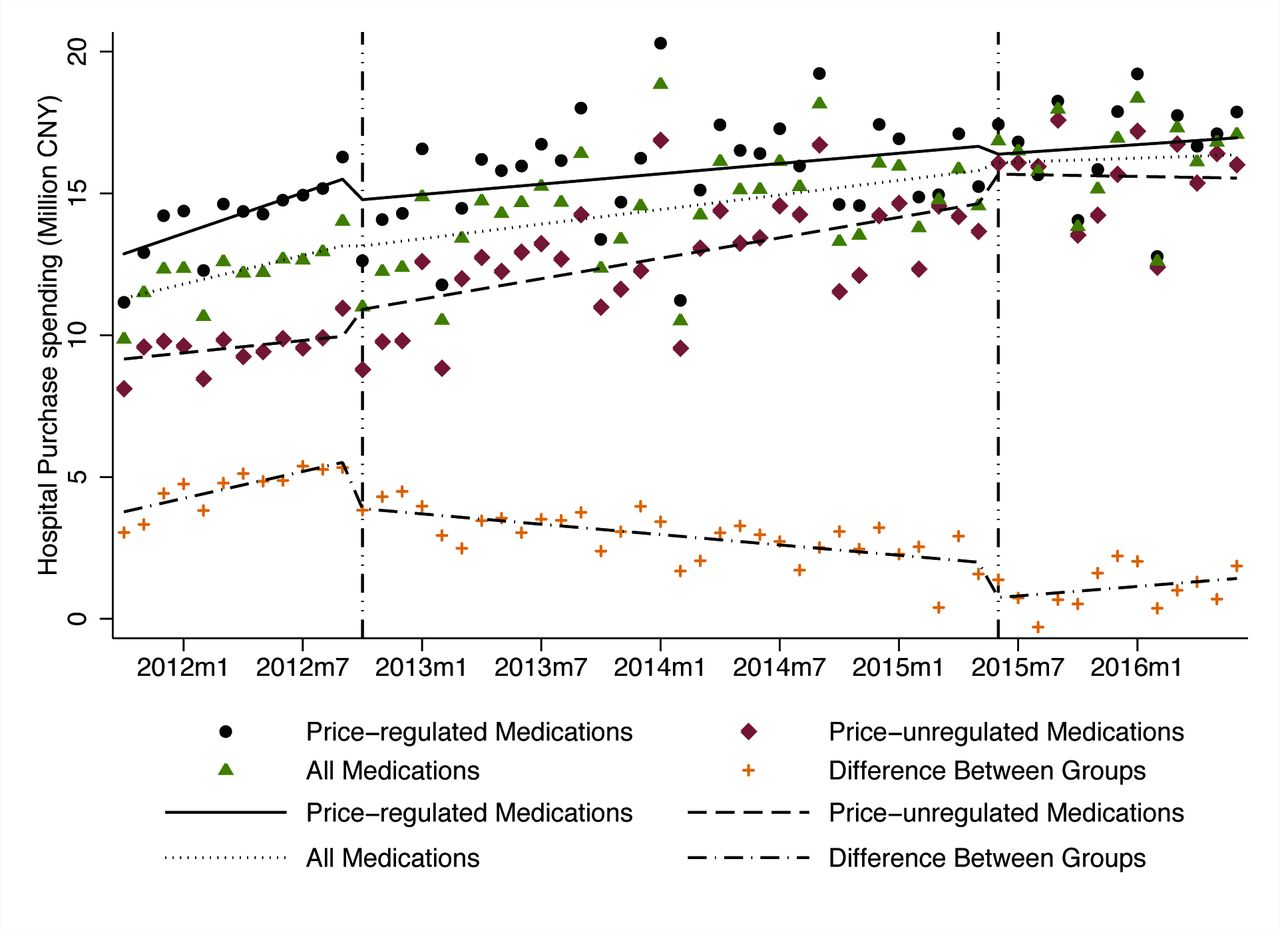
Average hospital spending on all antineoplastic medications rose from ¥9.86 million in October 2011 to ¥17.08 million in June 2016 (table 1, figure 4). There were no statistically significant changes in spending levels or trends after government price regulation or deregulation in any of the groups. However, the spending on price-regulated medications decreased and spending on price-unregulated medications increased after both the regulation and deregulation policies, resulting in significant level and trend changes in the differences between the two groups. After government price regulation, the spending difference decreased suddenly (level change β=−1.570, p<0.01) and increased somewhat more slowly (β=−0.219, p<0.01) than in the baseline period. At 12 months after regulation, the absolute spending difference between the groups was significantly lower (−¥4.508 million, p<0.05) than would have been expected without the regulation.

Influence of government price regulation and deregulation on monthly average spending on price-regulated medications (n=30), price-unregulated medications (n=22), all medications (n=52) and difference between groups, 2011–2016. CNY, Chinese yuan.
After the deregulation policy was implemented, the spending difference dropped again (level change β=−1.301, p<0.01), although followed by an increasing trend (β=0.117, p<0.05). By the end of follow-up, the relative difference between groups had returned to nearly the level expected based on the trend at the time of the price regulation policy.
Discussion
In this study, we investigated the effects of maximum retail price regulation and subsequent deregulation for groups of antineoplastic medications in China. We found that after setting maximum retail prices, the relative price of regulated products fell and that of price-unregulated products increased; the price of all studied medications as a group decreased significantly compared with the 2011 baseline price; after government deregulation, no significant change occurred in either group. Neither setting maximum retail prices nor price deregulation significantly affected volumes purchased or spending on regulated or unregulated medications. However, compared with price-unregulated medications, spending on price-regulated medications dropped significantly after price regulation and deregulation.
Our results indicate that, as expected, a price cap policy was effective in decreasing the prices of selected antineoplastic medications. Most medicines in the intervention group were products with intense market competition, possibly facilitating implementation of price caps. We have previously shown this effect for digestive system medications,39 and others have found similar decreases in price for antihyperlipidaemic agents.40 This might not be the case for originator products with only one supplier in the market. Such medicines were not price regulated at the time.
We did not find the expected price increase after deregulation for the price-regulated medications. This could be due to the fact that medication prices in China are also influenced by the provincial tendering system. Since 2009, the medication tendering process is conducted at the provincial level, with different assessment criteria, usually a composite score of product quality and price, to determine the winner.41 Hence, the tendering mechanism could have constrained medication price increases after government deregulation.42 The provincial tendering process could also explain the price decreases in both groups observed prior to the national government price regulation. Further, generic entry, particularly for the older price-regulated cytotoxic medications, may explain why relative medication prices did not increase after government price deregulation. With the Chinese government encouraging the development of pharmaceutical enterprises, more generic medications have come to the market, which might improve the availability and the affordability of antineoplastic agents.43
We found no significant changes in purchase volumes or spending on either price-regulated or price-unregulated medications. When prices of regulated products decreased in comparison to price-unregulated products following the introduction of maximum retail prices, we did not observe a compensatory increase in the use of regulated products, but spending on products in the price-regulated group decreased. Medication utilisation and spending were likely also affected by reimbursement policies, which restricted the total hospital spending on insurance-listed and price-regulated products but not on unregulated medications.44 45
Finally, prescribers may have maintained a preference for the newer, more expensive medications in the price-unregulated group.46 Studies in China47 and Italy48 have shown that volume and medication utilisation mix, rather than prices, determine overall medication expenditures. This may indicate that it is difficult to manage medication spending increases solely by regulating the prices of some medications in a therapeutic class. Before 2015, China’s Drugs Price Mark-up Policy allowed hospitals to charge and keep 15% of the medication sales budget,49 and hospitals were incentivised to preferentially prescribe higher priced products.50 Since 2015, the zero mark-up policy which bans mark-ups by public health facilities has been gradually introduced to all medications at all public hospitals, presumably eliminating these incentives to use more and higher priced medications.51 However, prescribing habits developed prior to the zero mark-up policy may still prevail.
Limitations
The study had some limitations. First, we were unable to obtain the full list of products under government price regulation since 1996, which could lead to selection bias. Second, an inherent limitation of the Lp may lead to underestimating price decreases. However, the impact of this limitation should be limited, since price elasticity of demand for medicines is relatively small. Third, the comparison group of price-unregulated oncology medications tended to include newer, more expensive products than the price-regulated group and the two groups differed in other characteristics such as indications and therapeutic status in treatment. However, the Lp trends observed at baseline in the two groups of products were quite similar, suggesting that differential changes observed following the government pricing policies were indicative of true differences. Fourth, given that our analyses are based on aggregated procurement data, we have no information on indications of use and potential therapeutic substitution and cannot assess impacts of individual product generic and brand status. Fifth, some new antineoplastic drugs are not included in the NRDL and thus are not price regulated. These drugs may be made available by manufacturers’ access programmes (‘buy 3 get 3 free’) for individual patients. These products would not be part of our price, volume or spending analyses because they would be transacted directly between individual physicians, their patients and the manufacturer (or an intermediary). However, the number of patients who participate in access programmes is limited and almost 70% of medication sales in China occur in hospitals.52 Sixth, given our use of aggregated hospital procurement data, we could not assess factors such as the numbers of patients treated or appropriate use given levels of medication spending or volume.
Conclusion
Compared with unregulated antineoplastics, the prices of regulated antineoplastic medications decreased after setting price caps and did not increase after deregulation. Neither of these policies affected volumes purchased or hospital spending on antineoplastic medications. To control the rapid growth of oncology medication expenditures, more effective measures than setting price caps for selected (typically older) antineoplastic medications are needed.
Acknowledgments
We thank the staff of Chinese Pharmaceutical Association for their support and cooperation in data access and analysis.
References
Footnotes
Contributors LS, XG, DRD and AKW conceptualised and designed the study. SH and MY contributed to analysis of the data. XG, HW and MY conducted the final analyses. XG and HW drafted the initial manuscript. All authors contributed to the critical revision of the manuscript and approved the final version.
Funding This study was funded by the National Natural Science Foundation of China (Grant No 71774005). AKW received partial support from the Department of Population Medicine Ebert Award.
Disclaimer The funders had no role in study design, data collection and analysis, decision to publish, or preparation of the manuscript.
Competing interests None declared.
Patient consent for publication Not required.
Ethics approval The study was considered non-human subjects research by the Harvard Pilgrim Health Care Institutional Review Board.
Provenance and peer review Not commissioned; externally peer reviewed.
Data availability statement All data relevant to the study are included in the article or uploaded as supplementary information.