Article Text

Abstract
Objectives To determine whether asthma hospitalisations of children and adults in the five boroughs of New York City are correlated with influenza hospitalisations temporally and spatially.
Design A longitudinal ecological study.
Inclusion criteria We reviewed the Statewide Planning and Research Cooperative System’s records of hospitalisations in Manhattan, Bronx, Queens, Brooklyn and Staten Island from 2002 to 2012. All hospitalisations with a primary diagnosis of either asthma or influenza were identified using the International Classification of Diseases, Ninth Revision, Clinical Modification diagnosis codes.
Methods A time-series regression analysis was performed using aggregate monthly counts of influenza hospitalisations as predictors of asthma hospitalisations. Time-series regression models were also applied to different age groups and boroughs to examine the magnitude of influenza and asthma correlations across strata. The per cent excess risk was also calculated across age groups and boroughs.
Results Time-series analysis of the overall population revealed a significant positive correlation between influenza and asthma hospitalisations (p=0.011). When stratifying by age, there was a significant positive correlation between asthma and influenza hospitalisations for individuals 18 and older (p<0.01), and no significant correlation found for age groups younger than 18. Percentages of excess risk of influenza-related asthma hospitalisations also increased with increasing age with adults 18–44, 45–64 and 65+ having excess risk percentages of 2.9%, 3.4% and 4%, respectively. Time-series analysis by location revealed positive significant correlations between asthma and influenza hospitalisations in Brooklyn (p=0.03) and Manhattan (p<0.01). Manhattan and Brooklyn had a 2.5% and 1.6%, respectively, percentage of excess risk of influenza-related asthma hospitalisations.
Conclusion Influenza and asthma hospitalisations are significantly associated at the population level among adults. These associations vary by age and geographical location. Influenza prevention strategies targeting adult populations, particularly individuals living in Manhattan and Brooklyn, have the potential for meaningful reduction of influenza-related asthma hospitalisations.
- asthma
- influenza
- public health
- epidemiology
- chronic disease
This is an open access article distributed in accordance with the Creative Commons Attribution Non Commercial (CC BY-NC 4.0) license, which permits others to distribute, remix, adapt, build upon this work non-commercially, and license their derivative works on different terms, provided the original work is properly cited, appropriate credit is given, any changes made indicated, and the use is non-commercial. See: http://creativecommons.org/licenses/by-nc/4.0/.
Statistics from Altmetric.com
Strengths and limitations of this study
This study is a multicentre longitudinal ecological study using data from an extensive statewide database of hospitalisations.
Our study points towards population-level patterns and could not link asthma and influenza hospitalisations at the individual level.
Information on influenza vaccinations of the study population was not available which could potentially influence our results by underestimating the full potential effect of influenza on asthma.
We relied on International Classification of Diseases, Ninth Revision codes to identify asthma cases. Changes in diagnoses criteria or misdiagnoses of asthma over the study period would influence our results.
We could not account for environmental factors such as humidity, pollution and temperature, which can influence influenza transmission as well as asthma exacerbation.
Introduction
Asthma continues to be a major financial and public health concern nationally and in the state of New York. The national prevalence of asthma has increased from 7.3% in 2001 to 8.4% in 2010, reaching a total of 25.7 million people with asthma.1 While national asthma rates have been rising, the state of New York has experienced an overall decline in asthma deaths, hospitalisations and prevalence from 2002 to 20112. However, the financial and public health burden of asthma remains significant. As of 2012, there were an estimated 1.4 million adult New Yorkers and 315 000 New Yorkers under 18 years of age who suffered from asthma with the highest prevalence rates found in the Bronx and four upstate counties.2 In 2012, the New York State Department of Health reported US$1.3 billion annually in direct medical costs and loss of productivity is due to asthma, with approximately half (US$660 million) of these costs attributed to asthma hospitalisations.3 The significant financial and health consequences of asthma coupled with the disparities in risk highlight the need for further progress in understanding the reasons behind recent asthma trends.
Irritants that trigger asthma are multifactorial and include pollens, air pollutants, stress and respiratory infections.4 5 Upper respiratory tract viral infections by rhinoviruses, influenza and respiratory syncytial virus have been extensively reported as triggers for exacerbation of asthma in children and adults.4 Respiratory viruses exacerbate asthma by infecting airway epithelial cells and inducing airway inflammation, mucus hypersecretion and bronchial hyper-responsiveness.6 7 In an attempt to identify the major determinant of asthma exacerbation, studies have examined the importance of certain respiratory viral infections in asthma exacerbation and found that rhinoviruses in particular account for 50%–80% of asthma exacerbations.5 8 9 Though rhinoviruses have been identified as the most prevalent viruses among adults and children exhibiting acute asthma exacerbations, the seasonality of rhinoviruses does not coincide with the seasonality of asthma in adult populations.5 8 9 Influenza viruses, however, predominate during the winter10 11 when the peak asthma hospitalisation rates occur in adults,12 13 suggesting the potential for influenza as one determinant of asthma hospitalisations in adult populations that has been overlooked by a literature that has emphasised rhinoviruses.
The public health implications of influenza-triggered asthma are also an important justification for additional research in this area. In comparison to other respiratory viruses, influenza can be preventable via vaccination and influenza antiviral treatments can modify the severity and reduce the duration of illness.14 In the 2012–2013 influenza season, paediatric influenza vaccination prevalences in New York City (NYC) were 65% for 6–59 months old, 47% for 5–8 years old and 31% for 9–17 years old.15 These prevalences were below the national goal of 80% and below the 2012–2013 national influenza vaccination coverage of 76.9% for 6–23 months old, 65.8% for 2–4 years old, 58.6% for 5–12 years old and 42.5% for 13–17 years old.15 Nationally, vaccine coverage has generally risen each year among children (6 months to 17 years) and adults (≥18) from 2007 to 2012.16 Prevalence of influenza vaccination among adults in NYC from 2007 to 2012 shows a similar general rising trend as the national level.15 16 Vaccine coverages for NYC adults in 2012 were 62% for 65+ years old, 43% for 50–64 years old and 32% for 18–49 years old.15 Therefore, while influenza infections are less prevalent than rhinoviruses, the potential for meaningful public health interventions is greater with the availability of vaccinations. Additionally, much of influenza-related asthma research has focused primarily on paediatric populations and studies looking at adults have been limited to single centres or a few year study period.4 5 8 17 18 As such, understanding of the population-level effects of influenza on asthma in children and adults requires further exploration.
The objective of this research was to determine the extent to which asthma hospitalisations of children and adults in the five boroughs of NYC between 2002 and 2012 were associated with influenza hospitalisations, temporally and spatially. We expected that influenza and asthma hospitalisations would be correlated significantly in adult populations and less so among children due to differences in asthma seasonality that may be related to the school year. In addition to understanding the temporal associations between influenza and asthma hospitalisations, a spatial examination of influenza-related asthma hospitalisations would identify areas that would benefit the most from influenza reduction and intervention measures.
Methods
Data collection
Data were extracted from the Statewide Planning and Research Cooperative System (SPARCS),19 20 a comprehensive data reporting system that was established in 1979 to collect information on hospital discharges. The SPARCS database currently collects patient-level data of demographics, diagnoses and treatments, services, and charges for all inpatient and outpatient hospitalisations in the state of New York.
Study population
The SPARCS data used in this study spanned from January 2002 to December 2012 and were geographically restricted to the patient place of residence within the five NYC boroughs: Manhattan, Brooklyn, Queens, the Bronx and Staten Island. First, all hospitalisations with a primary diagnosis of either asthma or influenza were identified using the International Classification of Diseases, Ninth Revision, Clinical Modification (ICD-9-CM) diagnosis codes. Observations that had primary/principal ICD-9-CM codes of 493.0, 493.1, 493.2, 493.8 or 493.9 were classified as asthma-related hospitalisations. Observations that had primary/principal ICD-9-CM codes of 487, 487.0, 487.1 or 487.8 were classified as influenza-related hospitalisations. Age, sex, race and ethnicity were also extracted from the database. A total of 6342 influenza hospitalisations and 273 664 asthma hospitalisations were identified over the January 2002 to December 2012 time period and used for analysis.
Descriptive statistics
Age was categorised into five groups (0–4, 5–17, 18–44, 45–64 and 65+), based on clinical diagnosis ages for those less than 18 years and approximated tertiles of the adult population. Plots were generated to examine the seasonality of asthma and influenza hospitalisations by each year, with seasons defined as 3-month intervals ranging from December to February (Winter), March to May (Spring), June to August (Summer) and September to November (Fall). Patients’ home addresses were aggregated to the postal ZIP code level and borough level for analysis.
Seasonal autoregressive integrated moving average modelling
A seasonal autoregressive integrated moving average (SARIMA) model was used to analyse the data from January 2002 to December 2011 (online supplementary method). Asthma and Influenza hospitalisations were aggregated by month for use in our time-series analysis. We chose to examine asthma and influenza hospitalisations at the group level and considered influenza as a community and environmental exposure that could influence asthma exacerbation. The year 2012 was withheld to validate the predictive capabilities of the model. The Durbin-Watson test was conducted on both influenza and asthma hospitalisation counts to determine whether the study was eligible for time-series analysis.21 The Durbin-Watson test for autocorrelation for both influenza and asthma series was significant (p<0.001), confirming that positive autocorrelation existed in both series and that ARIMA modelling was appropriate. In order to measure the similarity between the influenza and asthma time series, a cross-correlation function (CCF) was computed between the two series. CCFs measure the degree of similarity between two time series by using the lags of both series.22 If the input series is autocorrelated, CCFs can result in misleading indications of the relationship between an input and response series. To solve this issue, prewhitening was performed in our analysis prior to computing the CCF. Using results from the CCF plot, we fit a transfer function to the model and examined the residuals before proceeding to determine the autoregressive and moving average orders.23
Supplementary file 1
Asthma served as the response series and influenza served as the explanatory series in our analysis. The order of AR or MA terms in the ARIMA model was identified based on the autocorrelation function (ACF) and partial ACF (PACF) of the seasonally differenced series (online supplementary figure 1A,B). In determining our final model, we examined the Akaike’s information criterion (AIC)24 25 to assess goodness of fit between different models and examined the ACF and PACF residuals to ensure that no pattern was left and that there was no presence of significant white noise probabilities (online supplementary figure 2A–C). The best-fit model was a SARIMA (1,1,0) x (0,1,1)12. This model consists of (1) a non-seasonal AR(1) polynomial  , (2) a seasonal MA(1) polynomial
  , (3) a non-seasonal differencing
  and (4) a seasonal differencing
  . Thus, our SARIMA model can be written as


Once the best-fit model was selected, the forecasted values for the model with and without influenza over the 2002–2012 time period were plotted against the original data. Validation of the model was performed by using the SARIMA model with and without influenza as the explanatory series to generate predicted values of asthma hospitalisations for 2012. The resulting predictions with and without influenza for 2012 were compared with the actual 2012 data to determine whether inclusion of influenza as an explanatory variable improved the predictive capability of the model. Mean absolute percentage errors (MAPEs) were also calculated to compare the prediction accuracy of the model fitted with influenza and without.
To examine the associations between influenza and asthma in different age groups and boroughs, we applied the SARIMA model structure used in the city-wide analysis to each of the age groups (0–4, 5–18, 19–59 and 60+) and boroughs (Bronx, Brooklyn, Manhattan, Queens, Staten Island). We additionally performed a sensitivity analysis excluding the spring pollen season of March to May for each year knowing that spring pollen peaks are associated with asthma exacerbations.26
Calculation of per cent excess risk
The per cent excess risk was calculated for each of the age groups and boroughs in order to assess the excess risk of asthma hospitalisations due to influenza. This measure was formed by first identifying the peak month of influenza between January and December of each year, from 2002 to 2012. Once the peak month was identified, the average counts of asthma hospitalisations were calculated for the 11 non-peak months and the complete 12 months, including the peak. The difference in average asthma hospitalisations between the 11 non-peak months and the full year was defined as the excess risk. The per cent excess risk was defined as the ratio between the excess risk and the total 12 months average of asthma hospitalisations. The per cent excess risk represents the percentage of asthma hospitalisations that could potentially be reduced if influenza hospitalisations during the peak month were controlled to the yearly average of influenza hospitalisations.
All statistical analysis was performed using SAS V.8.4.
Patient and public involvement
No patients were involved in the development of the research question, outcome measures, design or implementation of the study. No patients were involved in the analysis or write up of the study. There are no plans to disseminate our results to the study participants.
Results
There were a total of 6342 influenza hospitalisations compared with 273 664 asthma hospitalisations (table 1).
Summary of influenza and asthma hospitalisations in New York City from January 2002 to December 2012
Females comprised 58.5% of asthma hospitalisations in our study sample, but this percentage varied across age groups: 39% of children (<18 years old) hospitalised for asthma were female and 70% of adults. The youngest and oldest age groups comprised the majority of influenza hospitalisations cases.
A plot of asthma and influenza hospitalisations from 2002 to 2012 is displayed in figure 1. Visual examination of the plot revealed a seasonal pattern for asthma and influenza, with peaks occurring in the winter months for influenza and fall/winter for asthma. A comparison of asthma and influenza hospitalisations by each year confirms these seasonal patterns (online supplementary figure 3). Asthma hospitalisations also appeared to be decreasing gradually over time (figure 1).

Monthly hospital admissions of asthma and influenza spanning from January 2002 to December 2012 in New York City.
Asthma hospitalisations in children presented a strong peak in fall that did not coincide with the winter peak of child influenza hospitalisations (online supplementary figure 4A,B). Adult asthma hospitalisations, however, displayed a winter peak in asthma hospitalisations that matched the winter peak in influenza hospitalisations.
In 2009, the USA experienced an outbreak of the H1N1 influenza strain, which resulted in an uncharacteristic peak of influenza activity in June.27 This peak was mirrored in asthma hospitalisations for adults in the year 2009, but not for children. The average number of adult asthma hospitalisations for the summer season between 2002 and 2012 period, excluding the pandemic year was 2813. In 2009, there were 3745 adult asthma hospitalisations in the summer season totalling to ~900 more cases of asthma hospitalisations than the average. The year 2009 also had the largest number of adult asthma hospitalisations during the summer compared with the summer season of any other year between 2002 and 2012. This irregular summer peak can be seen in seasonal plots of influenza and asthma hospitalisations in adults (online supplementary figure 4C,D) with the year 2009 plotted in pink.
Time-series analysis was performed on January 2002 to December 2011 time frame and the resulting SARIMA model was used to forecast asthma hospitalisations for 2012. Based on the cross-correlation coefficient plot generated in the prewhitening process, both variables appeared to evolve concurrently, with no variable leading or lagging the other (online supplementary figure 5). The final SARIMA (1,1,0)x(0,1,1)12 model parameters are shown in table 2.
Summary of the time-series regression model for asthma hospitalisations, New York, January 2002 to December 2012
Based on our influenza model estimate of 0.027±0.011 (p=0.011), hospitalisations of influenza are positively correlated with hospitalisations of asthma (table 2). Additionally, the AIC for the model decreased from −137.4 to −141.7 when influenza was incorporated into the model, suggesting that the model inclusion of influenza as a predictor series provided a better fitting model. Results from our sensitivity analysis excluding the spring pollen season of March to May for each year did not change our results and in fact strengthened our findings with a influenza model estimate of strengthened 0.066±0.02 (p=0.0018) (online supplementary table 1).
The results were consistent when using MAPEs to evaluate model forecasting accuracy between the model with and without influenza as a predictor. The model fitted with influenza had a better forecasting error of 9.6% compared with a forecasting error of 9.9% in the model excluding influenza. To visualise the fit of the model, the predicted values of asthma hospitalisations with influenza as an explanatory variable were plotted with the actual asthma hospitalisations for the study period (online supplementary figure 6). Visual inspection of the predicted series including influenza with the actual asthma hospitalisations confirmed the model’s close adherence to the actual hospitalisations.
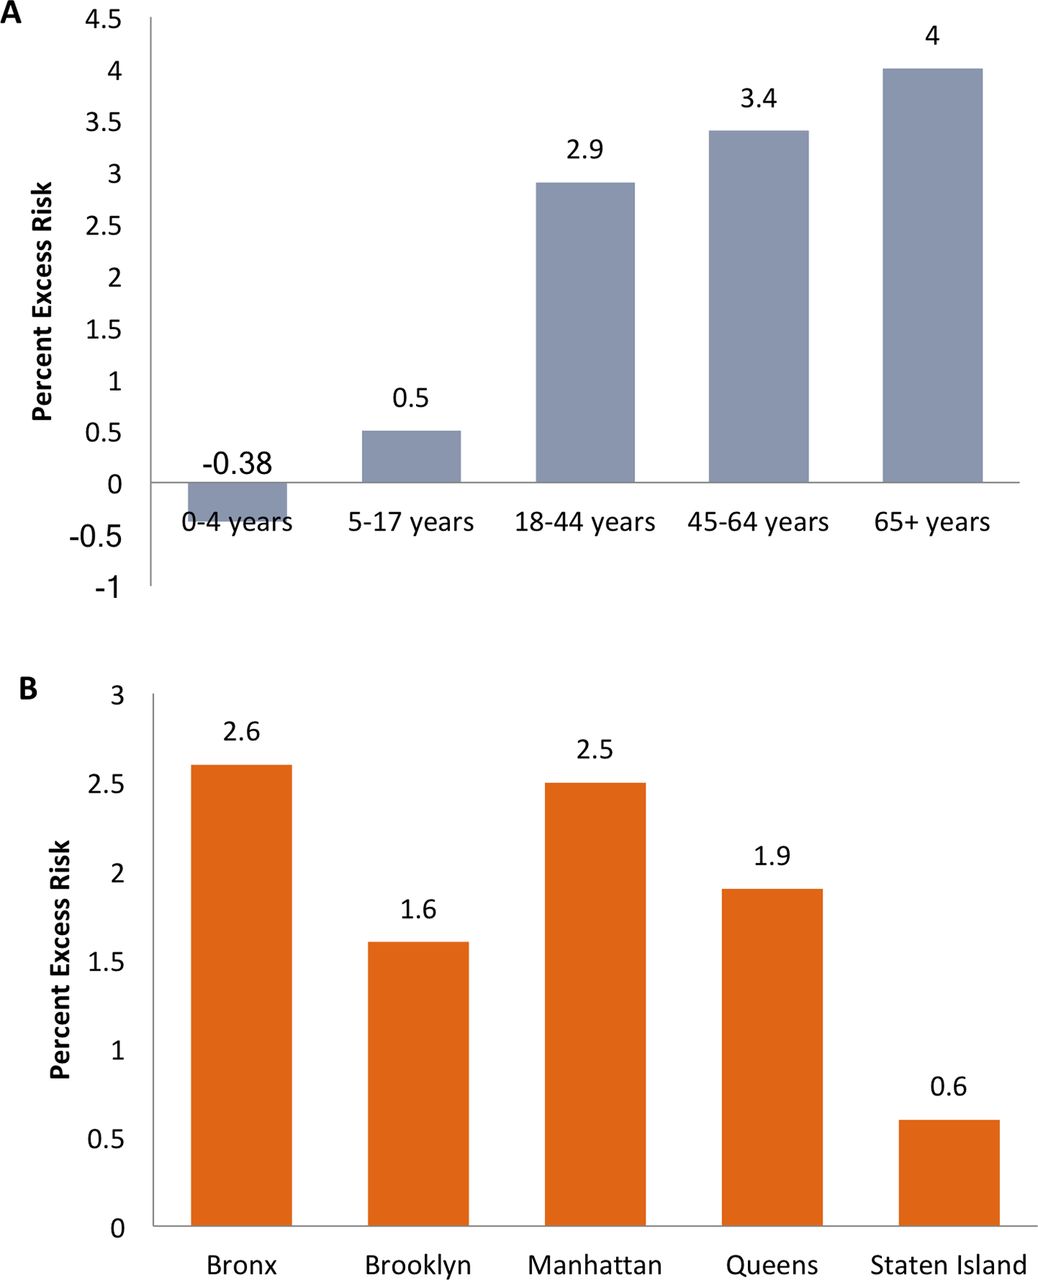
The per cent excess risk was calculated to examine the magnitude that asthma hospitalisations were associated with the influenza. Figure 2 displays per cent increase in excess risks calculated by age and borough. Analysing the per cent excess risks by age groups revealed an increase in per cent excess risks with increasing age (figure 2). When examining the per cent excess risks by boroughs, Manhattan and the Bronx had the highest risk followed by Queens, Brooklyn, then Staten Island (figure 2).
Percentage of asthma hospitalisations attributable to excess peak Influenza activity. Excess risk percentages were calculated by age and borough. The excess risk represents the percentage of asthma hospitalisations that would be reduced if influenza hospitalisations during the peak month were controlled to the yearly average of influenza hospitalisations. Analysing excess risk by age group reveals an increase in risk with increasing age (A). Analysis by borough exposes the highest excess risk to be in Bronx and Manhattan followed by Queens, Brooklyn and Staten Island (B).
Time-series analysis by age and borough was conducted to assess the significance of the correlation between influenza and asthma by each stratum (table 3).
Summary of time-series regression model for influenza parameter estimates that reflect the effects of influenza on asthma hospitalisations by age and borough, New York, January 2002 to December 2012
Age groups under 18 years old did not have significant correlation between influenza and asthma hospitalisations. Relating this significance to the excess risk percentages would suggest that influenza and asthma are significantly correlated in age groups greater than 18 years old, and that at increasing age, temporal patterns in influenza hospitalisations increasingly accounted for asthma risk. Furthermore, controlling influenza hospitalisations to the yearly average could result in a reduction of as many as 4% of asthma hospitalisations among 65+ years old.
Influenza hospitalisations were significantly correlated to asthma hospitalisations in Manhattan and Brooklyn (table 3). Manhattan had one of the highest percentages of asthma hospitalisations due to peak influenza activity, with roughly 2.5% of asthma hospitalisations in the area that could be avoided if influenza activity in the peak month were controlled to the average across the other 11 non-peak months (figure 2). Brooklyn had a 1.6% increase in excess risk of influenza-related asthma hospitalisations.
Discussion
The results from time-series analysis indicate that influenza and asthma hospitalisations are significantly correlated. In addition to the positive temporal associations between influenza and asthma hospitalisations, there is a spatial difference in the per cent of excess risk of asthma related to influenza across the five boroughs with the Bronx and Manhattan displaying the highest excess risk percentages followed by Queens, Brooklyn, then Staten Island. The results from the study support previous research suggesting that improvement of surveillance, prevention and transmission of influenza may lead to reduction of asthma hospitalisations.28
The combination of time-series analysis by age group and calculation of per cent excess risk revealed a directly proportional relationship between increasing asthma risk due to influenza and increasing age. However, the correlation between influenza and asthma was only significant among age groups 18 and older. Individuals less than 18 years of age displayed excess risk percentages close to zero and non-significant influenza to asthma correlations. Such findings suggest that the temporal patterns of influenza hospitalisations are not correlated with asthma hospitalisations and that influenza may not be a significant contributor to asthma hospitalisations in paediatric patients despite what previous research has concluded.17 29 These results are less surprising as asthma exacerbations in children lacked peak seasonal coincidence between asthma and influenza (online supplementary figure 4A–D).
When examining seasonal asthma hospitalisations trends between 2002 and 2012 by children and adults, there are clear seasonal peaks during the spring and fall among children and in the winter among adults (online supplementary figure 4A–D). One potential explanation for the spring peaks observed is due to the increase in pollen during the spring. The relationship between pollen counts and asthma emergency department visits from 2002 to 2012 in NYC was well characterised by Ito et al.26 They found that pollen counts peaked consistently during the spring in NYC over the 2002–2012 period and that these mid-spring peaks had substantive impact on asthma exacerbations. The seasonality of asthma hospitalisations during the autumn months has been observed in other settings among children as well, but triggers for the autumnal asthma peaks in children may have more to do with respiratory viruses than pollen.13 Evidence that fall asthma exacerbations are attributed to respiratory infections coinciding with children returning to school have been noted in other studies.5 30 31 While pollen peaks are indeed associated with asthma exacerbations, the fall asthma exacerbation peak observed is more likely due to respiratory viral infections. Pollen, however, may act synergistically with respiratory viral infection to trigger fall exacerbations of asthma.32
Current vaccination guidelines recommending influenza vaccinations for any asthmatic child 6 months and older may also contribute to the lack of association between peak asthma and influenza hospitalisations. In 2012, NYC vaccine coverage was 65% for 6–59 months old, 47% for 5–8 years old and 31% for 9–17 years old.15 Due to these recommendations, children may have high rates of influenza vaccination that would result in reduced counts of influenza-related asthma hospitalisations.33 However, even with high vaccination rates, several studies examining the effectiveness of influenza vaccination in reducing asthma exacerbations in children have presented null findings or even an inversely proportional relationship.34–36 Other respiratory viruses such as rhinoviruses are more likely to be the major contributors to asthma exacerbations in children as they have accounted for two-thirds of viruses detected in upper respiratory viral infections.37 The lack of significant correlation between temporal patterns of influenza hospitalisations and asthma hospitalisations in our findings advocates for additional analysis of the temporal correlations between rhinoviruses and asthma hospitalisations, particularly among children.
Asthma exacerbations in adults, however, would appear to benefit from influenza prevention strategies. The temporal correlation between asthma and influenza hospitalisations in adults is further supported when considering that peak asthma hospital admissions rates for adults occur in the winter months of December and January.13 Additionally, during the pandemic year of 2009 where influenza hospitalisations experienced an uncharacteristic peak in summer months, there was a detectable shift in asthma hospitalisations among adults during those summer months. This resulted in the largest number of adult asthma hospitalisations during the summer of 2009 compared with the summer season of any other year between 2002 and 2012.
Interpretation of the CCF plot suggested that associations between asthma and influenza occur concurrently with no variable leading or lagging. The peak months of asthma hospital admissions in adults would therefore coincide with the seasonal peaks observed in our time-series plot of influenza and interactions between asthma and influenza would arise concurrently (online supplementary figure 4A–D). The fact that elderly populations have higher excess risk percentages provides support for findings from studies that have examined the impact of influenza on hospitalisations.38 Influenza-related hospitalisations have been known to disproportionately affect elderly populations compared with those <65 years of age.38 As such, the current guidelines for influenza vaccinations recommends vaccines for adults 65 years of age and older, as well as, for anyone adult with asthma.39
When influenza and asthma associations were examined by borough, correlations between both variables were significantly correlated in only Brooklyn and Manhattan. Based on our per cent excess risk calculations, roughly 2.5% and 1.6% of asthma hospitalisations in Manhattan and Brooklyn, respectively, could be avoided if influenza in the peak month were controlled to the average of the other 11 non-peak months. Investigation of the three-way associations between asthma or influenza, borough and sex, age, race or ethnicity did not reveal any patterns of distribution that matched borough excess risk percentage patterns. Additionally, the association between influenza and asthma hospitalisations in Staten Island was not significant despite having one of the highest ARIMA beta coefficients. Considering that Staten Island has a smaller population than the other boroughs and thereby less hospitalisations, the null finding in Staten Island could be influenced by the low statistical power of our data.
Socioeconomic status may reflect issues between poverty and health outcomes that we were not able to account for in our analysis. Exploring whether socioeconomic status is a potential effect modifier of the relationship between influenza and asthma would be valuable in future studies. In addition to low socioeconomic status related factors, air quality and pollutants have been linked to as potential influencers of asthma hospitalisation rates.40 A study conducted by the New York City Department of Health and Hygiene identified areas with the highest ozone attributable rates of ER visits for asthma among children and adults. The highest risk areas were concentrated in the Bronx, Northern Manhattan, Central Brooklyn and parts of Eastern Queens.41 Additionally, air pollutant data on particulate matter, nitrogen dioxide, nitric oxide and sulfur dioxide concentrations from the New York City Community Air Survey 2008–2010 identified Manhattan and the Bronx as the areas with the highest densities of pollutants due to the traffic density in those boroughs.41 The overlap of air pollutant spatial data with the borough stratified excess risk percentages from our study suggests the potential for interaction between influenza and air pollution in determining asthma outcomes. Recent studies examining the potential effect modification of influenza on air pollution and health outcomes have yet to understand the association between the two factors.42 43 A 2002 study conducted by Green et al 44 examined the importance of exposure to allergens and viral infection on precipitating acute asthma and found that allergens and viruses may interact synergistically to increase asthma hospitalisation risk. Further research is necessary to understand whether the potential for influenza to trigger asthma exacerbations is even more pronounced in settings with high levels of particulate air pollution.
Limitations
Our study had several limitations. First, the data do not provide asthma severity information, so those who are hospitalised for asthma likely represent the most severe cases. We were therefore unable to study influenza-related asthma cases that did not result in a hospitalisation. Also, some individuals who have more severe asthma may already be vaccinated against influenza, in which case our results would not reflect the full potential effect of influenza on asthma. We also lacked environmental data such as humidity, pollution and temperature, which are factors that influence influenza transmission as well as asthma exacerbation, but could not be accounted for in our study.10 45 46 Our study is also a time-series study so the findings of this hypothesis-generating study cannot necessarily be used to draw causal inferences at the individual level as we did not know if the same people who had asthma also previously had influenza. The ecological nature of our data can, however, point towards population-level patterns and areas for further investigation. Yet, the population-level patterns observed in NYC may not be generalisable to other settings. Finally, our work relied on diagnostic codes available in the hospitalisation data provided to New York state. There could be variability in the diagnostic criteria of influenza and asthma by clinician, institution and time that would alter the pattern observed in our study.
Conclusion
Our study findings indicate that influenza hospitalisations are significantly correlated with asthma hospitalisations at the population level among adults (>18 years old). Based on our results, influenza prevention strategies merit attention as part of a strategy to reduce asthma hospitalisations, particularly in Manhattan and Brooklyn. Additionally, our study highlights the need for further research examining the relationship between influenza and environmental pollutants on asthma outcomes to improve on our understanding of the risk factors behind asthma exacerbations. The relationship between influenza and environmental risk factors on health outcomes such as asthma is not well understood and warrants more investigation to understand pathways of manifestation.
References
Footnotes
Contributors PT was involved in writing and editing the manuscript as well as performing the statistical analyses. THJ was involved in editing the manuscript and performing statistical analyses. DK was involved in editing and conceptualisation of the manuscript. RTD was involved in editing of the manuscript and interpretation of the data. MP was involved in revising the manuscript. GL was involved in conceptualisation, design, interpretation and revision of the manuscript.
Funding This work was sponsored (in whole or in part) by University of Washington Biostatistics, Epidemiologic and Bioinformatic Training in Environmental Health, Grant #: NIEHS 5T32ES015459-08.
Competing interests None declared.
Patient consent Not required.
Ethics approval This study was approved by the Institutional Review Boards of Yale University and Columbia University.
Provenance and peer review Not commissioned; externally peer reviewed.
Data sharing statement Data are available through the Statewide Planning and Research Cooperative System. Any further inquiries regarding statistical code and data specific to the study should be directed towards the corresponding author.