Article Text

Abstract
Objectives Treatment patterns for patients with myelodysplastic syndromes (MDS) outside clinical trials are not well described. Our objective was to evaluate treatment patterns and patient characteristics that influence time to disease-modifying therapy in patients with MDS in the USA.
Design, participants and outcome measures Patients with MDS treated with erythropoiesis-stimulating agents (ESAs), iron chelation therapy, lenalidomide (LEN) and the hypomethylating agents (HMAs) azacitidine and decitabine, were retrospectively identified in the GE Centricity Electronic Medical Record database between January 2006 and February 2014; LEN and HMAs were defined as ‘disease-modifying’ therapies. Multivariable Cox regression models were used to ascertain patient characteristics associated with time to disease-modifying therapy.
Results Of the 5162 patients with MDS, 35.7%, 40.3% and 4.6% received 1, ≥1 and ≥2 therapies, respectively. ESAs were the first-line (72.5%) and only (64.0%) treatment in the majority of patients who received ≥1 therapy. ESA-only patients were older and had more comorbidities, including isolated anaemia. LEN and HMAs were first-line treatment in 12.4% of patients each; 32.7% received LEN or HMAs at any time. The majority of del(5q) patients (77.6%) received ≥1 therapy, most commonly LEN, compared with 40% of patients without del(5q). A shorter time to disease-modifying therapy was significantly associated with absence of comorbidities, diagnosis after February 2008, lower baseline haemoglobin level, age <80 years and male gender (p<0.002 for all).
Conclusions A high proportion of patients diagnosed with MDS in the USA do not receive approved disease-modifying therapies. It is important to improve access to these therapies.
- mds
- emr
- heor
- haematology/oncology general
- treatment patterns
This is an open access article distributed in accordance with the Creative Commons Attribution Non Commercial (CC BY-NC 4.0) license, which permits others to distribute, remix, adapt, build upon this work non-commercially, and license their derivative works on different terms, provided the original work is properly cited, appropriate credit is given, any changes made indicated, and the use is non-commercial. See: http://creativecommons.org/licenses/by-nc/4.0/.
Statistics from Altmetric.com
Strengths and limitations of this study
This study uses electronic medical record (EMR) data to elucidate how myelodysplastic syndromes is treated in a more representative population than those included in clinical trials.
Data analysed came from >100 million patient records from >1300 installations across 49 US states, both from single-physician offices, as well as large practices and networks.
Procedures occurring outside the EMR system, such as transfusions, are often unrecorded in the EMR database; therefore, transfusions were excluded from the analysis.
Information on International Prognostic Scoring System (IPSS) risk category and key variables used to calculate IPSS scores, such as cytogenetic profile and blast count, were unavailable.
Introduction
Myelodysplastic syndromes (MDS) are a heterogeneous group of haematological malignancies, characterised by ineffective haematopoiesis leading to cytopenias, particularly anaemia.1 2 MDS primarily affects older adults, with a median age at diagnosis of 65–70 years.1 With median survival times ranging between 4 months for the highest-risk group and 6 years for the lowest-risk group, MDS has a variable but often poor prognosis.1
In the USA, the treatment of MDS changed between 2004 and 2006, as the US Food and Drug Administration provided regulatory approval for three disease-modifying agents—lenalidomide (LEN) and the hypomethylating agents (HMAs) azacitidine and decitabine.3 Initial approvals were based on clinical trials that demonstrated the efficacy and safety of LEN in patients with red blood cell (RBC) transfusion-dependent lower-risk MDS and a deletion of chromosome 5q [del(5q)],4 and that HMAs induced complete responses and delayed disease progression in some patients with higher-risk MDS.5 6 However, as only a select group of patients with MDS is eligible for clinical trials, the results from clinical trials may not be translatable to clinical practice in the USA, outside the context of a trial.7 8 For example, typically, elderly patients with MDS have significant comorbidities that may exclude them from clinical trial participation and may also limit treatment options in clinical practice.
Little is known about current treatment patterns for patients with MDS with regard to use of available therapeutic options.9 10 Analyses of practice patterns outside the context of a clinical trial have been limited by the difficulty of accurately selecting and analysing patients. Underdiagnosis, incomplete reporting to registries and coding errors limit the value of population-based registries, whereas claims databases may be more accurate, but do not routinely include clinical information.2
Electronic medical record (EMR) databases are able to provide information on practice patterns in a real-world setting. EMR databases include data that are not available in claims databases, such as laboratory results, condition severity and off-prescription drug use. The GE Centricity EMR Database (GE Healthcare IT, Princeton, New Jersey, USA), established in 1985, contains anonymised clinical practice records from 1994 onwards and is compliant with the US 1996 Health Insurance Portability and Accountability Act.11
We developed an algorithm to identify a cohort of 5162 patients with MDS from the GE Centricity EMR database; baseline characteristics for this cohort were previously shown to be similar to patients in the well-established population-based Surveillance, Epidemiology and End Results (SEER) programme.12 The algorithm-identified EMR cohort was used to evaluate treatment patterns and ascertain patient characteristics that affect the time to disease-modifying therapy (LEN and HMAs) for patients with MDS.
Methods
EMR database
This retrospective analysis was conducted using data from the GE Centricity EMR database, one of the oldest ambulatory EMR systems in the USA.11 The database contains >100 million patient records from >1300 installations across 49 US states, both from single-physician offices, as well as large practices and networks. Approximately two-thirds of the >30 000 participating clinicians are primary-care physicians; the remainder are specialists.
Identification of MDS patient cohort
An algorithm was developed to reproducibly identify patients with MDS with data in the EMR database between January 2006 and February 201412 which was inspired by the work of Cogle et al.13 As the disease-modifying therapies (LEN and HMAs) were approved by January 2006, this date was selected as the start date for the analysis.
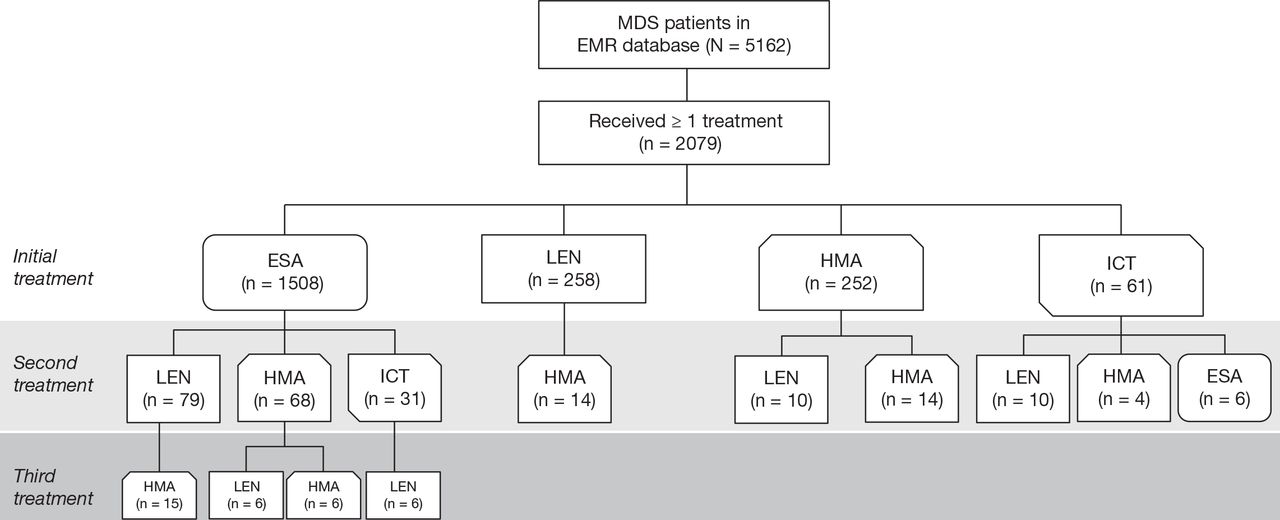
The initial cohort consisted of 9645 patients with ≥1 MDS-specific International Classification of Diseases, Ninth Revision, Clinical Modification (ICD-9-CM) code (online supplementary table S1). However, a single occurrence of an MDS-related code in the EMR was deemed inadequate to identify patients with MDS; a single occurrence could involve evaluation for MDS without a confirmed diagnosis. Eligibility criteria were modified to limit inclusion to patients with at least two occurrences of an MDS-related code at two separate visits (n=563) or ≥1 code and treatment with ≥1 disease-modifying therapy for MDS (n=1208), but these approaches were deemed too restrictive. The final algorithm identified patients with MDS by ICD-9-CM codes entered into the EMR on ≥2 occasions, or ≥1 code AND at least one of the following: ≥1 disease-modifying therapy for MDS, ≥2 haemoglobin (Hb) tests, or ≥1 bone marrow procedure. Patients with records indicative of non-MDS diagnosis, such as ‘MDS ruled out’, were excluded. The final cohort included a total of 5162 patients with MDS (figure 1).
Supplementary file 1

Identification of patients with MDS in the GE Centricity EMR database receiving ≥1 treatment of interest. BM, bone marrow; Hb, haemoglobin; ICD-9-CM, International Classification of Diseases, Ninth Revision, Clinical Modification; MDS, myelodysplastic syndromes.
Only 9% of patients in the initial cohort received transfusions. This percentage is much lower than expected, most likely because transfusions were often given at facilities where data were not captured in the EMR. As transfusion data in the EMR were suspected to be incomplete, transfusions were not included in the analyses.
Evaluation of treatment patterns
Patients were grouped by the treatment they received: erythropoiesis-stimulating agents (ESAs), LEN, HMAs, or iron chelation therapy (ICT), given either as monotherapy, concurrently or sequentially.
Baseline patient characteristics were summarised for each treatment group. Baseline laboratory data were based on tests conducted between 60 days before and 7 days after the onset date—the date that the first MDS-specific ICD-9-CM code appeared in the EMR database for each patient. Cytopenias were derived from Hb levels, absolute neutrophil count (ANC) and platelet count data, using the first available test result collected between 60 days before and 7 days after the onset date. Baseline patient characteristics were similar among different treatment groups.
A sensitivity analysis was performed to examine the robustness of the results and the impact of follow-up duration on outcomes. Given that the median duration of follow-up in the EMR system was short (29 days), results were evaluated in two cohorts of patients with longer follow-up in the EMR system (≥6 months and ≥12 months) to examine whether the duration of follow-up influenced treatment patterns.
Ascertainment of patient characteristics that affected time to disease-modifying therapy
Bivariate and multivariable Cox proportional hazard regression analyses were used to evaluate factors affecting the time to disease-modifying therapy measured from the onset date. Patients who did not receive disease-modifying therapy were censored as of their last visit. Various factors were analysed for their impact on the time to disease-modifying therapy: gender, race, age at diagnosis, geographic area (Midwest, Northeast, South, West, provided within GE Centricity data), baseline Hb, use of supportive care (including haematopoietic growth factors, ICT and transfusions, if reported), insurance type, selected comorbidities (diabetes (type 1, 2 and diabetes insipidus), acute and chronic renal diseases, and acute and chronic vascular diseases, obtained from patients’ medical history), and year of diagnosis. Online supplementary tables S1–S5 show a full list of ICD-9-CM codes used to identify comorbidities included in this study. All covariates with p<0.1 in a bivariate model were included in a multivariable analysis, where a set of independently significant predictors (p<0.05) was identified through a score based on variable selection processes.
To improve interpretability of the results, some quantitative variables, such as time to event or Hb level, were used in the analyses as continuous variables while others were categorised. In particular, time to diagnosis was converted into a categorical variable before being used in the analysis.
Patient and public involvement
As this was a retrospective analysis of an EMR system, patients were not involved in the development, design or conduct of the study.
Results
Patterns of treatment
Of the 5162 patients with MDS included, 1843 (35.7%) patients received 1 therapy of interest, 2079 (40.3%) received ≥1 therapy and 236 (4.6%) received ≥2 therapies. No treatment of interest was registered for 3083 patients (59.7%). Characteristics of patients who received 0, 1, ≥1 and ≥2 therapies are shown in table 1.
Patient characteristics at baseline according to treatment received, showing key treatment groups
Sequence of therapies
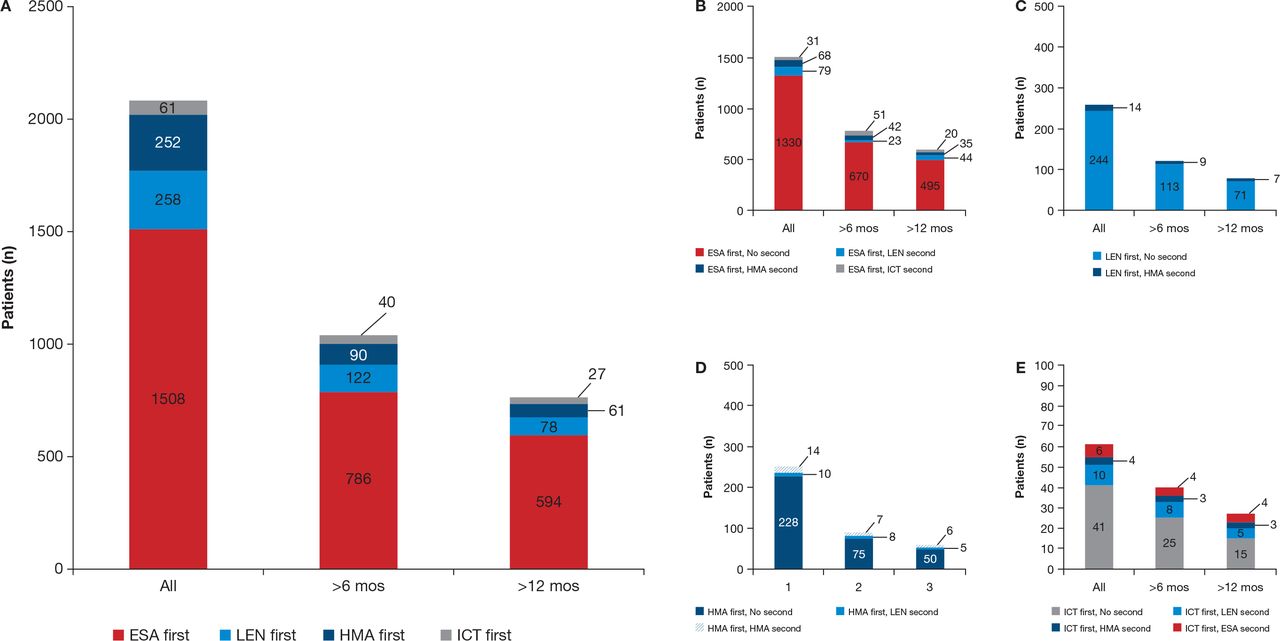
For patients who received ≥1 therapy (n=2079), the sequence of therapies is summarised in figure 2. Only 682 patients (32.7%) received HMAs or LEN during their treatment.

Treatment patterns for patients with MDS in the GE Centricity EMR database who received ≥1 treatment of interest. Figure is based on key treatment groups and does not include all patients, and patients may appear in more than one group. EMR, electronic medical record; ESA, erythropoiesis-stimulating agent; HMA, hypomethylating agent; ICT, iron chelation therapy; LEN, lenalidomide; MDS, myelodysplastic syndromes.
The most common first-line therapy was ESAs (n=1508; 72.5% of patients who received any therapy) (table 1 and figure 3A). These patients had a median age, Hb and ANC levels, and median platelet count of 78.0 years, 10.1 g/dL, 3.5×10³/mm3 and 177×103/mm3, respectively. For most of the ESA-treated patients (88.2%), ESAs were their only treatment for MDS. ESA-only patients were the oldest among treatment groups (median age 79.0 years), had the highest proportion of patients with comorbidities at baseline (69.0%) and most commonly had isolated anaemia. Few patients who were initially treated with ESAs received subsequent treatment with LEN (n=79 (5.2%), median age 76.0 years) or HMAs (n=68 (4.5%), median age 73.5 years) (figure 3B).
Treatment patterns in all patients, and those in the database for ≥6 months and ≥12 months, respectively: (A) first-line treatments only, (B) patients who received ESA first, (C) patients who received LEN first, (D) patients who received HMAs first, (E) patients who received ICT first. ESA, erythropoiesis-stimulating agent; HMA, hypomethylating agent; ICT, iron chelation therapy; LEN, lenalidomide; mos, months.
A total of 258 patients (12.4% of those receiving treatment) received LEN as first treatment (median age 74.0 years) (table 1). The median Hb and ANC levels, and median platelet count of these patients was 9.8 g/dL, 1.7×10³/mm3 and 103×103/mm3, respectively. Most of these patients treated with LEN (n=244 (95%)) received LEN alone; only 14 (5.7%) received a second therapy (all HMAs) (figure 3C).
A total of 99 patients received LEN as second-line treatment and 13 patients received LEN as third-line treatment. The median age of these patients was 76.0 and 74.0 years, median Hb was 9.8 g/dL and 9.8 g/dL, median ANC was 2.5×10³/mm3 and 3.6×10³/mm3, and median platelet count was 181×103/mm3 and 164×103/mm3, respectively. Of the 99 patients who received LEN as second-line therapy, most (n=79 (80%)) had received ESAs as first-line treatment.
A total of 252 patients (12.1%) received HMAs as first treatment (table 1). Median age, Hb and ANC levels, and median platelet count of these patients were 75.0 years, 9.6 g/dL, 1.3×10³/mm3 and 72×103/mm3, respectively. Most patients initially treated with HMAs received no further therapy (n=228 (90.4%)) (figure 3D).
Of the patients receiving HMAs, 100 received them as second-line treatment and 28 as third-line treatment. The median age, Hb and ANC levels, and median platelet count of these patients was 73.0 years (in both groups), 9.8 g/dL and 10.2 g/dL, 1.4×10³/mm3 and 2.7×10³/mm3, and 107×103/mm3 and 149×103/mm3, respectively.
Only 61 patients (2.9%) received ICT as first therapy (figure 3E). Second therapy consisted of LEN in 10 patients and ESAs in 6 patients (table 1).
Del(5q) versus non-del(5q)
Patients classified as having del(5q) comprised 1.6% (n=85) of the total patient group (n=5162), with those not classified as del(5q) comprising the remaining 98.4%. The majority of del(5q) patients were female (67.1%) and had median Hb, ANC and platelet counts of 9.4 g/dL, 2.0×10³/mm3 and 103.0×10³/mm3, respectively. The majority of patients without del(5q) were male (53.2%) and had median Hb, ANC and platelet counts of 10.5 g/dL, 3.0×10³/mm3 and 149.0×10³/mm3 (online supplementary table S6). The majority of del(5q) patients received ≥1 therapy (77.6%) and were treated with LEN (60.0%) at some point. In contrast, only 2013 of the 5077 patients (39.6%) with non-del(5q) MDS received ≥1 therapy and only 320 patients (6.2%) were treated with LEN at some point.
As a sensitivity analysis, we evaluated the duration of time for which patients had data in the EMR system. The median time from the date of first entry to date of last entry in the EMR system was 29 days (IQR 1–376). Duration in days was derived from the formula: last date the patient was in the system - onset date +1. Although the database does not provide information on the reason for discontinuation, a short follow-up time for an individual patient might indicate that they were treated by healthcare professionals outside the EMR network. Baseline characteristics of patients who were in the EMR system for ≥6 months (n=1843 (35.7%)) and ≥12 months (n=1324 (25.6%)) are detailed in online supplementary table S7. Overall, treatment patterns were similar in patients who were in the EMR system for ≥6 months and ≥12 months (figure 3A).
Factors affecting time to disease-modifying therapy
A total of 464 patients who received disease-modifying therapy (LEN or HMAs) and had available baseline information were included in the multivariable analysis (table 2). A shorter time to disease-modifying therapy was significantly associated with absence of comorbidities, diagnosis after February 2008, lower baseline Hb level, age <80 years and male gender (p<0.002 for all). Additional analysis using multivariate logistic regression was performed to identify the predictors for use of disease-modifying therapies (Y/N). The results of this analysis identified gender, age, presence of comorbidities, time from diagnosis date to analysis cut-off and Hb level as significantly associated with probability of disease-modifying therapy, that is, were consistent with the results of the analysis of time to event presented in table 2.
Multivariable analysis of patient characteristics and their association with time to disease-modifying therapy
Discussion
To the best of our knowledge, this is the first time that a cohort of patients with MDS has been identified from a large EMR system using an algorithm. The patients identified in this fashion appeared to have comparable characteristics to patients with MDS reported in the SEER programme. The analysis of this cohort provides several insights into current practice patterns for patients with MDS in the USA.
Patients with MDS in the USA often receive no disease-modifying therapy for their disease, and may be undertreated. Of the 5162 patients included in this analysis, 59.7% received no treatment for MDS and 25.8% received ESAs only. In a survey of 101 haematologists and oncologists published in 2008, 24% of newly diagnosed patients with lower-risk MDS (International Prognostic Scoring System (IPSS) Low/Intermediate-1 (Int-1)) received no therapy (‘watch and wait’) and an additional 53% received best supportive care (BSC) only (including transfusions and growth factors).9 Similarly, in an EMR database review of 1139 elderly patients with acute myeloid leukaemia (median age 76 years), 43% received BSC only (including transfusions and growth factors) with no antileukaemic therapy.14 An analysis of Medicare/Medicaid records also suggests a third of patients with MDS do not receive any treatment in the first 6 months postdiagnosis.15
ESAs were the most commonly used therapy in this MDS cohort. ESAs were first-line therapy in 72.5% of treated patients, and 88.2% of the ESA-treated patients received no second-line therapy. This is consistent with results of a physician survey in which 59% of 432 newly diagnosed patients with lower-risk MDS (IPSS Low/Int-1) received ESAs, including 27% who received ESAs without disease-modifying agents.9 Similarly, 58% of the 198 newly diagnosed patients with higher-risk MDS (IPSS Int-2/High) received ESAs, including 6% without disease-modifying agents. Of note, the FDA issued a safety report for ESAs in 2007 which restricted coverage and reportedly led to a 13% decline in ESA use in patients with MDS during 2008.15 This decline was noted from the beginning of August 2007 and so would have had a limited effect on the results of this study which includes data from patients entered into the EMR database between January 2006 and February 2014.
In this analysis, the median age was highest in the subgroup of patients receiving ESAs only (79 years), suggesting reluctance to use disease-modifying agents in older patient groups. This is in concordance with a SEER-based study of HMA use in 4416 patients aged ≥66 years diagnosed with MDS between 2001 and 2005.16 Only 12.1% of patients had received HMAs, and younger patients were more likely to receive HMAs than older patients; this may be confounded by the reduced availability of azacitidine prior to 2004 due to the National Cancer Institute (NCI)-named patient programme. A retrospective analysis of a US claims database (2007–2010), including 3577 patients with MDS, also showed limited use of disease-modifying therapy in patients aged ≥65 years (13%) and decreasing use of disease-modifying therapy with increasing age, regardless of comorbidities.17 Additionally, there is evidence that physicians may be less likely to prescribe ESAs to older patients due to concerns over cost, and long-term efficacy and safety.18
It is of interest that approved disease-modifying therapies such as LEN and HMAs were used less frequently than ESAs which are not approved for MDS. A minority of patients treated with first-line ESAs went on to receive LEN or HMAs as second-line therapy (5.2% and 4.5% respectively). Multivariable analysis revealed factors associated with a shorter time to initiation of disease-modifying therapy, including younger age, male gender, absence of comorbidity, diagnosis after 2008 and a lower Hb level. Results are consistent with data from the above-mentioned physician survey in newly diagnosed MDS patients, in which 22% of lower-risk and 69% of higher-risk patients received disease-modifying treatments, such as LEN, HMAs or chemotherapy.9
The main limitation of this study is that data included in the EMR database can be incomplete. The EMR database used in the current study is outside the hospital setting which may result in data gaps; procedures occurring outside the EMR system, such as transfusions, are often unrecorded in the EMR database. To limit this potential bias, transfusions were excluded from the analysis. Furthermore, data from physician notes or patient reports can be hard to anonymise, and are inherently difficult to extract. While we recognise that miscoding is a possibility in any studies using clinical databases, the potential for inclusion of non-MDS patients in this study is minimised through using a highly specific MDS ICD-9-CM code and stringent requirements for Hb tests. Unfortunately, information on IPSS risk category and key variables used to calculate IPSS scores, such as cytogenetic profile and blast count, were unavailable.
When considering treatment patterns in this patient group, it is also important to note that ICT is sometimes administered to RBC transfusion-dependent patients, who may be receiving other therapies. When administered in the MDS setting, ICT has not yet been shown in prospective trials to improve survival or to reduce complications of iron overload/transfusional haemosiderosis.
Despite these potential methodological challenges, we believe this research is meaningful due to the current lack of existing data from a large cohort of patients with MDS in the USA. It is clear from our study that disease-modifying therapies approved for MDS are not used for many patients with MDS in the USA. In contrast, ESAs, which are not approved as a treatment for MDS, were the most commonly used therapy. This suggests that ESAs were used as the primary therapy in patients who had cytopenias other than anaemia; patients often received ESAs as the first and only therapy for MDS. As nearly half of the patients with MDS have another cytopenia besides anaemia, the apparent use of ESAs in these patients seems inadequate to address these multiple cytopenias, given that ESAs only treat the symptoms of anaemia which is only one aspect of how MDS can present. Guidelines for the treatment of MDS suggest ESAs have their place in a broad treatment strategy, tailored for the patient19; however, some physicians may not take into account serum erythropoietin levels or risk status when prescribing ESAs,20 discontinue ESA therapy before the recommended duration15 and fail to initiate dose reductions in patients who respond,18 suggesting ESAs may be inappropriately prescribed in some cases. Comparatively, the use of LEN and HMAs, therapies that have been approved for the treatment of MDS for more than 10 years, is exceptionally low.
Further investigations are ongoing into how treatment patterns affect outcomes in standard clinical practice using data collected outside the context of an interventional clinical trial, including prospective observational studies, such as the Connect MDS-Acute Myeloid Leukemia Disease Registry (clinicaltrials.gov NCT01688011),21 and The National Myelodysplastic Syndromes Natural History Study, sponsored by the National Heart, Lung, and Blood Institute in collaboration with the NCI (clinicaltrials.gov NCT02775383).
Acknowledgments
The authors would like to thank Dr Albert Fliss for his valuable contribution to data interpretation.
References
Footnotes
Contributors XM drafted, reviewed and approved the manuscript, and designed the study. DPS drafted, reviewed and approved the manuscript. BLS drafted, reviewed and approved the manuscript. PK was involved with the statistical analysis. ASS drafted, reviewed and approved the manuscript, and was involved with the statistical analysis. MMS drafted, reviewed and approved the manuscript, and designed the study.
Funding The authors received editorial and writing support provided by Rosie Morland, PhD, from Excerpta Medica, funded by Celgene Corporation.
Disclaimer The authors had full access to the data and are fully responsible for content and editorial decisions for this manuscript.
Competing interests XM is a consultant for Celgene Corporation and Incyte. DPS is a consultant for Celgene Corporation, Amgen, Genoptix, Janssen, and Millennium/Takeda, and owns equity in Ariad. BLS is a consultant for Celgene Corporation, and has membership of an entity’s board of directors or advisory committees. PK and ASS are employees of and own equity in Celgene Corporation. MMS is a former employee of and owns equity in Celgene Corporation.
Patient consent Not required.
Provenance and peer review Not commissioned; externally peer reviewed.
Data sharing statement No additional unpublished data from the study are available.