Article Text

Abstract
Objective Summary of findings (SoF) tables present results of systematic reviews in a concise and explicit format. Adopted by many review groups including the Cochrane Collaboration and the Agency for Healthcare Research and Quality (AHRQ), optimal understanding of SoF table may be influenced by the type of information being conveyed and objectives or preferences of the end user. This study aims to compare three SoF table formats in terms of understanding, accessibility, satisfaction and preference with systematic review users.
Methods The primary objective of this three-arm randomised controlled non-inferiority trial is to investigate whether an alternative Grading of Recommendations Assessment, Development and Evaluation (GRADE) SoF table or Evidence-based Practice Center SoF table is non-inferior to the current GRADE SoF table in the understanding of the information presented to systematic review users, particularly for descriptive findings. Researchers, clinical practice guideline developers, policy-makers or knowledge transfer professionals will be recruited. Data will be collected electronically at baseline and after randomisation. Non-inferiority would be declared if the difference in the proportion of participants who understand the information displayed in the alternative SoF table is 10% or less.
Ethics and dissemination The Hamilton Integrated Research Ethics Board reviewed this protocol. The findings from this study will be disseminated through a publication in a peer-reviewed journal.
Trial registration number NCT02813941.
- randomized controlled trials
- systematic review
- summary of finding tables
- GRADE
- AHRQ
This is an Open Access article distributed in accordance with the Creative Commons Attribution Non Commercial (CC BY-NC 4.0) license, which permits others to distribute, remix, adapt, build upon this work non-commercially, and license their derivative works on different terms, provided the original work is properly cited and the use is non-commercial. See: http://creativecommons.org/licenses/by-nc/4.0/
Statistics from Altmetric.com
Strengths and limitations of this study
This is a randomised controlled trial (RCT) that uses a Grading of Recommendations Assessment, Development and Evaluation (GRADE) summary of finding (SoF) table evaluated in another RCT with a positive accomplishment of understanding the information displayed on it.
This is the first time that GRADE SoF tables will be evaluated, in terms of understanding descriptive findings with a select part of a SoF table adapted by an Evidence-based Practice Center to convey information on multiple comparisons efficiently.
This will test understanding of presentation of findings from only a single comparison and will not test understanding of a complex body of evidence.
Background
Systematic reviews summarise the available information on a topic with the goal of helping health professionals, policy-makers, consumers and the public make well-informed decisions about healthcare interventions and practices. In addition to executive summaries of the findings of reviews, summary of findings (SoF) tables have been found to improve understanding among users.1 SoF tables that include summary statistics (such as relative and anticipated absolute effects, mean scores and CI) in addition to narrative descriptions improved readers’ ability to find and understand critical information.2 3
SoF tables have been developed to present results of systematic reviews in a simple and explicit format.4 User testing and randomised controlled trials (RCTs) carried out to measure the understanding, accessibility, satisfaction and preferences have demonstrated that SoF tables can facilitate the presentation of results from systematic reviews efficiently.4–6 Adopted by many review groups including the Cochrane Collaboration, the Agency for Healthcare Research and Quality (AHRQ) and the Grading of Recommendations Assessment, Development and Evaluation (GRADE) Working Group, the SoF tables provide succinct, transparent and easily interpreted judgements of the certainty of evidence and magnitude of effects.7–9
To improve understanding of the results from systematic reviews users, many studies have examined the presentation format and information to include when summarising the results from a systematic review.8 Recently, a randomised controlled non-inferiority trial, conducted by some of the coauthors of the present trial with the purpose of evaluating the understanding, accessibility of information, satisfaction and preferences of users between two SoF tables developed by the GRADE Working Group.2 The current GRADE SoF has been updated based on findings from this randomised controlled non-inferiority trial. Features such as risk difference information, and a column that describes the main results of the treatment effect and the certainty of the evidence to each outcome in a summary format have been included. This current GRADE SoF table improved the understanding of these features and is more accessible and preferred by users. Authors of the study suggested other areas of potential research with the GRADE SoF table such as the wording of standardised narrative conclusion statements and the comparison of percentages and natural frequencies.2
AHRQ has explored options to standardise the SoF tables produced by their Evidence-based Practice Centers (EPCs), but has struggled to find the optimal way to convey large amounts of different types of information (often descriptive) most efficiently and effectively. It is unknown if the adaptation to convey results from multiple comparisons for multiple outcomes most efficiently hinders the understanding of results from a single comparisons. Thus, this project excerpts information on a single comparison from a sample EPC report and compares this approach with similar information formatted in the standard GRADE format that has been previously studied and validated. An alternative GRADE SoF format will be developed to tailor the standard GRADE SoF table to present additional information not reported in previous GRADE SoF tables, including descriptive findings. The information from this study will be helpful to validate whether the current approach taken by an EPC to present a large amount of complex information inhibits the understanding of end users. However, it is important to note that different EPCs use different SoF table formats to present systematic review findings. If there is a finding of inferiority of understanding, accessibility or satisfaction for the current EPC SoF table format, then further work to adapt the current GRADE SoF tables to present more complex information will be needed.
The primary objective of this three-arm RCT is to investigate whether the alternative formats are non-inferior to the validated standard GRADE SoF table, for presenting the excerpted, descriptive findings from an EPC report. The trial will test the understanding of information, including descriptive findings, presented in the different SoF tables. The secondary objective includes assessing the accessibility, satisfaction and preference of these three SoF table formats. For all outcomes, quantitative information will be presented and analysed by a non-inferiority trial design for the three SoF table formats.
Methods
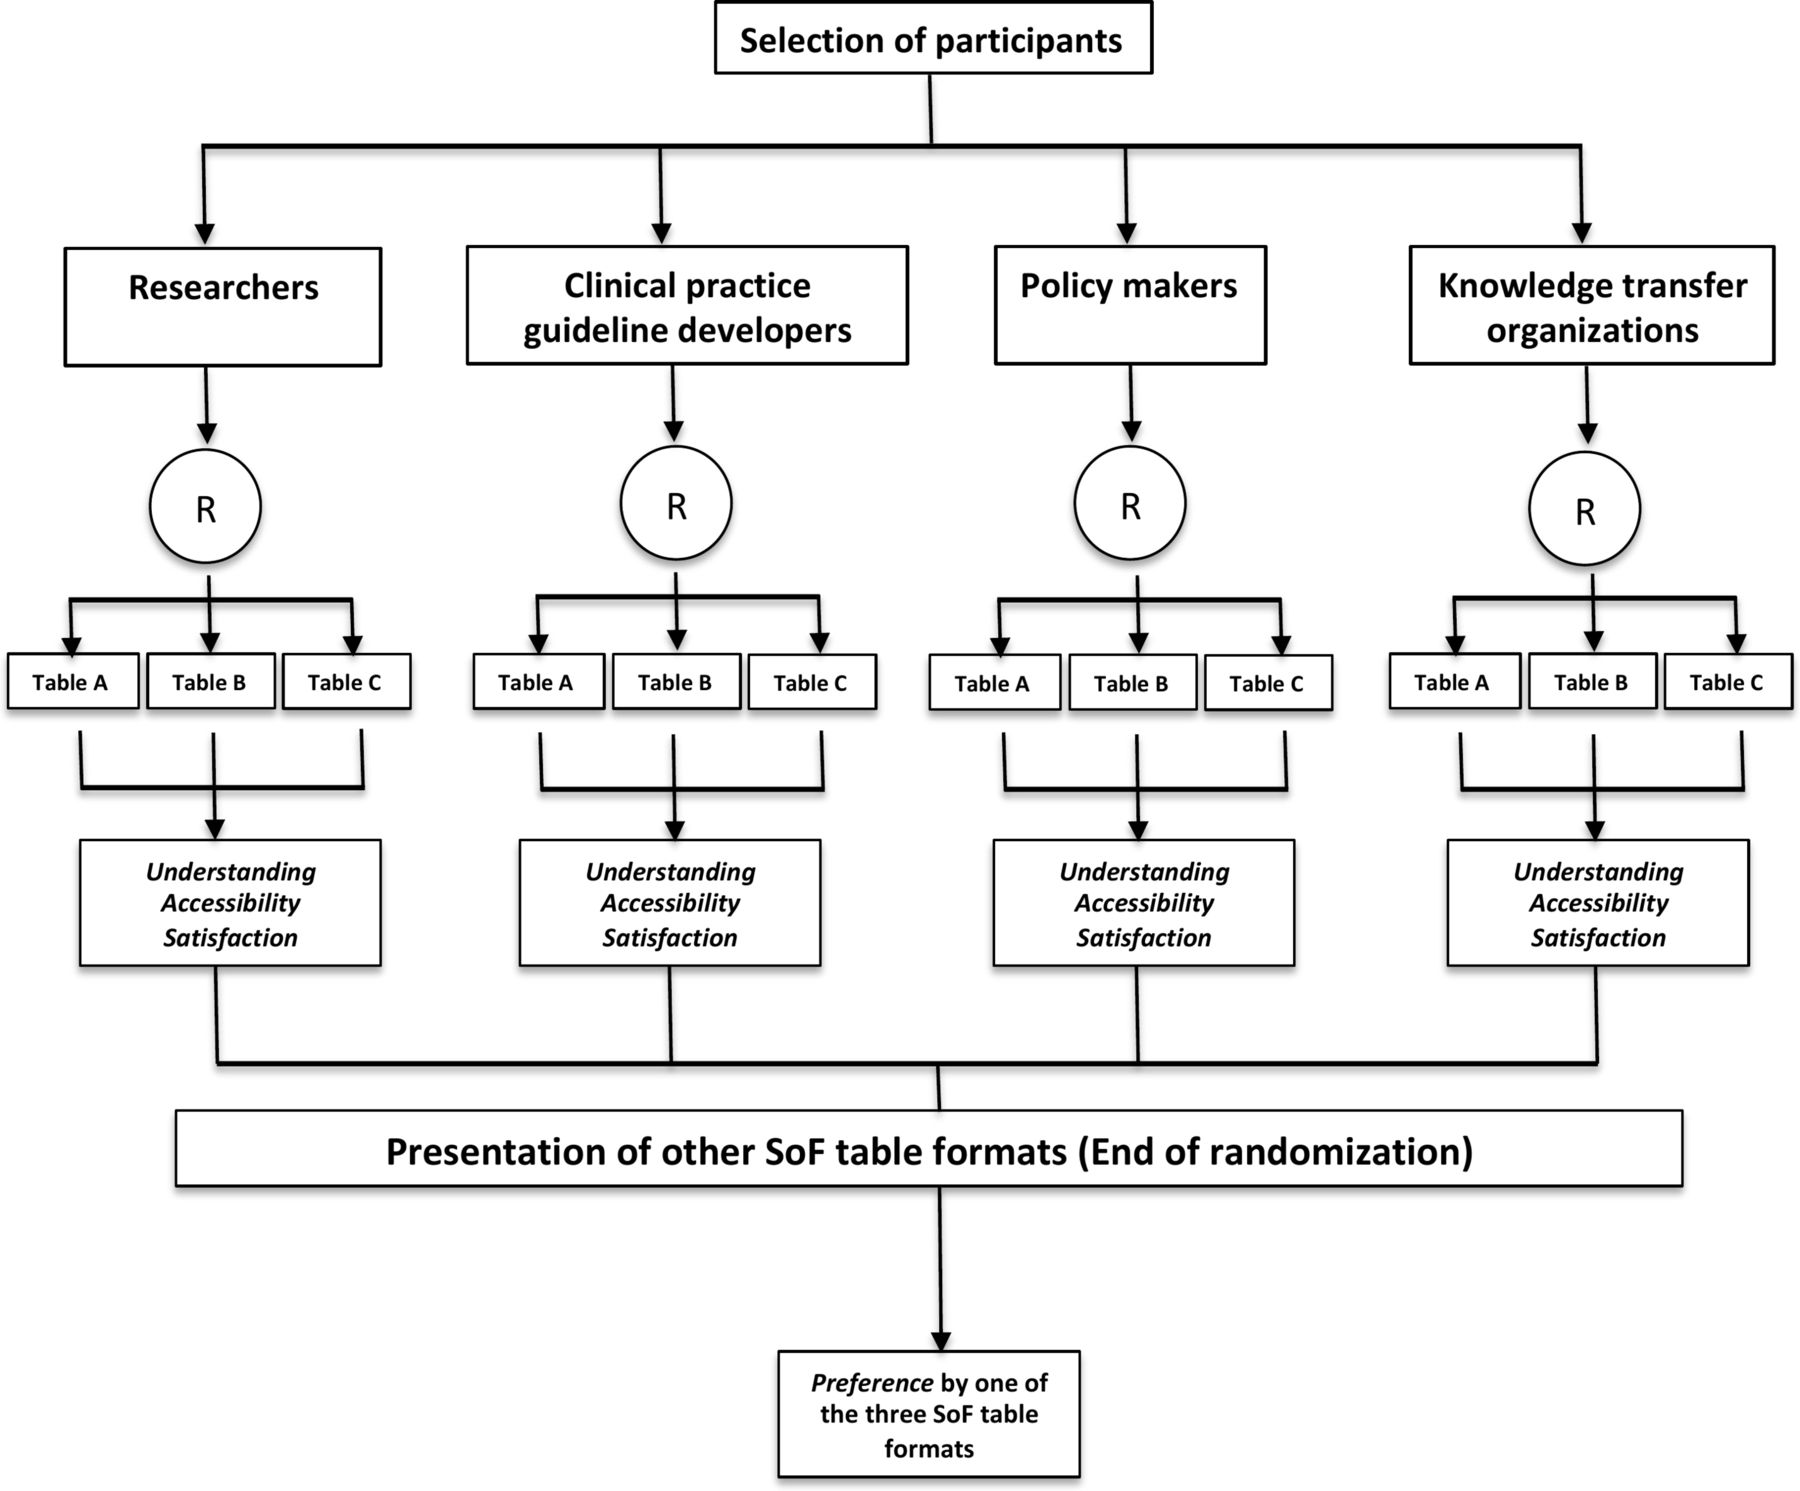
The following description of methods and analysis of this trial follows the latest guidance by the Standard Protocol Items: Recommendations for Interventional Trials.10 Figure 1 shows the design of the trial.
Study flow chart. R, randomisation; SoF, summary of findings.
Study setting
A randomised controlled, non-inferiority trial with three parallel arms will be used in this study to compare three SoF table formats: (1) the current GRADE SoF table (online supplementary table A), (2) an alternative GRADE SoF table (online supplementary table B) and (3) an EPC SoF table (online supplementary table C). We will contact systematic review users via email and ask them to fill in a questionnaire developed using an online survey.11 The data collection form will include relevant information about demographic characteristics, academic background, purpose of using systematic reviews (eg, healthcare decision-making, clinical guideline development, etc), familiarity with systematic reviews and the GRADE system. Participants will be randomly assigned to one of these three SoF tables and asked to answer questions in order to determine understanding, accessibility of information and satisfaction with the SoF table format to which they were allocated. Finally, we will present the participants with the other SoF table formats, to which they were not initially allocated, in order to test their preference.
Supplementary file 1
Supplementary file 2
Supplementary file 3
Participants
Selection criteria
Participants will be eligible if they consider themselves as systematic review users. For the purpose of this trial, systematic review users will be defined as researchers, clinical practice guideline developers, policy-makers or knowledge transfer professionals. Participants who declare dedicating more than 70% of their time during last year to conducting research (eg, methodologists, epidemiologists, statisticians) will be classified as researchers. Participants who declare having participated in at least one systematic review or clinical practice guideline during the last 2 years will be classified as clinical practice guideline developers. Knowledge transfer professionals, who declare working in a dynamic and iterative process that includes synthesis, dissemination, exchange and ethically sound application of knowledge to improve the healthcare system, during last 2 years, will be classified as knowledge transfer professionals. Finally, participants who declare being responsible for or involved in formulating policies in the last year, especially in politics, will be classified as policy-makers.
Recruitment
We will recruit participants primarily from North America. We will contact people through various networks linked to the EPCs and GRADE Working Group via email. Once participants have indicated interest in participating in the study, they will receive a structured and standardised invitation with a link to access the online questionnaire. Using this online system, we will determine whether the participants are eligible based on the selection criteria.
Intervention
Two SoF tables (alternative GRADE SoF table and EPC SoF table) will be used in this randomised controlled non-inferiority trial as an intervention. For the EPC SoF table, we will use one of their formats which was recently published.12 13 The alternative GRADE SoF table format will be developed applying a user-testing technique.
Comparison
The current GRADE SoF table will be the common comparator for the other two SoF tables (alternative GRADE SoF table and EPC SoF table). These three tables will present the same clinical question of the review in terms of patients, setting, intervention, comparator, outcomes and complementary information such as footnotes. Information reported in the systematic review entitled: ‘Transitional Care Interventions To Prevent Readmissions for People With Heart Failure’13 will be used in the three SoF tables. A comparison between the items included in the current GRADE, alternative GRADE and EPC SoF table formats is listed in table 1. Figures 2, 3 and 4 correspond to the current GRADE (online supplementary table A), alternative GRADE (online supplementary table B) and the EPC SoF tables (online supplementary table C), respectively.
Information to test in different SoF table formats
Outcomes
This randomised controlled non-inferiority trial will consider the same outcomes reported in previous RCTs, which have evaluated different formats of GRADE SoF tables2 3 5 6 (table 2).
Overview of outcomes measures and methods of analysis
Primary outcome
The primary outcome of this randomised controlled non-inferiority trial is to investigate the understanding of information that is reported in the current GRADE SoF table format versus an alternative GRADE and EPC SoF table formats.
Understanding is defined as the correct comprehension of key findings. We will frame seven multiple-choice questions about key concepts in the table with five response alternatives for each question and only one correct answer. We will compare the proportion of correct answers between groups per question. Descriptive findings will be analysed using this approach since this topic has not been tested before in a trial.
Secondary outcomes
The secondary outcomes include the accessibility of information, the satisfaction and the preference for one of the SoF tables.
Accessibility of information
This outcome considers four items: (1) how easy it is to find critical information in the table; (2) how easy it is to understand the information; (3) whether the information is presented in a way that is helpful for decision-making and (4) the overall accessibility of information. These four items will be measured by presenting participants with three statements for which they will indicate the degree of agreement: ‘It was easy to find the information about the effects’; ‘It was easy to understand the information’; ‘The information is presented in a way that would help me to make a decision’ and ‘Overall accessibility of information’. Agreement will be measured using a Likert scale asking the participant to consider the three above items together. For all the measures, we will compare the means per group for each item.
Satisfaction
We will ask participants which formatting features are the most satisfactory. For example, in online supplementary table B, we will include a column with information about the number needed to treat (NNT). The purpose of this column is to give participants alternative information to assist with the interpretation of the absolute risk reduction (Do you think that the NNT should be included as available information instead of the anticipated absolute effects difference in future versions of SoF tables?). It will be measured as a dichotomous outcome and we will compare proportions per group.
Preference
Participants will answer the question: ‘Between online supplementary table A (the current GRADE SoF table), online supplementary table B (the alternative GRADE SoF table) or online supplementary table C (EPC SoF table), which table do you prefer?’ It will be measured using a rank of three: first choice, second choice and third choice, and it will be treated as an ordinal outcome. To ensure a correct answer to this outcome, the randomisation will be ended. We will measure the preference for one of three tables at the end of the questionnaire.
A summary with information about the type of scale per each outcome is shown in table 2.
Sample size calculation
Our sample size estimation is guided by selecting the larger sample size estimates for our non-inferiority questions for the primary outcome. We proceeded first by estimating the sample size required to answer our primary research question: a test of the null hypothesis that there is no difference in understanding between the alternate GRADE SoF table and the current GRADE SoF. For this estimation, we used data from another RCT comparing SoF tables.14 We set a non-inferiority margin of 10%, informed by a prior RCT,14 assuming an understanding of 90% in the EPC SoF table, for a one sided α=0.025 and a power of 80%, 142 subjects per arm will be required in table 3. Even though we set out to test non-inferiority, if our results indicate superiority of alternate GRADE SoF table or EPC SoF table over current GRADE SoF table, we will claim superiority if there is a difference of 15% between alternate GRADE SoF table or EPC SoF table and current GRADE SoF table. If there is a difference of 15% (85% vs 70%) between alternate GRADE SoF table or EPC SoF table and current GRADE SoF table, we have a power of 86% to detect it at a level of significance of 0.5 with the above sample size estimated for non-inferiority. The level of significance will be adjusted for a second test of superiority. Since this study will use three arms, we multiplied by 50% to incorporate a third arm. Assuming that 10% of participants will not complete the questionnaire, 234 participants per arm will be allocated to SoF online supplementary tables A–C. These computations were performed using Stata/IC V.12.1 for Mac.15
Sample size calculations for non-inferiority trial design based on proportion of understanding in both arms
Non-inferiority margin
Items evaluating the primary and the secondary outcomes in the SoF tables will be declared non-inferior if the difference in the proportion of participants who understand the new SoF table is statistically less than 10%.
Randomisation
Once the potentially eligible participants have completed the general information and background questionnaire, those who meet the selection criteria will be stratified according to self-reported data as researchers, clinical practice guideline developers, policy-makers or knowledge transfer professionals, and randomly allocated to one of the three SoF tables in a 1:1:1 ratio. To minimise missing data, the online system will randomly assign participants to one of the SoF tables immediately after stratification, providing them with a link to access the questionnaires and tables.
Concealment of allocation
Adequate concealment of allocation sequence will be assured because the online system, independently, will safeguard the generation of sequence to randomisation. Therefore, people who are in charge of the enrolment and assignment of participants will not have influence on the generation of the sequence.
Blinding
The data collection process will be conducted automatically by the ‘SurveyMonkey’ web platform. The SoF table formats will be labelled as A, B or C, and participants will be allocated to one of these tables. Participants will be blinded to all outcomes except to the outcome preference.
Analysis plan
This randomised controlled non-inferiority trial will analyse and report the results according to the Consolidated Standards of Reporting Trials group and its extension of reporting non-inferiority and equivalence randomised trials.16 The data analyst will be blinded. Analysis of the baseline characteristics will be summarised using descriptive statistics according to the data distribution. A summary of the characteristic will be reported for the total of participants and according to group of allocation.
Intention-to-treat population (all trial participants enrolled and randomised; analysis as assigned) will be used to analyse the primary and the secondary outcomes. We will have missing data in the case of randomised participants that do not complete the entire questionnaire. In this situation, a sensitive analysis will be carried out including only the information of those who complete all the questions. In the case of missing data, an available case analysis will be done (using the data available until participant left the study). Because we will use an online system for allocating the SoF tables, we do not expect to deal with cross-over participants. No formal interim analysis will be conducted. A data monitoring committee is not needed since the trial is considered to have minimal risk for the participants.
Statistical methods
In this three-arm non-inferiority RCT, we have planned to analyse the data based on two comparisons: data from the online supplementary table A (current GRADE SoF table) versus online supplementary table B (alternative GRADE SoF table), and data from online supplementary table A versus online supplementary table C (EPC SoF table). Therefore, the current GRADE SoF table will be the common comparator between the other two tables. A two-sided CI approach will be used.
Primary analysis
A t-test will be used for comparing groups for continuous outcomes and χ2 test for binary outcomes. In addition, relative risk with corresponding 95% CIs to compare binary outcomes, and difference in means to compare continuous outcomes will be calculated. P values will be reported to three decimals places with values less than 0.001 reported as <0.001. A Bonferroni correction will be conducted to adjust the P value for the number of comparison to avoid a chance to get a significant result by chance (type I error).
Secondary analysis
We will use regression methods for multivariable analysis. Logistic regression for binary outcomes and linear regression for continuous outcomes will be applied in order to explore the impact of baseline characteristics on the primary outcome. The covariates to explore are: years of experience, familiarity with the GRADE approach and previous education in health research methodology or epidemiology. Multiple test adjustments will be carried out according to the number of groups and endpoints. In the case of more than two groups, the Dunnett method will be used with both alternative SoF tables and a current GRADE SoF table. Finally, adjustments for multiple endpoints will be carried out using multivariate methods such as multivariate analysis of variance.17
Discussion
SoF tables provide results of systematic reviews in a concise format. Seven key elements have been distinguished as the main factors to be taken into account for the presentation of these results: a list of outcomes, a measure of the burden of the outcomes, a measure of the risk and the difference between the risk with and without intervention, the magnitude of the effect, numbers of patients and studies in each outcome, an overall rating of the certainty of the evidence for each outcome and comments.18 During the last 10 years, significant efforts through the development of RCTs have been carried out to improve the presentation of information in these tables and to enhance the user experience with the results of systematic reviews. Different characteristics have been evaluated in these RCTs, such as the display of symbols instead of numbers,6 the inclusion of the SoF tables in Cochrane reviews,5 the presentation of results in terms of study events rates and absolute risk differences3 and the inclusion of a narrative description of a summary between the treatment effect and the certainty of the evidence.2 The results of these studies have demonstrated that the GRADE SoF tables are dynamic and versatile formats that permit a better appreciation of the quantitative results of systematic reviews by users.
The function of the AHRQ is ‘to produce evidence to make healthcare safer, higher quality, more accessible, equitable and affordable, and to work within the U.S. Department of Health and Human Services and with other partners to make sure that the evidence is understood and used’.19 The AHRQ EPC Programme struggles with finding if there is an optimal approach for conveying large amounts of complex information through SoF tables. AHRQ EPC reports compare multiple interventions, which may be complex and include multiple components, and for many different outcomes. Comparisons often do not have quantitative pooled results. Conveying all the relevant information in one simplified table that is understandable to multiple different audiences is challenging, and thus the example for this project is only one example since EPC reports individually tailor SoF table formats to the question and type of evidence available.
With this study, we expect to understand whether this example to adapt a SoF table to present results of large amounts of information significantly negatively affect understanding of a single comparison. The optimal format for presenting the results of multiple comparisons and multiple outcomes of descriptive findings in SoF tables is still unclear, but we hope that this study will be the first step in understanding how to present complex information to the multitude of systematic reviews users of in an understandable and accessible way.
Ethics and dissemination
Members of the Hamilton Integrated Research Ethics Board (HiREB) Executive Committee reviewed this protocol and considered this to be a quality improvement activity, which did not require ethics approval as per TCPS2 (2014) Article 2.5. Through email, after an explanation of the study, a consent form will be provided to all participants. The results of this randomised control trial will be published in a peer-reviewed journal. We also aim to present the results in nationally and internationally conferences.
Consent to participate
The study will be conducted in accordance with the Declaration of Helsinki.18 All eligible participants will be provided with a brief explanation of the study and an online informed consent.
Data protection and confidentiality
We will gather names and emails of participants only for the administrative purposes of sending information about the study and randomising the SoF tables. This information will not connect in any way to the data after the randomisation and will be deleted from the project folder at the end of the data collection. The information will be saved in a laptop, which will have an encrypted and password-protected access. Only personal approved by the principal investigator will have access to the data information saved.
Availability of data and materials
Data available on request from the authors.
References
Footnotes
Contributors HJS is the principal investigator of the study and together with JJY-N, RLM, AC-L, SC, SH, PS and MH designed and established this research project. RLM was responsible for the ethics application and JJY-N for registering the protocol on the website, www.ClinicalTrials.gov. LM, RLM and JJY-N designed the statistical analysis. TB, RLM and JJY-N are responsible for recruitment. RLM and JJY-N are responsible for the coordination of the study. HJS, RLM, JJY-N and SC drafted the manuscript. All authors read and approved the final manuscript.
Funding This research received no specific grant from any funding agency in the public, commercial or not-for-profit sectors.
Disclaimer The authors of this manuscript are responsible for its content. Statements in the manuscript should not be construed as endorsement by the AHRQ or the US Department of Health and Human Services.
Competing interests None declared.
Patient consent Obtained.
Ethics approval Hamilton Integrated Research Ethics Board.
Provenance and peer review Not commissioned; externally peer reviewed.