Article Text

Abstract
Objectives To assess dietary sodium intake and the food sources of sodium in a sample of Australian preschool children.
Design Cross-sectional.
Setting Mothers were followed up when children were approximately 3.5 years of age after participating in a cluster randomised controlled trial: the Melbourne Infant Feeding Activity and Nutrition Trial Program.
Participants 251 Australian children aged 3.5±0.19 (SD) years.
Primary and secondary outcome measures The average daily sodium intake was determined using three unscheduled 24 h dietary recalls. The contributions of food groups, core, discretionary and processed foods to daily sodium intake were assessed.
Results The average sodium intake was 1508±495 (SD) mg/day, (salt equivalent 3.9±1.3 (SD) g/day) and 87% of children exceeded the Australian Upper Level of Intake (UL) for sodium of 1000 mg/day (salt equivalent 2.6 g/day). Main food sources of sodium were cereal/cereal products (25%), milk products (19%), meat, poultry/game (17%) and cereal-based products (15%). Core foods contributed 65%, and discretionary foods 35% of total daily sodium intake, and within the total diet, minimally processed, processed, processed culinary ingredient and ultraprocessed foods contributed 16%, 35%, 1% and 48% of sodium, respectively.
Conclusions Within this sample, most children exceeded the recommended UL for sodium. Core and ultraprocessed foods were key sources of sodium which suggests that reductions in the sodium content of these foods are required to reduce sodium intake in young children. These data also provide further support for public health campaigns that seek to reduce consumption of energy-dense, nutrient-poor foods.
- NUTRITION & DIETETICS
- PUBLIC HEALTH
- EPIDEMIOLOGY
This is an Open Access article distributed in accordance with the Creative Commons Attribution Non Commercial (CC BY-NC 4.0) license, which permits others to distribute, remix, adapt, build upon this work non-commercially, and license their derivative works on different terms, provided the original work is properly cited and the use is non-commercial. See: http://creativecommons.org/licenses/by-nc/4.0/
Statistics from Altmetric.com
Strengths and limitations of this study
Three non-consecutive days of dietary data were collected including one weekend day.
Detailed dietary data allowed food sources of sodium to be described.
The assessment of the contribution of the level of processing to daily sodium intake provided novel evidence affirming the need for a comprehensive sodium reduction strategy for Australian children.
Dietary data likely underestimated total sodium consumed, as the amount of salt added at the table was not assessed.
The over-representation of higher socioeconomic status families has implications for generalisability.
Introduction
Raised blood pressure is a major cause of cardiovascular disease (CVD).1 There is clear evidence for the causal relationship between increased dietary sodium intake and increased blood pressure (BP) in adults.2 In addition, there is growing evidence that salt plays a key role in regulating BP in children,3 ,4 and as with adults, BP increases with increased intake of salt.5–7 To reduce the risks associated with CVD, WHO recommends that adults consume <2 g/day of sodium (salt equivalent 5 g/day).8
Global data available on sodium intake in young children are mainly limited to Europe and North America, and show sodium intake in children between the ages of 1 to 6 years were commonly >1000 mg/day (salt equivalent 2.6 g/day).4 The most recent Australian Health Survey (AHS) 2011/2013 shows that dietary sodium intake for children aged 2–3 years old was high, 1484 mg/day of sodium (salt equivalent 3.8 g/day)9 and exceeded the recommended daily Upper Level of Intake (UL) recommendation of 1000 mg/day for children aged 1–3 years by approximately 50%.9 ,10
In addition to dietary sodium recommendations, the Australian Guide to Healthy Eating (AGHE) provides guidance for Australians to choose a healthy diet, and describes five food groups which are considered ‘core’ foods. The AGHE advises that a varied diet, which includes foods from these five food groups, should be consumed in order to meet nutrient requirements.11 ‘Discretionary’ foods are defined by the AGHE as foods and beverages, which are often energy-dense and/or high in saturated fats, sugar or salt. AGHE recommends that the consumption of discretionary foods should be limited in order to reduce the risk of chronic disease such as CVD and high BP.11
It has been estimated that in the diets of individuals from developed countries, approximately 75% of dietary sodium is derived from salt added during the manufacture of foods12 and many of these types of foods are core foods such as breads, cereals and cheese.13 Furthermore, the AGHE dichotomisation of foods into core and discretionary foods does not explicitly refer to the level of food processing. Classifying foods based on the level of processing is important, as most purchased foods undergo different levels of processing such as peeling, chopping, extraction or refinement. Using a processed food classification system to group foods based on the type and level of manufacturing method allows for the distinction between foods that may differ by sodium content.14 It is therefore relevant to assess both the relative contribution of core and discretionary foods to total sodium intake, and the contribution of the level of processing to daily sodium intake, particularly in children.
The aim of this study was to assess dietary sodium intake and the food sources of sodium in a sample of Australian preschool children, and to assess the contribution from core and discretionary foods and levels of food processing to daily sodium intake.
Methods
Study design and participants
The study population comprised children participating in the Melbourne Infant Feeding Activity and Nutrition Trial (InFANT) Program. The study design for InFANT has been reported previously.15 Briefly, InFANT was a cluster-randomised controlled trial involving first-time parents attending parents’ groups when their children were 3–20 months of age. InFANT was conducted in 2008–2010 in 14 local government areas (LGAs) situated within the major metropolitan city of Melbourne, Australia.15 Individual parents were eligible to participate if they gave informed written consent, were first-time parents, and were able to communicate in English. Each parent–child dyad represented one parent and their first born.15 Parent groups were eligible if ≥8 parents enrolled or ≥6 parents enrolled in areas of low socioeconomic position (SEP). Fifty per cent of eligible first-time parents’ groups within each LGA were randomly selected (62/103 groups) and approached by research staff for recruitment. When first-time parents’ groups declined to participate, another randomly selected group was approached.15 The final recruitment of 62 parent group clusters resulted in a sample of 542 children,15 and groups were randomised after recruitment in order to minimise selection bias. Parents were not blinded to allocation.15
The intervention group received anticipatory guidance on the promotion of healthy eating and physical activity, whereas the control group received information only on child health and development. The original InFANT cohort was followed-up when children were approximately 3.5 years of age.15 The present study uses data from this subset of children who completed the follow-up data collection. At follow-up, there were no differences in sodium intake between the intervention and control groups, and thus, the analysis included all participants.
The 24 h dietary recall and food sources
Dietary intake was assessed by trained nutritionists by telephone-administered, multipass, 24 h recall, with the child's parent, where all food and beverages consumed midnight to midnight on the day before the interview were recalled.16 To limit bias, data were collected over 3 days including one weekend day, and where possible, call days were unscheduled (96% of calls).17 Recalls were non-consecutive,15 and the mean number of days between the first and last recall was 15.5 days (SD 18.3 days). Study-specific food measurement booklets aided parent's estimation of children's food consumption.15 Sodium intake was calculated using the Australian nutrient composition database AUSNUT 2007.18 All recorded foodstuffs and drinks were matched to an eight-digit food code, which was linked to a set of nutrient data. All eight-digit food codes are comprised of a five-digit food code that represented ‘minor’ food categories. Each minor food category fell under a three-digit submajor food category, which then fell within a two-digit major food category. For example, the eight-digit code for ‘bread roll from white flour’ fell within the five-digit code for ‘white breads and bread rolls’, which was within the three-digit code for ‘regular breads and bread rolls’, which fell within the two-digit code for ‘cereal and cereal products’. A detailed list of the food group classification system can be found in AUSNUT 2007.18
Sodium intake recommendations
Children's sodium intake was compared with the National Health and Medical Research Council (NHMRC) UL for sodium of 1000 mg/day (salt equivalent 2.6 g/day) for children aged 1–3 years.10 The UL is defined as the highest average daily intake which is likely to pose no adverse health effects.10
Other measures
Self-administered paper-based questionnaires were provided to parents at recruitment. These were used to collect demographic and socioeconomic data at baseline when children were 3 months of age. Maternal education was dichotomised as low (secondary school or trade qualifications or less) or high (college or university or more).17
Definition of core and discretionary foods
The AGHE was used to classify foods and beverages as core or discretionary foods. The AGHE describes five food groups: (1) grain (cereal) foods; (2) vegetables and legumes/beans; (3) fruit; (4) milk, yoghurt, cheese and/or alternatives and (5) lean meats and poultry, fish, eggs, tofu, nuts and seeds and legumes/beans.11 In this study, these foods have been described as core foods. Foods and beverages, which are energy-dense and/or high in saturated fats, sugars or salt, are defined by the AGHE as discretionary foods. Using a previously described classification system,19 all the food and beverage items consumed by children across the 3×24 h recall periods were classified as core or discretionary foods.20
Definition of processed foods
The NOVA processed foods classification system which groups foodstuffs into four categories (minimally processed, processed, processed culinary ingredient, ultraprocessed) according to the type and intensity of technological intervention was used to classify foods according to their level of processing. The criteria for classifying foods and ingredients into the four groups is described elsewhere.14 In brief, the minimally processed food category often involves food preservation techniques which improves storage suitability and manufacturing methods which enhance palatability and food quality. Processed foods are derived from the addition of ingredients such as oil, sugar and salt to whole foods to make them more palatable. The processed culinary ingredient category includes ingredients used in the preparation of foods and may include versions of the original foods, whereas ultraprocessed foods typically contain little or no whole foods, and often contain ingredients such as preservatives and sweeteners which make foods highly palatable and convenient.14 In this study, each five-digit food code representing minor food categories (n=286) from the InFANT data set were classified as a minimally processed, processed, processed culinary ingredient or ultraprocessed food. In some instances when it was difficult to classify some minor food categories, (n=9) the eight-digit food code was consulted to examine the individual food products within that category and to identify the ingredients and level of processing.
Data analysis and statistical analyses
Descriptive statistics were used to describe food group contributions to total sodium and energy intakes. Mean contributions and SD for the sample, and the percentage of the sample consuming each food group were calculated. The mean ratio method at the individual level was used to calculate the daily contribution of each food group to the participants’ sodium intake.21 This method was also used to calculate the daily contribution of each food group to the participants’ average daily energy intake as well as the contribution of core and discretionary foods, and the four nominated types of processed foods to the participants’ sodium intake over 3 days. Differences in the mean sodium intake between core and discretionary foods were assessed using independent t tests. Analysis of variance (ANOVA) was used to assess the differences in the mean sodium intake between the four types of processed foods. A p value of <0.05 was considered significant. Analyses were conducted using StataSE V.12 software (Release; StataCorpLP, College Station, Texas, USA).
Results
InFANT follow-up participants
The derivation of participants in this study of sodium intakes at 3.5 years in relation to the design of InFANT cohort are detailed in figure 1. Two hundred and fifty-one children who were approximately 3.5 years of age, with an equal gender distribution, were included. Although the follow-up participants were more highly educated and more likely to speak English at home than the participants lost to follow-up (table 1), there was no difference in any demographic characteristic between the intervention group (n=125) and the control group (n=126). There was no difference in dietary sodium intake between the intervention and the control groups; 1503±448 mg/day sodium (salt equivalent 3.85±1.14 SD g/day) and 1513±539 mg/day sodium (salt equivalent 3.87±1.38 g/day), respectively (p=0.434), therefore, both groups were combined for analysis. The average daily sodium intake across 3 days of dietary recalls was 1508±495 mg/day; average daily sodium intake for boys was 1565±560 mg/day (salt equivalent 4.0±1.4 g/day), and for girls was 1452±416 mg/day (salt equivalent 3.7±1.0 g/day). Eighty-seven per cent (n=218) of children exceeded the age-specific recommended daily UL of 1000 mg/day for sodium.
Demographic characteristics for children and mothers who participated in follow-up data collection when the children were 3.5 years old

The derivation of participants in this study of sodium intake at 3.5 years in relation to the design of InFANT.
Participants lost to follow-up
Compared with the participants (mothers) from the follow-up study, the participants lost to follow-up were less likely to be on maternity leave, less likely to have a university qualification, more likely married, born in Australia, and to speak English at home, and the children had a higher BMI z-score. Within the lost-to-follow-up group, there was one father who was excluded from this study for not providing complete dietary data.
Food group contributions to sodium
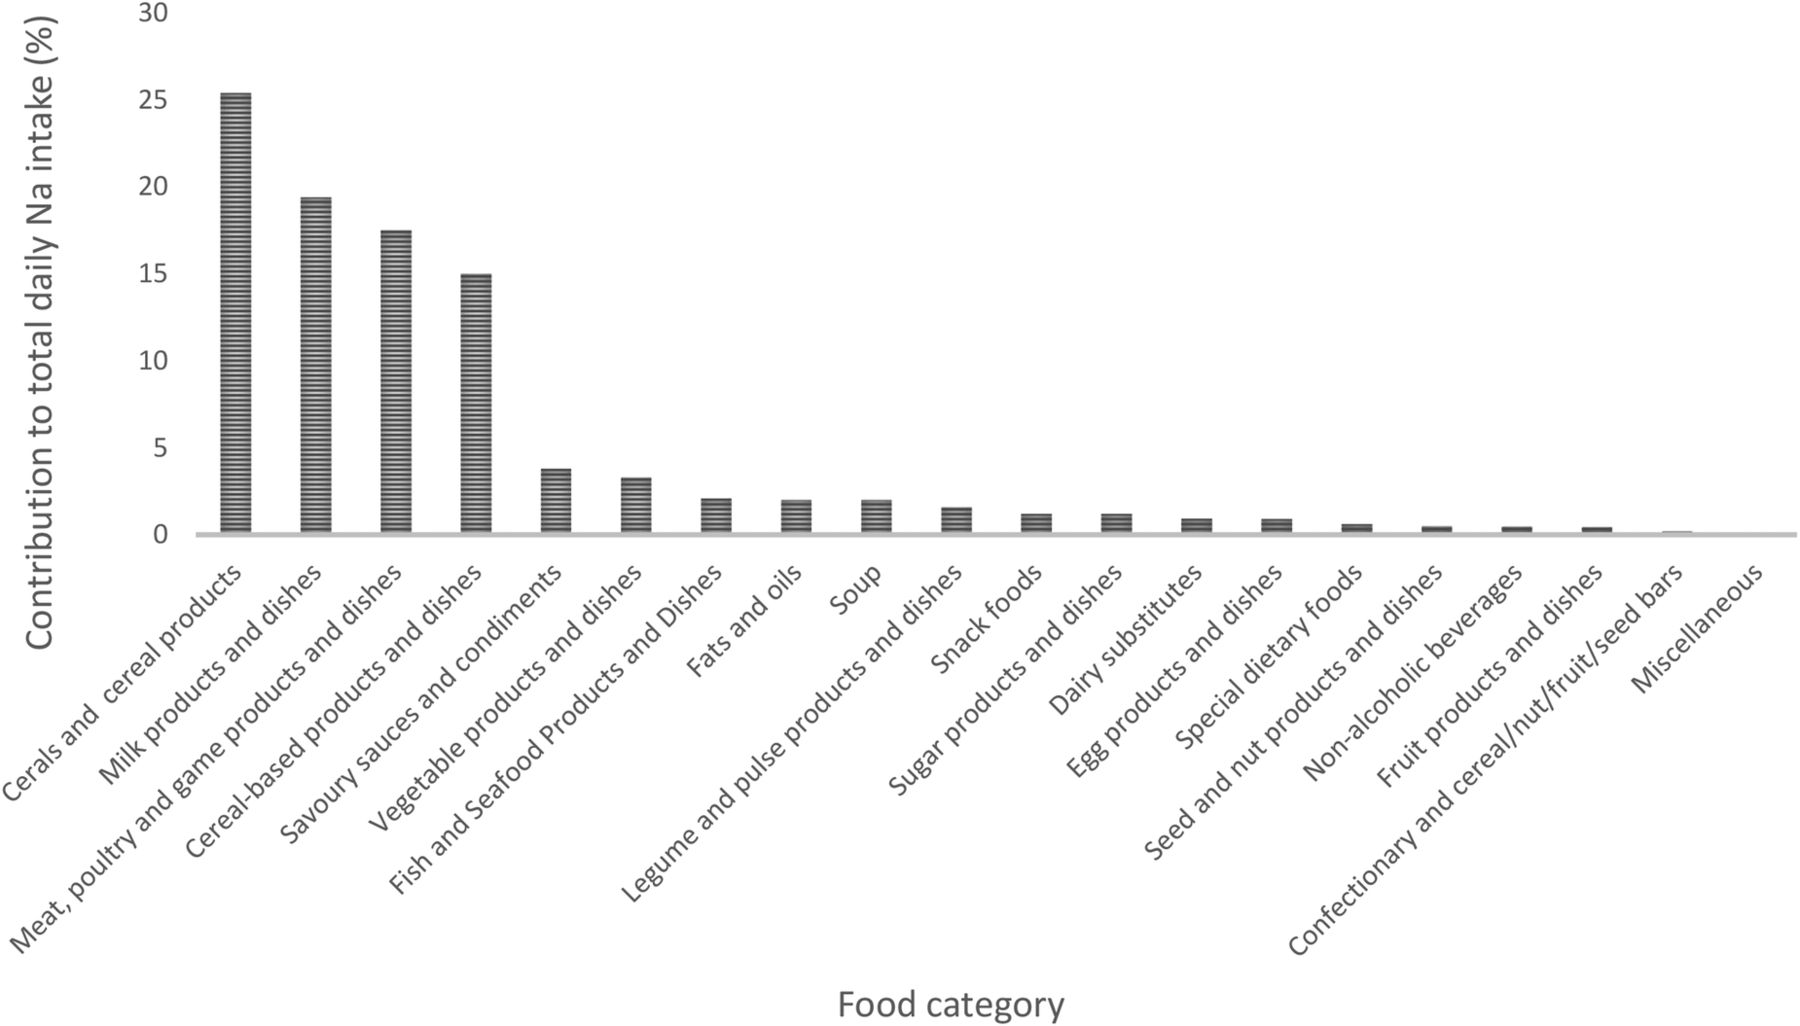
The relative contribution of each major food group to total daily sodium intake is shown in figure 2. The food group, cereals and cereal products, was the greatest contributor to sodium intake, providing approximately a quarter of all sodium consumed (table 2). Other major sources contributing more than 15% of intake were cereal-based products and dishes; meat, poultry and game products and dishes; and milk products and dishes.
The contribution of food groups to individual intakes of energy and sodium intakes

Sources of sodium from major food groups in Australian preschool children (n=251).
Table 2 lists those major, submajor and minor food categories that contributed more than 1% of total sodium intake. Within the cereals and cereal products group, regular bread and bread rolls contributed the greatest proportion of sodium intake (17%), and contributed 10% of total energy, with 97% of children consuming this food group. Within the meat, poultry and game products and dishes group, processed meat made the greatest contribution to sodium intake accounting for 8% of total sodium intake and 1.4% of energy intake, and this food group was consumed by 56% of children. Cheese (9%) and dairy milk (7%) contributed the most sodium within the milk products and dishes group, and collectively provided 18% of total energy. These foods were frequently consumed; cheese: 86% and dairy milk: 94%. Gravy and sauces, sausages and breakfast cereals and bars each provided around 4% of total sodium intake with 7% of total energy collectively.
Over the course of 3 days of food intake, core foods contributed almost twice as much sodium as discretionary foods; 65% and 35% of total sodium, respectively (p<0.001) (figure 3). When classified by degree of processing, ultraprocessed foods contributed the greatest proportion of dietary sodium (48%), followed by processed foods (35%), minimally processed foods (16%) and processed culinary ingredient (1%) (ANOVA p<0.001) (figure 4).

Mean sodium intake over 3 days from core and discretionary foods (see text for meanings of core and discretionary). *p<0.001.

Mean sodium intake over 3 consecutive days: food sources classified by level of processing (see text for further details). **p<0.001.
Discussion
In this sample of Australian preschool children, the average intake of sodium was 1508±495 mg/day (salt equivalent approximately 4.0±1.2 g/day) which is 50% greater than the NHMRC UL of 1000 mg/day for sodium for children aged 1–3 years.10 Within this sample, 87% of children exceeded the UL. In a previous analysis of children from the original InFANT Program at 18 months, Campbell et al17 reported that 54% of children exceeded the UL recommendation for sodium. This increase in the proportion of InFANT participants exceeding the recommended upper levels for sodium intake at the age of 3.5 years is the cause for concern, and likely reflects the continued transition for all children from lower sodium infant foods to sodium-rich foods such as bread, cheese and breakfast cereals. Our findings are similar to the most recent Australian national survey, which reported an average daily intake of 1484 mg/day (salt equivalent approximately 4.0 g/day) in children aged 2–3 years across 1 day of intake,9 and confirms that Australian preschool children's dietary sodium intake is excessive.
The major sources of dietary sodium were cereal and cereal products (eg, bread and bread rolls), meat and poultry products (eg, ham and bacon) and milk product dishes (eg, cheese) which are similar to the key sources of sodium for primary school children aged 4–13 years.23 Earlier analyses of the InFANT cohort at ages 9 and 18 months, also found that bread, cheese and breakfast cereal were major sources of sodium.17 These findings are consistent with the 2011–2013 AHS which indicated that in children aged 2–3 years, the main sources of sodium were cereal-based products (eg, bread), cereal products (eg, mixed pasta/rice dishes), meat (eg, processed meat) and milk products (eg, cheese).9
In this group, discretionary foods contributed 35% of total sodium for children across the 3 days of intake, and more than half the children within our sample consumed discretionary foods such as processed meat. It is a matter of concern that a high proportion of young children are consuming these high-sodium discretionary foods. Importantly, we found that core foods contributed 65% of total sodium for children across 3 days of intake. Although it was expected that core foods such as breads and cereals, which are known to be important contributors of sodium, would make a contribution to daily sodium intake,24 it is concerning that core foods contributed almost twice as much sodium as discretionary foods. It is therefore doubtful that children can reduce their sodium intake below the UL recommendations without the reformulation of core foods to lower levels of sodium.
In Australia, some progress has been made by the Food and Health Dialogue (FHD), a voluntary sodium reduction programme involving food industry stakeholders, to reduce the content of sodium in core and discretionary foods. The FHD has set voluntary sodium reduction targets for nine food categories, and of these, breads, ready-to-eat breakfast cereals and processed meats were scheduled to achieve sodium reduction targets by December 2013.25 Some of the maximum levels of sodium recommended by the FHD include: bread (400 mg/100 g) and processed meats products (1090 mg/100 g ham and bacon, and 830 mg/100 g luncheon meats), and a 15% sodium reduction target was applied to those ready-to-eat breakfast cereals where sodium levels exceeded 400 mg/100 g.23 Despite the progress of the FHD programme, a recent evaluation found that by December 2013, just 67% of all breads met the targeted reduction; approximately half the ready-to-eat breakfast cereals had their sodium content reduced by at least 15%, and less than half the processed meats products had reached their targets.24 In addition, the range of sodium levels across Australian ready-to-eat breakfast cereals varies between 4 and 1063 mg/100 g, and applying only a 15% reduction to those cereals at the uppermost range in sodium levels would still result in the production of ready-to-eat breakfast cereals with excessively high sodium levels.23
In the development of widespread sodium reduction targets across the globe, Australia is falling behind the UK, the USA and Canada.26 The UK has led the way with respect to the product reformulation of lower sodium foods. The UK voluntary salt reduction programme is a multicomponent strategy between the UK government, industry and public health groups, which has been coupled with consumer campaigns and the threat of regulation.26 This comprehensive programme included a set of progressively lower salt targets set by the Food Standards Agency (FSA) for >80 food categories, and between 2001 and 2012, has resulted in a reduction in the salt content of up to 50% in breakfast cereals, 45% in biscuits and 20% in breads.26 Consequently, the average adult sodium intake in the UK has decreased from 9.5 to 8.1 g/day,27 which is the lowest known mean dietary sodium intake for adults of any developed country.28 Thus, the UK has become a proximate model for other countries aiming to reduce the population's salt intake.29
Furthermore, a recent analysis has shown that applying the UK FSA targets to 85 minor Australian food categories, and a 25% reduction on a further 81 minor food categories could reduce the average sodium intake of Australian children aged 2–16 years by 20%.23 Although this 20% reduction is small, modest reductions in the population's salt intake can lead to substantial health and cost effects; in the UK, it has been estimated that the 0.9 g/day reduction in salt intake has led to approximately 6000 fewer CVD deaths, saving the UK economy approximately £1.5 billion per annum.29 It is therefore imperative that there is a strong and coordinated commitment between the food industry and the FHD, to the reformulation of lower sodium food products, for without this, sodium intake will continue to exceed ULs recommended for health, even in our youngest populations.
In addition to demonstrating the contribution of sodium from core and discretionary foods, we also found that ultraprocessed foods contributed the greatest (48%) to total sodium, with processed (34%) and minimally processed foods (19%) contributing less, and culinary processed ingredients contributing the least (1%). Although there are no national recommendations, generally, foods are arbitrarily dichotimised into either processed or unprocessed foods, and the levels and types of food processing are often overlooked, particularly in national guidelines such as the AGHE. Thus, a reduction in the consumption of ultraprocessed foods would be a valuable educational approach in developing an effective strategy to reduce sodium intake in young children's diets.
The major strength of this study was the use of 3 days of 24 h dietary recall data. Importantly, the collection of detailed dietary intake data in this study allowed food sources of sodium to be described, specifically enabling identification of core and discretionary foods and four types of processed foods. The limitations of the study should also be noted; the 24 h recall method fails to capture the amount of salt added at the table and, therefore, is likely to underestimate the true value of salt intake.30 While this is a limitation of our methodology, our understanding that the addition of salt at the table is commonplace would suggest that total sodium intakes are likely to be even higher than reported here. Occasionally, some food product brands may have been unavailable within the food composition data base, and in these instances, dietary sodium assessment may not have been entirely accurate. The NOVA classification is a new processed-food grouping system and although it is not yet a well-established method of assessing diet quality, it has been included in the most recent Brazilian Dietary Guidelines.31 In addition, our sample was subject to selection bias, as those included in the survey were more likely to have a university qualification, more likely to be born in Australia and to speak English at home; and the children had a lower BMI z-score when compared to those who did not participate, which reduces generalisability to the Australian population. However, given the known socioeconomic patterning of diet, whereby lower SES children eat nutritionally poorer diets, these data present the best-case scenario, and it is likely that children in lower SES families will indeed have greater sodium intakes than their higher SES peers.32
In summary, the findings of excessive sodium intake in Australian preschool children, and the identification of sources of key foods provides important evidence affirming the need to reduce sodium in the Australian food supply. Reducing preschool children's sodium consumption could result in a lifelong reduction in dietary sodium intake which is likely to reduce the age-related rise in BP, and represents a significant area for public health action.
Acknowledgments
The authors would like to thank all study participants and the staff involved in InFANT.
References
Footnotes
Contributors SAO performed the statistical analysis and wrote the manuscript. CAG, KEL, CAN and KJC assisted with data interpretation, revision of the manuscript and provided significant consultation. All authors have read and approved the final manuscript.
Funding This research received no specific grant from any funding agency in the public, commercial or not-for-profit sectors.
Competing interests None declared.
Patient consent Obtained.
Ethics approval Ethical approval for InFANT was obtained from the Deakin University Human Research Ethics Committee (ID number: EC 175-2007) and by the Victorian Office for Children (Ref: CDF/07/1138).
Provenance and peer review Not commissioned; externally peer reviewed.
Data sharing statement No additional data are available.