Article Text

Abstract
Objectives A recent study identified patients in six distinct response groups based on their evaluations of outcomes related to overall satisfaction, malpractice and benefit of treatment. This study validates the response clusters by analysing and comparing open-ended comments from the extreme positive and extreme negative response groups.
Design Qualitative content analysis.
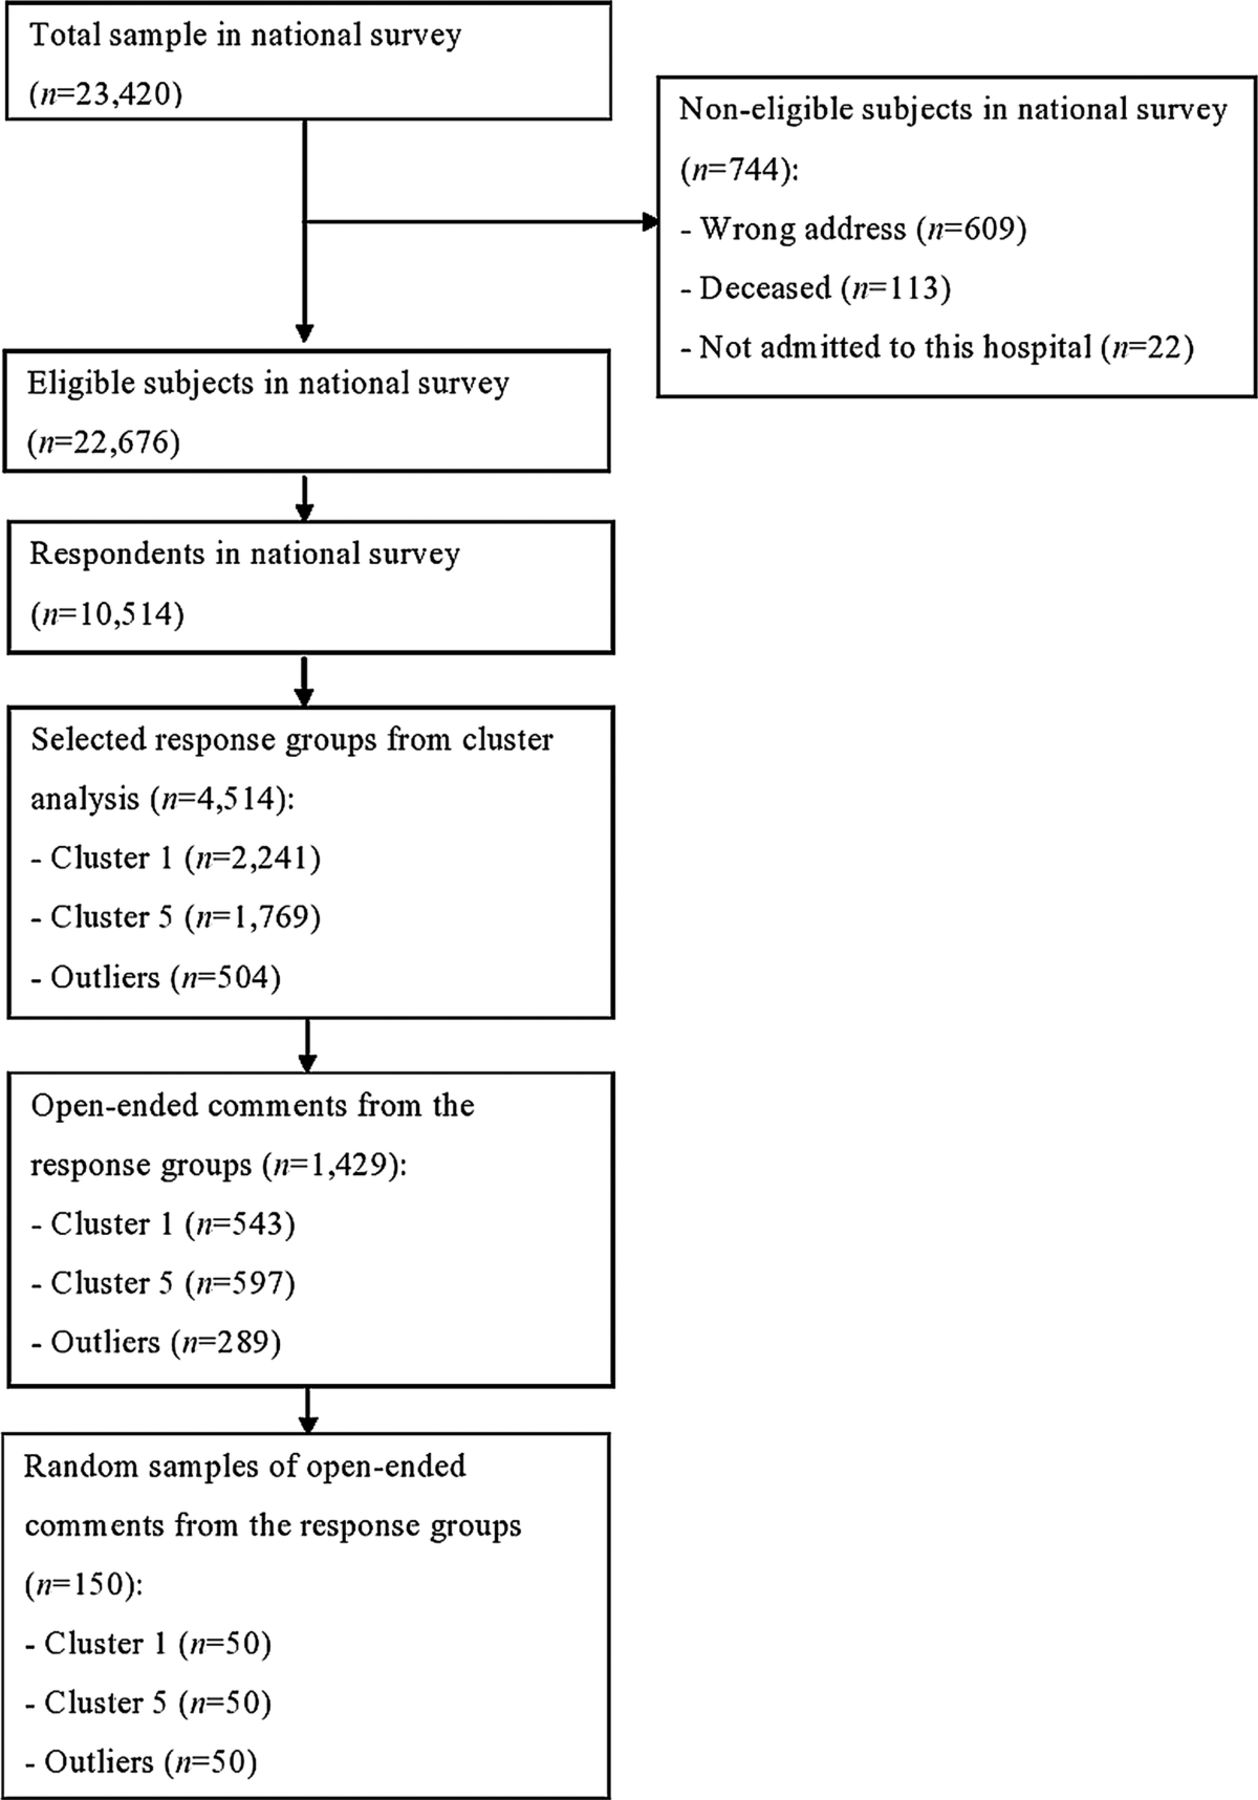
Setting Data from open-ended comment fields provided by patients who completed a national patient-experience survey carried out in Norway in 2011. 10 514 patients responded to the questionnaire and 3233 provided comments. A random sample of 50 open-ended comments from respondents representing cluster 1 (‘excellent services’), cluster 5 (‘services have clear improvement needs’) and outliers (‘very poor services’) was reviewed.
Results 3 distinct patient profiles were identified. More than half of the comments in cluster 1 included descriptions of positive healthcare experiences, one addressed patient safety issues. Only 1 of the comments in cluster 5 was positive, and 12 were related to safety. All comments from the outliers were negative, and more than three-quarters reported experiences related to malpractice or adverse events. Recurring themes did not differ significantly between the three respondent groups, but significant differences were found for the descriptions and severity of the experiences.
Conclusions Patients in negative response groups had distinct and much poorer healthcare descriptions than those in the extreme positive group, supporting the interpretation of quality differences between these groups. Further research should assess ways of combining statistical cluster information and qualitative comments, which could be used for local quality improvement and public reporting.
- Patient satisfaction
- Questionnaire
- QUALITATIVE RESEARCH
This is an Open Access article distributed in accordance with the Creative Commons Attribution Non Commercial (CC BY-NC 3.0) license, which permits others to distribute, remix, adapt, build upon this work non-commercially, and license their derivative works on different terms, provided the original work is properly cited and the use is non-commercial. See: http://creativecommons.org/licenses/by-nc/3.0/
Statistics from Altmetric.com
Strengths and limitations of this study
-
The triangulation of quantitative and qualitative data indicates that the exploration of different response groups provides a fuller and more nuanced understanding of patient experiences.
-
Qualitative analyses help to further the understanding of the types of problems faced by different patient groups, which could in turn help to target improvement initiatives within hospitals.
-
Further investigation of the other response groups, and potentially systematic differences between response groups is warranted.
Introduction
Patient evaluation of hospitals is common, and includes the assessment of patient-reported experiences,1 patient-reported outcomes2 and patient-reported safety.3 These concepts might be combined in the same questionnaire or applied individually, and can be represented by single-item or multi-item scales. One approach used in the past has been to include single-outcome items on core quality components, such as patient centredness, safety and effectiveness, in a patient-reported experience survey.4 This approach reduces respondent burden relative to questionnaires including multi-item scales for all concepts, but it has also been found that responses to generic single items are heavily skewed towards positive evaluations.4 However, clustering on these variables identified six distinct response groups, including negative response groups that comprised almost one-quarter of all patients.4 This clearly indicates that patients perceive that there is a potential for improvement, and stresses the importance of identifying and understanding these groups of patients and the tailoring of improvement initiatives. Previous studies using cluster analysis in this area of research are scarce and heterogeneous, with differences in patient groups, the statistical approach utilised and the number of response clusters identified.5–7 Also, the studies have mostly been small, with questionable external validity.
Most of the experience and satisfaction surveys applied to patients are quantitative in nature, and include at least one open-ended question where respondents are invited to provide comments in free-text format.8 There is a range of error sources in surveys, and effects such as social desirability bias, acquiescence bias and optimising/satisfying that might profoundly affect estimates based on surveys including cluster results. According to Peterson and Wilson, the skewness of satisfaction self-reports is due to many factors, with particular causal importance placed on the research methodologies employed. For example, response rate bias, question form, question context and collection mode bias and the characteristics of individuals.9 Studies have shown that quantitative generic patient surveys have a tendency to overestimate patient satisfaction and patient experiences,9–14 but that qualitative analysis reveals more critical evaluations of healthcare services than does quantitative analysis.15–18
A prerequisite for the usefulness of statistical response groups in quality improvement work is the ability to verify quality differences between the groups. An extreme interpretation of a positive response cluster could be that it is a pure sociopsychological effect related to social desirability bias for individuals in that group, independent of quality, while an extreme interpretation of a negative response cluster could be that this group includes individuals with an extremely negative response style. Therefore, a statistical validation of clusters should be supplemented with other validation sources, including qualitative data.
Obviously, a range of error sources such as social desirability responding, is also a threat in qualitative research. It fully depends on the researcher’s structuring of the responses since by definition the qualitative researcher is part of the process. Another weakness is the subjectivity of the thematic analysis. However, patient experiences are multidimensional, and adding qualitative analysis provides useful information for determining specific areas for quality improvement. Using a mixed-method approach allows findings to be compared and permits a more complete understanding of the issues that are important to patients.19 Closed-ended questions on patient evaluation require respondents to decide on one response category, with a cultural positivity bias pushing towards the most positive categories.9 Open-ended questions are affected by the same bias, however they allow written feedback where patients might combine extreme positive comments with information and comments indicating improvement potential. Consequently, we expect open-ended questions to have the potential of eliciting improvement information also from extreme positive quantitative response groups.
Inclusion of open-ended questions at the end of structured questionnaires has the potential to increase response rates, elaborate on responses to closed-ended questions and allow respondents to identify new issues not captured in the closed questions. A previous study showed that quantitative scores tend to be higher for positive comments than for negative comments, and that qualitative comments help to validate quantitative scores.20 However, many researchers do not analyse or present such data.21 One possible reason open-ended questions are used rarely is a lack of knowledge on how best to collect and present patient’s comments for those who are supposed to use them.14 Furthermore, the amount of scientific literature on how to collect quantitative data is vast, but less has been published in scientific journals about how to collect and handle data from open-ended questions.
The Norwegian Knowledge Centre for the Health Services (NOKC) conducted a national survey of patient experiences with hospitals in 2011. The questionnaire that was used included patient-reported experiences and three outcome items related to patient centredness, safety and effectiveness, in addition to an open-ended question on the last page of the questionnaire for eliciting comments about the respondents’ hospital stay and the questionnaire, and also information regarding potential errors or unnecessary problems experienced at the hospital. The open-ended question was answered by more than 3000 patients. Cluster analysis based on the three outcome items and statistical validation identified six response groups, including a negative response cluster and a heterogeneous outlier group.4 The outlier group scored poorly on all outcome items, but the most striking feature of this group was the extent of perceived malpractice by the hospital. On average, these patients perceived themselves to have been subject to a large extent of hospital malpractice.
The objective of the present study was to substantially validate the response clusters by analysing and comparing the open-ended questionnaire comments from the extreme positive and extreme negative response groups. Based on the cluster analysis and statistical validation, the following hypotheses were proposed: (1) patients in the positive response group describe better healthcare experiences than those in the other groups, and (2) the difference between the negative response and outlier groups is related mainly to the presence of more negative safety issues in the latter.
Methods
Questionnaire
The patient-experience questions in the national survey were based on the Patient Experiences Questionnaire,22 and comprised 73 closed-ended items, in addition to an open-ended question on the last page for eliciting comments about the respondents’ hospital stay and the questionnaire. The patients were also asked for information regarding potential errors or unnecessary problems experienced during or after their hospital stay or related to previous stays at the hospital. Most closed-ended experience items had a five-point response format ranging from ‘not at all’ to ‘to a very large extent’. Thirty-five items related to patient experiences with structures, processes and outcomes of healthcare were aggregated to 10 quality indicators in the national report.
Data collection
The national survey included a random sample of adult inpatients selected from 61 Norwegian hospitals between 1 March and 22 May 2011. Non-respondents were sent up to two postal reminders. In total, 23 420patients were included in the study, but 744 were not eligible for participation. The hospitals transferred data about the included patients to the NOKC. The questionnaire was answered by 10 514 patients (response rate: 46%). The Data Inspectorate and the Norwegian Ministry of Health and Care Services approved the survey.
Analysis
Qualitative data were obtained from the open-ended comment fields provided by patients who completed the national survey. A total of 3233 patients provided comments.
The previously reported cluster analysis identified five response clusters and a group of outliers.4 The following three single items were used as outcome variables: patient-perceived malpractice, overall satisfaction and benefit of treatment. The clusters were enumerated as follows4:
-
‘Excellent services’ comprised 23.5% of the patients and had close to the top score for all three outcome items.
-
‘Very good services, but not totally satisfied’ comprised 7.2% of the patients and resembled cluster 1, but scored significantly lower than average for satisfaction.
-
‘Very good services, but not totally beneficial’ comprised 15.6% of the patients, and while it also resembled cluster 1, it scored significantly lower than average for the benefit of treatment.
-
‘Good services’ comprised 30.0% of the patients and had average scores for the three outcome items.
-
‘Services have clear improvement needs’ comprised 18.5% of the patients and had significantly lower-than-average scores for all outcome items.
Cluster analysis also revealed a group of outliers who perceived services as being very poor on all outcome items (5.3% of the patients). The outlier group is not a cluster in a statistical sense, because of the amount of internal variance on general satisfaction and benefit of treatment. Accordingly, the group is too heterogeneous to form a cluster.
It was considered relevant to explore the comments from the most distinct response groups identified in the first study and consequently we chose the extreme positive and extreme negative response groups for analyses. A random sample of 50 open-ended comments from respondents representing cluster 1, cluster 5 and the outliers were reviewed by a senior researcher using content analysis. The analysis flowchart in figure 1 provides information about the number of participants in each stage of the process. A second senior researcher independently coded the same samples. Any coding ambiguities were resolved through discussion and joint agreement.
Analysis flowchart.
The main objectives of this study were to determine whether the open-ended comments were of a positive, negative or neutral character and whether the comments addressed patient safety issues, potential errors or unnecessary problems related to the hospital stay. Content was then coded based on major themes and subgroups within the themes. Each open-ended comment was analysed systematically in an iterative manner by creating a thematic coding structure. When new themes emerged, the coding structure was revised and the previous comments re-read to determine congruence with new themes. This type of approach does not enable further quantitative analysis, but the number of responses in each subcategory is given to indicate the magnitude. Differences between patients who provided comments and those who did not were assessed for each of the three response groups by independent-samples t test and χ2 tests.
Results
Table 1 lists the patient characteristics for the three response groups. No statistically significant differences were found between patients who provided comments and those who did not for age, native language, marital status or self-perceived health status in any of the response groups. However, a significant difference was found for gender in cluster 5 (p<0.001), with fewer men in this cluster providing comments. The educational level was higher for those who provided comments in clusters 1 (p<0.01) and 5 (p<0.001) and the outliers (p<0.01). Moreover, fewer of those who did not provide comments in the outlier group reported work as their main activity (p<0.01) compared with those who did provide comments in this group.
Patient characteristics in three response groups
Cluster 1—‘excellent services’
The 50 comments from cluster 1 included 25 comments that described positive patient experiences and 15 that described negative experiences. Nine comments reported positive and negative experiences, while one was impossible to characterise as either positive or negative and was considered neutral. Only one comment was related to patient safety issues, and included a description of reoperation and infection.
Fifteen comments did not address any specific theme, but gave general, positive feedback to the hospital:
-
Everything was excellent.
-
Nothing to complain about.
Other patients were more specific in their comments:
I think the hospital is a good place to be. Everyone is friendly and cares for you. Nice and friendly doctors, nurses, physiotherapists and kitchen maids.
The four main themes that emerged from the content analysis were organisation, information and communication, hospital standards and transportation and health personnel.
Every fifth comment was about organisation; related to discharge, follow-ups and waiting time. One patient represented the views of several patients by stating the following:
I was satisfied with the stay, but could have wished for a tighter follow-up after the operation.
The eight comments regarding information or communication addressed information regarding illness, treatment and side effects, and patient communication with doctors. For example, one patient wrote:
I would have liked to talk to a surgeon before I left the hospital. I had a few questions regarding the operation and my medication. I did not get sufficient enough answers from the nurses. I called the hospital when I got home and then finally a surgeon contacted me and gave me some answers.
Six comments were related to cleanliness, the room standard, food and transport services. One patient commented:
I think five hours between each meal is too long. Some patients have no appetite after surgery and had needed food more often. Sanitary conditions were also poor, only one bathroom and one shower.
Comments specifically addressing health personnel were all positive.
-
Doctors and nurses who take patients seriously.
-
Greeted with warmth and care from nurses and physicians.
Cluster 5—‘services have clear improvement needs’
Of the 50 comments from cluster 5, 39 described negative patient experiences and only 1 described positive experiences. Three comments reported positive and negative experiences, while seven were impossible to characterise as either positive or negative. Twelve comments were related to patient safety issues, and addressed complications related to operations, infections and medication:
I think the doctors did a poor assessment. I was discharged, recommended twenty painkillers a day. Two months have passed and I am not able to work and still have a lot of pain.
The day I was supposed to be discharged, I was infected by a virus and had to be in solitary confinement for several days.
The main themes emerging in these comments were organisation, information and communication, hospital standards, and transportation and health personnel, but pain treatment and administration of pain medication were also introduced as important themes in these comments.
More than one-third of the patients acknowledged organisation as an important issue. The comments reported incidents related to coordination and cooperation within the hospital and between the hospital and other health services. One patient reported the following:
Information was sent to the hospital 4 weeks prior to the hospitalization, but was not registered when I arrived. I was transferred from one unit to another at the hospital, which caused lots of misunderstanding.
Other patients reported delays before examinations and treatments, and one patient wrote:
It took three days to conduct tests and examinations that could have been done in a few hours. That caused me much unnecessary pain and frustration.
Every fifth comment described experiences related to information and communication. Some patients reported lack of information regarding their illness, treatment, discharge, side effects or medication. One patient wrote the following:
I wish I had more information about the cause of my illness and what I should do if the condition reoccurs.
Others had not been able to communicate in a satisfactory way with health personnel, and some felt that they themselves were responsible for gathering crucial information.
The nurse was not able to answer my questions, and asked me to address the doctor. When he finally came he was in a hurry and gave me the impression that I already should have been informed about everything.
The nine comments about hospital standards addressed the chances to rest, the standard of the room and equipment, and transportation services.
Five comments in cluster 5 also described negative experiences with pain treatment and administration of pain medication. One patient described the following experience that could also be related to patient safety:
The pain treatment did not work sufficiently, and I was in great pain during and after surgery. I also got infarction related to the operation but this was not discovered and recognized until next day.
Health personnel were specifically emphasised in four comments, describing positive and negative experiences.
The negative outlier group
The analysis of open-ended comments from the outlier group showed that all included negative experiences; however, a positive remark was also added in five of the comments. A total of 38 comments described experiences that can be related to patient safety, the majority addressing operations, reoperations or other treatments associated with complications or repercussions. Medication-related errors were also an important theme in the comments, either lack of medication or wrongly administered medication. One patient reported the following:
I was initially not told about a substantial error that had occurred during surgery. I lost confidence in the doctors, and had also extensive problems with infections in the surgical wound.
A relative described the following:
My mother was given medication that could have killed her. She was also given the wrong diagnosis at the hospital.
Content analysis revealed that more than 20 comments from the outlier group addressed organisation, coordination or waiting time, such as the following:
No one knew when the doctor was going to show up on the ward, nor which doctor it would be. The ward seemed unorganized and chaotic.
It feels stressful having to relate to many different doctors and repeat my story many times.
I was admitted to the hospital in great pain. They said that they would do something with my condition, but I was discharged after three days and promised new hospitalization after two weeks.
A relative noted the following:
She had to lie in the emergency room for 8 hours in great pain and without pain-relieving medication, food or water. When she was finally moved to the ward, she was left in the corridor overnight.
Eighteen patients specifically commented on health personnel, mostly related to relational aspects and professionalism, with only a few reporting positive experiences. Two more patient comments addressing the health personnel:
I wished that the doctors had taken my concerns and condition more seriously, especially because this condition is the reason why I am handicapped. The patient must be heard!
I felt that I was a burden for doctors and nurses.
Seven comments were about information or communication, describing the need for more information regarding treatment, side effects and health personnel not adjusting the communication to the specific situation or patient. All comments regarding information or communication described negative experiences. Six comments were about the food or the standard of the hospital or equipment.
Table 2 summarises the number of positive, negative, positive and negative and neutral comments and number of comments that addressed patient safety issues, potential errors or unnecessary problems related to the hospital stay for each response group.
Summary of the frequency of comment type by response group
Discussion
The current study based on an analysis of open-ended comments found that patients in the respondent group representing cluster 1 (‘excellent services’) included some negative experiences, but all in all these patients were mostly satisfied with the hospital, their treatment and the health personnel, and only one comment highlighted patient safety issues. These results are in contrast with the results for cluster 5 (‘services have clear improvement needs’) and the outlier group (‘very poor services’). Recurring themes did not differ markedly between the three respondent groups, but the descriptions and severity of the patient experiences did. Both study hypotheses were supported: distinct patient experiences were found between the positive and negative response groups, and the main difference between the two negative response groups was the large number of safety issues raised by the outlier group.
A previous study showed that those in the most positive response group quantitatively scored hospital outcomes related to patient centredness, effectiveness and safety in the top-box category.4 The quantitative scale scores for patient experiences in the current study were also high, but not in the top-box category. The qualitative analysis in this study confirmed the positive experiences in this group, but also showed that 16 of the 50 comments described negative experiences and 9 included negative and positive experiences. This clearly indicates that qualitative data provide a more negative view of patient experiences than quantitative data do, in line with previous research.15–18 It also supports research showing that high levels of satisfaction do not necessarily equate to outstanding care.23 Consequently, the label of ‘excellent services’ for this cluster is a poor description, and should be changed to a more objective evaluation of hospital services, such as ‘most-positive response group’. The negative response groups were confirmed in the qualitative analysis, but the label for the outlier group could be changed to ‘poor safety’. The qualitative findings for this group indicate that patient-perceived safety is also affected by factors other than safety incidents, such as organisation, information and communication, in line with previous research.3
Having established from the qualitative analysis that the participants in different statistical response groups have distinct underlying patient experiences, a mixed-method approach can be used to improve the reporting of findings from the survey. For instance, the current reporting to hospitals includes detailed results on 10 indicators and 35 single items, in addition to case-mix-adjusted indicators benchmarked against the national average. The qualitative data are analysed and reported at the national level, but not at the hospital level. The current reporting can be improved by presenting the percentages of patients in negative response groups for each hospital, and then randomly selecting, analysing and presenting 50 qualitative comments from each hospital. The percentage of cases falling in negative response groups would be welcomed by patients and the public since ‘less is more’ when presenting quality information to consumers.24 The combined cluster and qualitative reporting approach would also be welcomed by hospitals trying to improve their quality of care, since the percentage of patients in negative response groups would be a highly accessible overall indicator of the improvement potential, while the 50 comments would give direction to improvement areas and concrete initiatives. Patient-centred care means that individual needs, wishes and preferences are at the centre of healthcare,1 the described approach would ensure that local needs and experiences are systematically fed back to local quality improvement.
The methods used to analyse and report these data should be researched further. For instance, it would be useful to know how patient confidentiality can be secured when including qualitative comments from individual patients. It is also important to further investigate cluster profiles and the distribution of clusters across wards/departments, diagnosis and other clinical characteristics that are of importance to local quality improvement. Patients conduct posthospital evaluations, but if certain clinical characteristics have an increased probability of negative patient experiences, this could signal the need for extra effort in certain diagnostic procedures or wards/departments. It is also important to standardise the methodology on response clusters in patient evaluations, especially with regard to handling of outliers and choice of cluster variables. The previous study recommended excluding outliers from cluster formation, but including them in the interpretation of patient clusters.4 Obviously, from a quality improvement perspective this group is highly relevant. We have developed a method that is highly relevant in other countries. The cluster solutions might differ between groups, countries and over time, but the statistical cluster approach combined with analysis of open-ended comments is relevant across countries and patient groups.
This study was subject to some limitations. First, it is not possible to quantify the generalisability of the qualitative findings within statistical clusters. The percentage of patients in each cluster varied from 5.3% to 23.5%. The sociodemographics were broadly similar for cluster patients with and without open-ended comments, but those who made comments had higher levels of education in all three response groups. There could also be other systematic differences between these groups, such as those choosing to answer the open-ended question either being more articulate or having a greater interest in the survey topic.20 It is important to determine how to increase the proportion of patients writing open-ended comments. Second, the main area of interest in this study was the underlying differences in patient experiences between contrasting groups. Future research could use the same methodology to assess the other response groups. Third, the open-ended question in the questionnaire used patient safety as an example of relevant topics to describe. This could have affected the number of comments in each cluster, and the types of issues raised. For instance, almost 60% of the outlier cluster wrote comments, compared with only 24% in cluster 1.4 However, patients in all groups were asked the same question but responded differently according to our analyses. Fourth, the connection between poor health and quality or safety issues is poorly understood. The previous statistical cluster analysis confirmed the over-representation of patients with poor health in the negative response groups,4 while the current study aimed to analyse open-ended comments from extreme response groups. Further analysis of existing data is one possible avenue to better understand the connection between health and quality or safety issues; however, we believe that more data are needed to fully describe and understand this issue. One possible approach is to use a longitudinal design in forthcoming surveys, where identification of extreme clusters with poor health in the first survey is followed with one or more additional surveys specifically asking about the health situation and the connection to quality or patient safety incidents. The latter could also be conducted as semiqualitative interviews.
Conclusions
Patients in the negative response groups had distinct and much poorer healthcare descriptions than those in the extreme positive group, supporting the interpretation of quality differences between these statistically derived groups. The triangulation of quantitative and qualitative data indicates that the exploration of different response groups provides a fuller and more nuanced understanding of patient experiences. Qualitative analyses help to further the understanding of the types of problems faced by different patient groups, which could in turn help to target improvement initiatives within hospitals. Consequently, the results have implications for quality improvement work.
Acknowledgments
The authors thank Tomislav Dimoski for managing the data collection, developing the FS system and carrying out the technical aspects of the survey, and Marit Skarpaas, Sinan Akbas and Ulla Benedicte Funder for administrative help in data collection.
References
Footnotes
-
Contributors HHI planned the paper together with OAB and KES, carried out the statistical analysis and drafted the paper. OAB and KES participated in the planning process, revised the draft critically. All authors have read and approved the final manuscript.
-
Funding This work was financed by the Norwegian Knowledge Centre for the Health Services (NOKC).
-
Competing interests None.
-
Ethics approval The Data Inspectorate and the Norwegian Ministry of Health and Care Services.
-
Provenance and peer review Not commissioned; externally peer reviewed.
-
Data sharing statement No additional data are available.