Article Text

Abstract
Objectives To examine and interpret the variation in the incidence of blindness and sight impairment in England by PCT, as reported by the Certificate of Vision Impairment (CVI).
Design Analysis of national certification data.
Setting All Primary Care Trusts, England.
Participants 23 773 CVI certifications issued from 2008 to 2009.
Main Outcome measures Crude and Age standardised rates of CVI data for blindness and sight loss by PCT.
Methods The crude and age standardised CVI rates per 100 000 were calculated with Spearman's rank correlation used to assess whether there was any evidence of association between CVI rates with Index of Multiple Deprivation (IMD) and the Programme Spend for Vision.
Results There was high-level variation, almost 11-fold (coefficient of variation 38%) in standardised CVI blindness and sight impairment annual certification rates across PCTs. The mean rate was 43.7 and the SD 16.7. We found little evidence of an association between the rate of blindness and sight impairment with either the IMD or Programme Spend on Vision.
Conclusions The wide geographical variation we found raises questions about the quality of the data and whether there is genuine unmet need for prevention of sight loss. It is a concern for public health practitioners who will be interpreting these data locally and nationally as the CVI data will form the basis of the public health indicator ‘preventable sight loss’. Poor-quality data and inadequate interpretation will only create confusion if not addressed adequately from the outset. There is an urgent need to address the shortcomings of the current data collection system and to educate all public health practitioners.
- Public Health
- Ophthalmology
This is an open-access article distributed under the terms of the Creative Commons Attribution Non-commercial License, which permits use, distribution, and reproduction in any medium, provided the original work is properly cited, the use is non commercial and is otherwise in compliance with the license. See: http://creativecommons.org/licenses/by-nc/2.0/ and http://creativecommons.org/licenses/by-nc/2.0/legalcode.
Statistics from Altmetric.com
Article summary
Article focus
-
To examine and interpret the variation in the incidence of blindness and sight impairment in England by PCT, as reported by the Certificate of Vision Impairment (CVI).
-
To assess whether there was any evidence of association between CVI rates with the Index of Multiple Deprivation (IMD) and the Programme Spend for Vision.
Key messages
-
There is a wide geographical variation in the rates of certification of blindness and sight impairment across England.
-
The wide geographical variation we found raises questions both about the quality of the data and whether there is genuine unmet need for prevention of sight loss.
-
The certification (CVI) data form the basis of the ‘preventable sight loss’ indicator in the ‘Public Health Outcomes Framework’ and improving the quality and interpretation of the data will be vital.
Strengths and limitations of this study
-
A prospective routinely collected national dataset was used for analysis giving accurate data on certification rates across England.
-
There were relatively small numbers of certification for each PCT and therefore there is a possibility of over-estimation of the variation.
Introduction
Eye care services have traditionally not featured highly in national health policy or the public health agenda. In the UK there has been no Department of Health-led eye care services strategy and there is no mention of eye health in the recent NHS or Public Health White papers.1 ,2 The UK, however, does have a Vision Strategy produced by a collaboration of eye care organisations, professionals and patients in response to the World Health Assembly Resolution of 2003. This resolution urged the development and implementation of national plans to tackle sight impairment, to which the UK government pledges its support.3 VISION 2020 was launched by the WHO and the International Agency for the Prevention of Blindness in order to bring together governments, eye care professionals and patients to work towards the global goal to eliminate avoidable blindness by the year 2020.4
However, this year the new Public Health Outcomes Framework has included an indicator for preventable sight loss, constituting a major step forward for the recognition of eye health on the public health agenda.5 This indicator will be based on the Certificate of Vision Impairment (CVI)—this being the only routinely collected national measure of blindness and sight impairment.
The NHS Atlas of Variation has highlighted the variations in healthcare activity, expenditure, quality and outcomes in the UK.6 This has brought to attention the need to address unwarranted variation, focusing on the appropriateness of the clinical services and their outcomes. The most recent edition of the Atlas published last year included the rate of sight impairment and blindness due to diabetes (as measured by CVI), which showed a high level of variation (eightfold), and raised concerns, particularly as there is a diabetic eye screening programme already in place. With an ageing population and rising incidence of diabetes, the prevalence of sight loss has also been predicted to increase significantly over the next decade.7 ,8 The total costs of sight loss in the UK were estimated at £6.5 billion in 2008 with £40 million per million population being spent on eye care services last year in England.9 With rising costs from expensive medications for age-related macular degeneration (AMD) and other diseases there will be huge pressures on the eye care budget in the coming years. The adoption of an indicator for preventable sight loss will be a vital part of monitoring eye care outcomes. However, public health practitioners will need to know that the quality of the data is adequate and how to interpret the CVI rates. In this paper we examine, for the first time, the geographical variation of blindness and sight impairment, as measured by the CVI.
Methods
CVI data collection
The CVI form is discussed in the hospital clinic with patients who are eligible, and is completed with patient consent by a consultant ophthalmologist. Currently, a paper version is completed which is sent to the local authority social services who use this to update their visual impairment register. Every 3 years, the social service departments complete an annual return which is sent to the Information Centre for health and social services reporting the number of new registrations and the total number of registrations in their register. This return is mandatory. Another copy of the CVI form is sent to the Certifications Office, Moorfields Eye Hospital NHS Foundation Trust for epidemiological analysis. This return is voluntary but there is a good rate of compliance (correlation coefficient 0.9 between the number of certifications and the number of registrations by unitary authority).10 Data held by the Certifications Office have more detailed information on the causes of registration and allow incidence data calculation. For this study, the data from the 2008/2009 CVI forms collected by the Certifications Office were used.
Calculation
Two rates were used for the analysis, the crude rate and the directly standardised rate (DSR). The crude rate is the number of CVI forms divided by the population of that Primary Care Trust (PCT). The DSR was determined using age-specific CVI rates with Office of National Statistics 2008 figures by PCT. The standard population was that for England 2008 mid-year population. The SD and coefficient of variation were then calculated.
Standardisation was used as a means of ensuring that any differences seen between PCT populations were not as a result of differing age structures. As the numbers of CVI forms in each PCT were relatively small, standardisation was conducted using three age bands (0–15, 16–64 and 65 plus). We chose direct rather than indirect standardisation because we wished to compare PCTs with each other and indirect standardisation would not have allowed this.11
The coefficient of variation is calculated by dividing the SD of the rates by the mean rate.12 As it is relatively insensitive to population size, it provides a more powerful measure of variation than the SD when there are variable population sizes in the data set. One disadvantage is that it may overestimate the amount of variation if rates are low or if it is applied to small populations.
To eliminate the possibility of artefact from outliers in the data sets, the degree of variation was calculated as the range within the data after exclusion of the five PCTs with the highest and the five with the lowest values. Fold variation was determined as the upper limit of the trimmed range divided by the lower limit of the trimmed range.
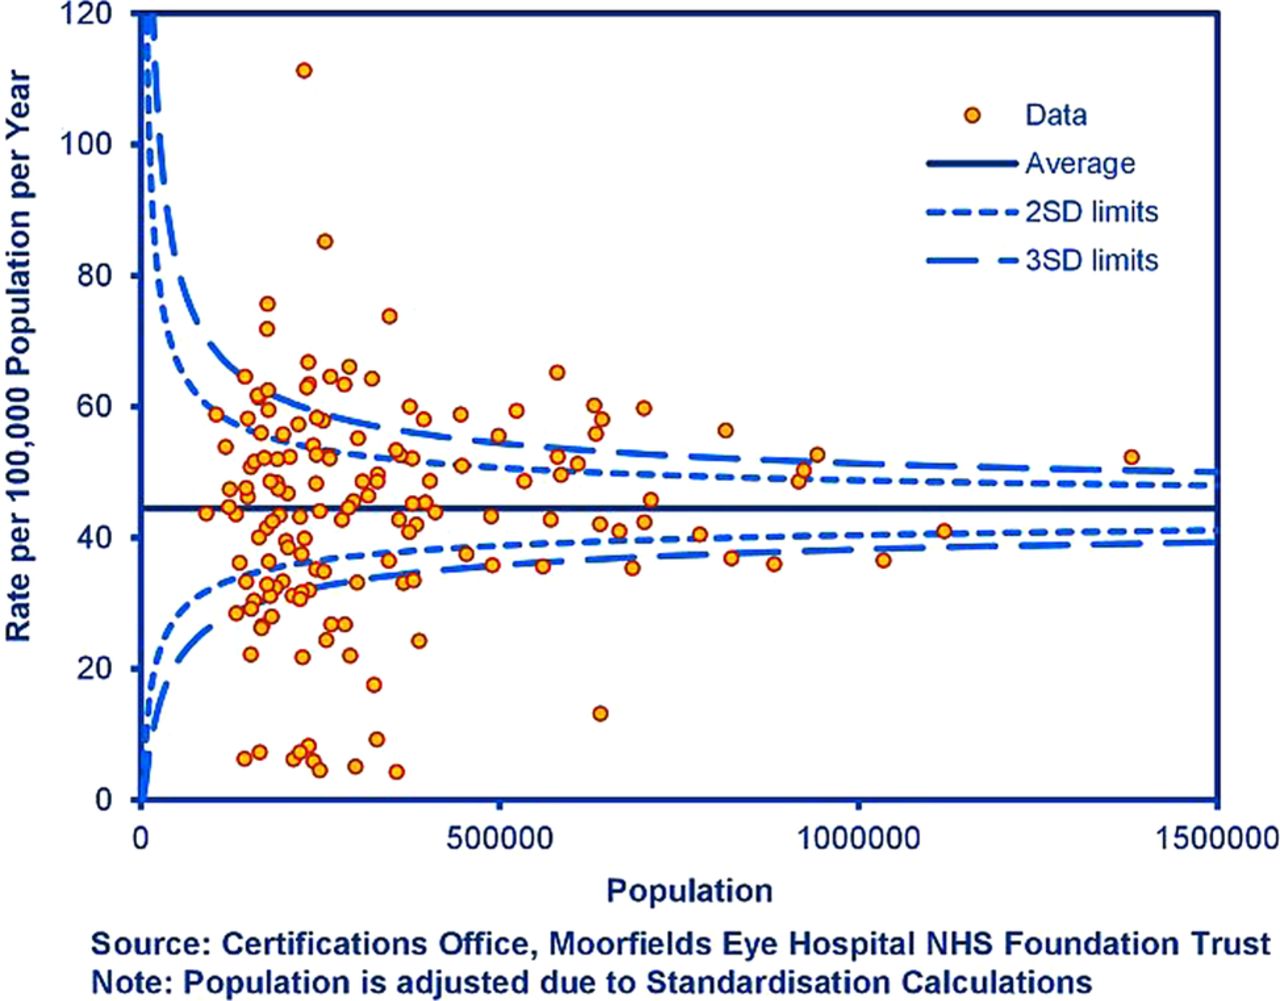
A funnel plot was constructed to examine whether or not the rate of certification was related to the size of the population and to examine whether there was a relationship between the estimate size and the precision of that estimate.
Comparison with Index of Multiple Deprivation
The Indices of Deprivation (ID) is a measure of social deprivation prepared by the Department of Communities and Local Government. The English ID measures relative levels of deprivation in small areas of England.13 The English ID2010 use 38 separate indicators, organised across seven distinct domains of deprivation, including income, employment and health. The latter can be combined, using appropriate weights, to calculate the Index of Multiple Deprivation 2010 (IMD 2010). The IMD is used to help decide the allocation of resources to PCTs. Scatter plots of the CVI rates with the IMD were drawn and correlation coefficients were calculated.
Comparison with spend on vision
In the UK each PCT receives its healthcare budget allocated by programme area. There are 23 main programmes, broadly corresponding to the chapters in the WHO ICD-10, for example, cancers and tumours, mental health disorders. The eye care services budget comes under the vision programme budget. This includes NHS sight tests as well as all primary care prescribing, community services, inpatients and outpatients expenditure. Scatter plots of CVI rates against spend on vision were examined and correlation coefficients calculated to assess whether there was any evidence of association between spend versus CVI blindness and sight impairment rates.
Converting data to maps
The data are shown as a map of England with London shown as an inset on the PCT maps so that the details of the small areas are not lost. The PCTs have been grouped into ranges to allow a comparison of areas on the map with ease. The method used to group the data into ranges is quantiling. Quantiles build ranges (in this case five were chosen) to display the distribution of the variable. This is calculated by ranking the data values from highest to lowest and then splitting the values into five ranges, which do not necessarily contain equal numbers. The ranges are from the lowest (light blue) to the highest value (dark blue). The map was produced in Adobe Illustrator.
Results
There were 23 773 CVI certifications for 2008/2009 in England. Table 1 summarises the degree of variation, SD and coefficient of variation. It shows that after standardisation there is approximately an 11-fold variation in the number of CVIs. A coefficient of variation of 0.38 or 38% indicates marked variation in CVI registration.
Summary of Certificate of Vision Impairment (CVI) certifications with the mean, SD, coefficient of variation and degree of variation
Figure 1A and B show the directly standardised rates of sight impaired and blindness per 100 000 in England, in 2008–2009 in the form of a map, as detailed in the methods. The map illustrates a fairly uniform distribution of variation, although there is a cluster of relatively low CVI registration in the West of England. This would require further study including a time trend to explore whether this is a repeating trend over 5–10 years. There is otherwise very little evidence of a geographical explanation for the variation such as a ‘north-south divide’.15

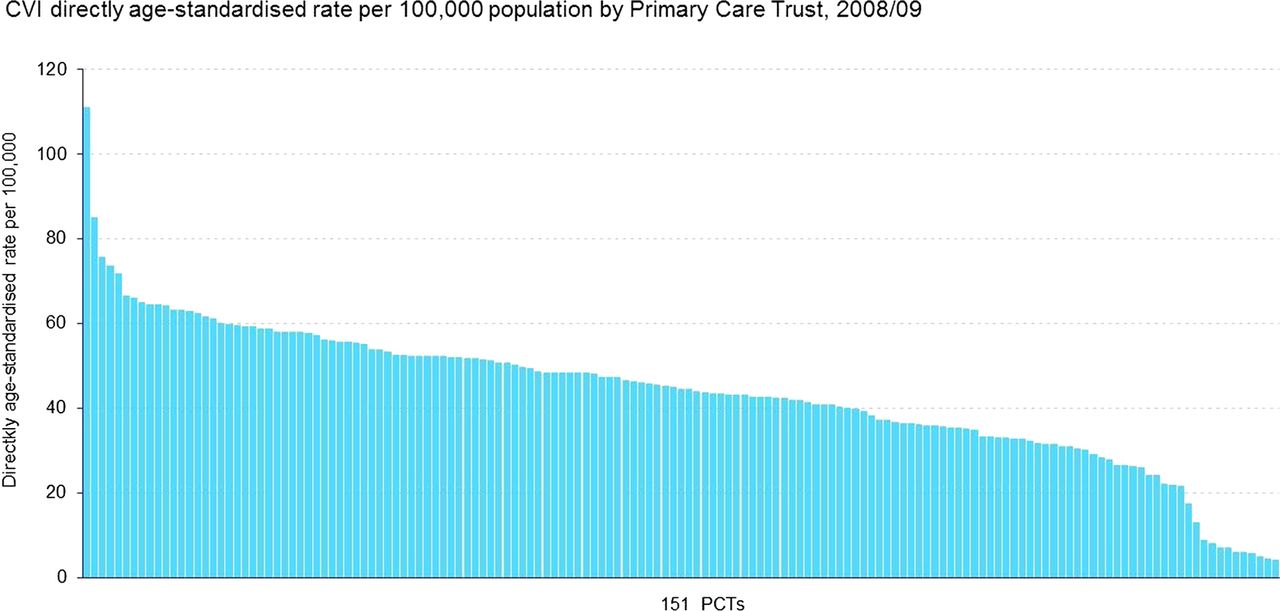
(A) Map and (B) bar graph of geographical variation of in blindness and sight impairment rates in England.
Figure 2 displays the CVI-standardised rates per 100 000 versus the IMD 2010 by PCT. The figures illustrate a very weak association between the CVI rates and IMD 2010 (correlation coefficients 0.11, p=0.15). It is therefore unlikely that deprivation is the only cause for the 11-fold variation seen in CVI registration rates.

Certificate of Vision Impairment (CVI) directly age-standardised rate per 100 000 versus Index of Multiple Deprivation 2010 by Primary Care Trust, 2008/2009.
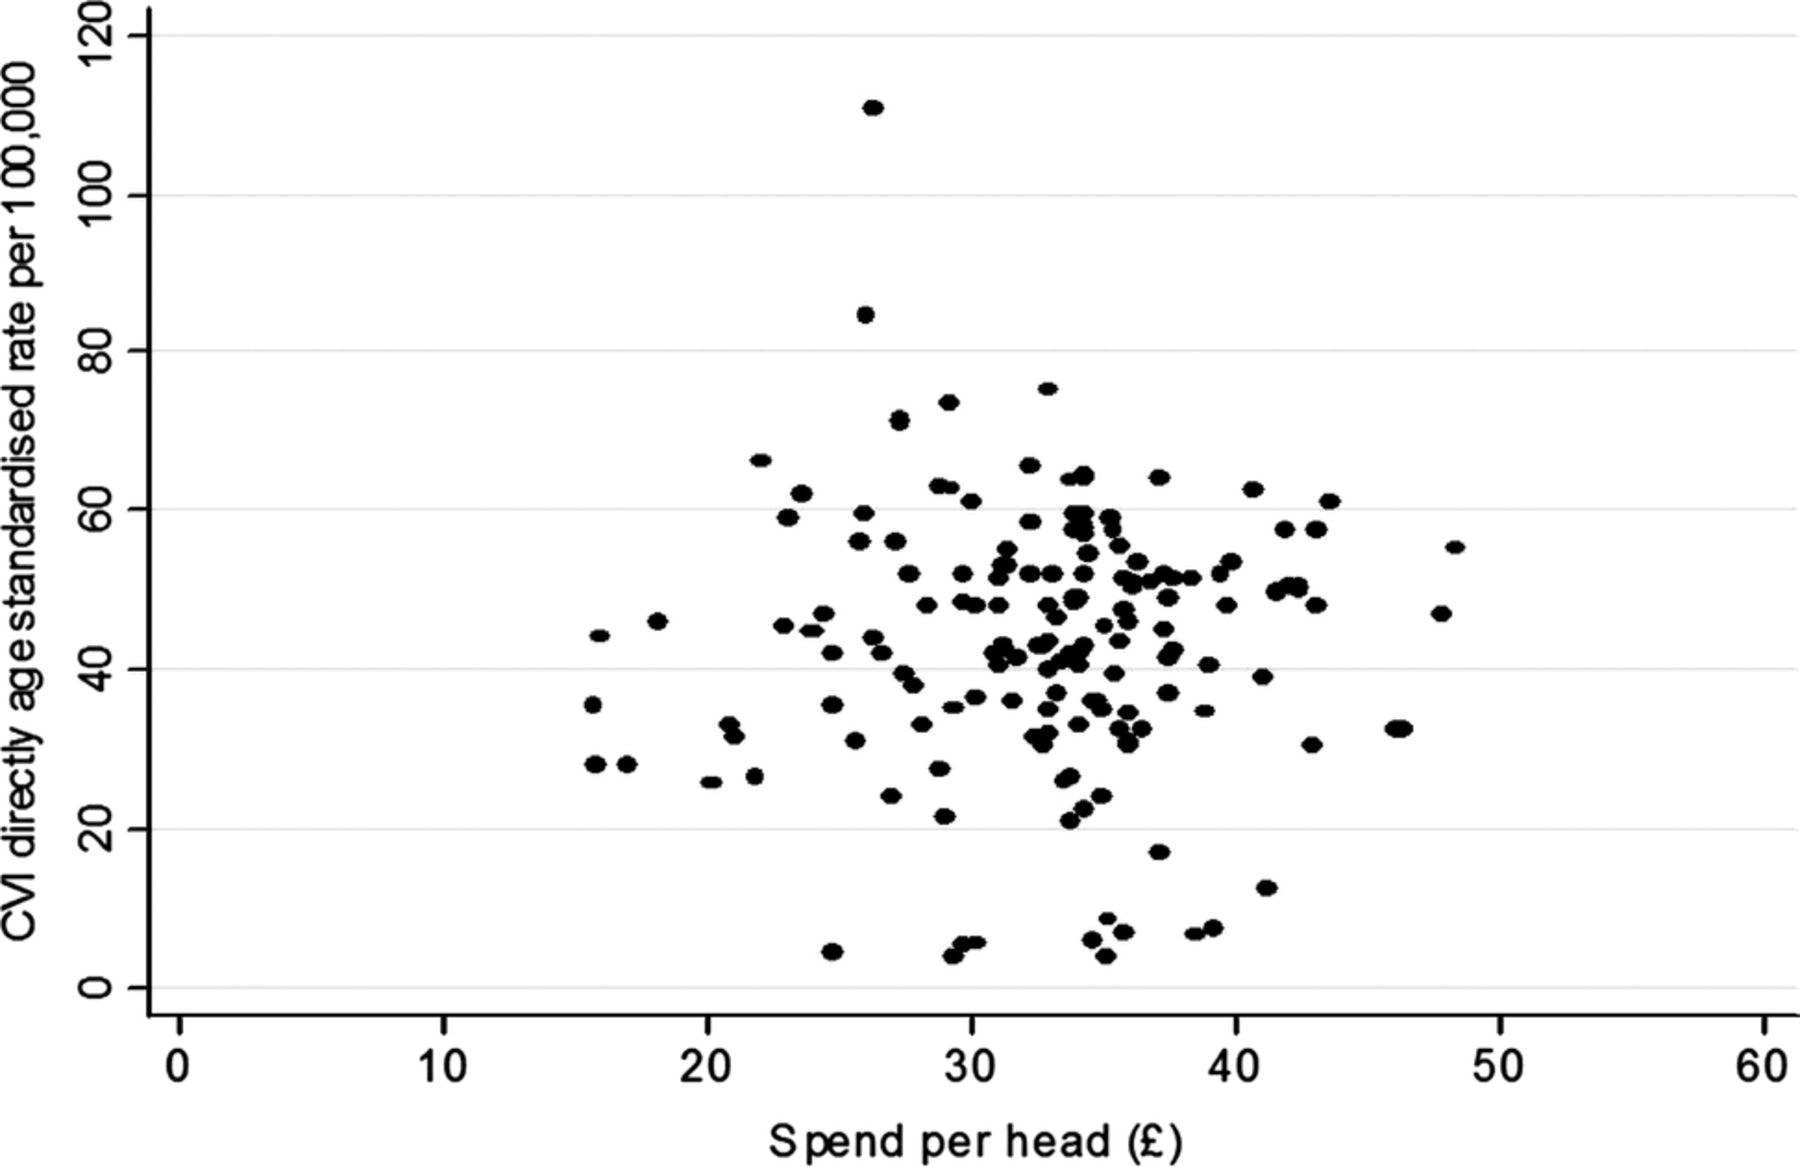
Figure 3 displays the CVI-standardised rates per 100 000 versus the spend per head by PCT. Again, there is little evidence of any association seen (correlation coefficient 0.0329, p=0.69) and therefore spend per head is unlikely to account for the variation observed in CVI rates.

Certificate of Vision Impairment (CVI) directly age-standardised rate per 100 000 versus Spend (in pounds sterling) per Head by Primary Care Trust, 2008/2009.

Funnel plot of CVI directly age standardised rate per 100,000
The funnel plot in figure 4 shows a high degree of heterogeneity in the 151 PCTs, with 27 being above the upper three SD line and 36 below. Another 17 PCTs are between the upper two and three SD lines and 12 between the lower two and three SD lines. This is likely to be both due to real differences between PCTs but also unmeasured covariates that alone impact by small amounts but together impact greatly (figure 4).
Discussion
The certification rates of blindness and sight impairment differ widely among PCTs with an 11-fold difference between the highest and lowest rate. There is little association seen with the Index of Deprivation or Spend on Vision. The limitations of the study included the relatively smaller numbers of CVI data for each PCT so that the coefficient of variation may have overestimated the level of variation.11 Increasing the local areas to larger geographical areas of England may improve the accuracy, though such a measure would be less relevant to commissioners and healthcare professionals. Residual confounding by age may remain a limitation as we had to use relatively large age bands again due to the relatively smaller number of events in each age band.
Despite these limitations this is a high level of variation and understanding the data collection is important. The completion of a CVI form requires a consultant ophthalmologist to offer certification to a patient who is attending a hospital eye clinic and the patient to accept that offer. Therefore there are a number of factors which can influence both the offering and acceptance of the certification and it is difficult to distinguish these other than through direct audits. The certification process is also limited by the fact that it takes place mostly in the hospital setting by a consultant, as there may be many more patients in the community who may be eligible but are not offered it. The magnitude of variation raises questions about the consistency of this process around the country and the variation in how many eligible people are offered certification.
It is recognised that the reported numbers of CVI registrations of blindness and sight impairment have decreased significantly in the last 10 years, at a time when, for demographic reasons, they should be increasing.16 The reasons for this are not entirely clear but they may also contribute to the variation across the country. There are a number of possible factors. The number of blind people in England has been counted since 1851. The decrease in certification rates has coincided with the introduction of the new CVI form to replace the previous BD8 form. It has been expressed that the new form is more complex to complete. The new form was intended to be accompanied by a change in culture where it is now an indication that the person may benefit from the support and rehabilitation in the community, rather than being an indication that ‘nothing more can be done’. This was supposed to trigger increased certification being offered, which may be done more in certain areas or by certain individuals than by others, The change in form was also accompanied by a change in the payment system, from ophthalmologists being automatically entitled to a fee to the entitlement for the fee being variable depending on whether a consultant is on a new contract or old or if it is seen as an additional examination.
The sustainability of CVI data collection and analysis has also been in question since 2007. First, it was not included in the National Indicator Set, which lists those data collections that would remain mandatory for local authorities.17 Then an NHS information centre review concluded that the collection of the data should cease. Support by eye care professionals for the data collection led to a further government review, which concluded that data collection was essential but that the system needed improvement. These conclusions were further supported by a Law Commission's report, published in May 2011.18 These issues have slowed down progress in improving and updating the process of data collection including the development of an electronic collection system. Continuing uncertainty may have affected the quality of data collection. Certainly, the data collection could be improved by streamlining and adopting an electronic version which auto-populates demographic information by linking to local Electronic Patient Record systems (EPRs). Raising understanding of CVI figures is also of merit—a CVI for diabetic eye disease means that a patient has lost sight due to a preventable eye condition. The distinction between ‘preventable’ and ‘not preventable’ blindness is important. Blindness due to diabetes, glaucoma and cataract is considered preventable or treatable if diagnosed in a timely manner. Similarly, AMD now also has effective treatments which can halt or improve sight loss, hence its inclusion with glaucoma and diabetes in the Public Health Outcome framework ‘preventable sight loss’ indicator. Hospitals should be encouraged to examine their own CVI figures to ensure that all that could have been done was done and regular audits could be conducted to ensure that patients who are eligible for certification are offered a CVI. An analysis of one London PCT found significantly higher levels of certification due to glaucoma and diabetic retinopathy, both preventable causes of blindness.19
There have been, to our knowledge, no other studies on geographical variation in sight loss conducted in the UK. Reliable collection of national data on sight loss is an issue throughout developed as well as developing countries. In a Danish population-based study of prevalence and causes of blindness, they noted that there was no accurate and up-to-date data for Denmark, and therefore conducted their own population cross-sectional survey for Copenhagen.20 The figures used in the WHO database for Europe are based in some cases on data collection from over 15 years ago.21 Population-based surveys, often focused exclusively on the elderly, have been done in many European countries but these types of surveys have their own limitations.21 Rapid assessment of avoidable blindness has been developed to allow a simple and rapid survey methodology that can provide data on prevalence and causes of blindness.22 This has proved to be extremely successful in developing country settings and many have been conducted globally. However, the methodology differs to our study and they do not specifically look for geographical variation within countries although this may sometimes be implicated in some results. Geographical variation has been studied in the UK with regard to mainly surgical rates, including cataract surgery, intravitreal injections and more recently uveal melanoma. 23–25 In some areas, where available, it may be interesting to compare these hospital-based data with the rate of blindness and sight impairment certification. This lack of comparable data highlights the importance of the work being done in the UK with this routine data collection on sight loss and its causes, and serves as an example for other countries.
The inclusion of the public health indicator of ‘preventable sight loss’ in the Public Health Outcome Framework is a landmark decision in the inclusion of eye health into the wider public health agenda. However, this highlights the importance of improving the quality of this important data collection, if it is to be used to monitor the number of people with preventable sight loss. Our results show that there is a wide level of variation between PCTs and it is likely that much of this is due to factors including variation in levels of offering of certification, care pathways, perceived value of certification and payment for CVI forms. It is vital that these are now addressed with a more streamlined process, and locally and nationally awareness is raised in the importance of the data. The analysis of the number of people losing sight due to conditions which may be preventable is vital. There is an additional need for accurate data to see whether the introduction of new (and expensive) interventions for diseases (such as Lucentis for age-related macular degeneration and possibly Diabetic Macular Oedema) are reducing sight loss nationally. Further research on the causes of sight impairment among those certified and its variation will be important as well as the comparison of rates with other eye healthcare indicators. Variation of sight loss certification is a concern if patients are not gaining access to social service support. It is vital for those who plan and manage services to determine if there is more that can be done to improve services to prevent avoidable sight loss and improve eye health outcomes.
Acknowledgments
We would like to acknowledge the Royal College of Ophthalmologists, Royal National Institute of the Blind and Guide Dogs for the Blind for their help in making this data available.
The CVI data are copyright of the Department of Health. However, any views expressed in the publication are those of the author(s) alone and are not necessarily those of the Department of Health.
Footnotes
-
An analysis and report of national certification data
-
Contributors ANJM (guarantor) was involved in conception, design, analysis and intepretation of data, drafting original article, revision and final approval. CB was involved in analysis and interpretation of data, revision of article and final approval. RW (guarantor) was involved in revision of article and final approval. MS was involved in interpretation of data, revision of article and final approval. IS was involved in analysis and interpretation of data, revision of article and final approval. MG was involved in revision of article and final approval.
-
Funding The research is an independent one supported by the National Institute of Health Research (NIHR) Biomedical Research Centre at Moorfields Eye Hospital NHS Foundation Trust and UCL Institute of Ophthalmology. The views expressed in this publication are those of the authors and not necessarily those of the NHS, the NIHR or the Department of Health.
-
Competing interests None.
-
Provenance and peer review Not commissioned; externally peer reviewed.
-
Data sharing statement There are no additional data available.