Article Text

Abstract
Objectives To investigate whether bicycling to school improves cardiometabolic risk factor profile and cardiorespiratory fitness among children.
Design Prospective, blinded, randomised controlled trial.
Setting Single centre study in Odense, Denmark
Participants 43 children previously not bicycling to school were randomly allocated to control group (n=20) (ie, no change in lifestyle) or intervention group (ie, bicycling to school) (n=23).
Primary and secondary outcome measures Change in cardiometabolic risk factor score and change in cardiorespiratory fitness.
Results All participants measured at baseline returned at follow-up. Based upon intention-to-treat (ITT) analyses, clustering of cardiometabolic risk factors was lowered by 0.58 SD (95% CI −1.03 to −0.14, p=0.012) in the bicycling group compared to the control group. Cardiorespiratory fitness (l O2/min) per se did not increase significantly more in the intervention than in the control group (β=0.0337, 95% CI −0.06 to 0.12, p=0.458).
Conclusions Bicycling to school counteracted a clustering of cardiometabolic risk factors and should thus be recognised as potential prevention of type 2 diabetes mellitus and cardiovascular disease (CVD). The intervention did, however, not elicit a larger increase in cardiorespiratory fitness in the intervention group as compared with the control group.
Trial registration Registered at http://www.clinicaltrials.gov (NCT01236222).
- cardiometabolic
- risk factors
- bicycling
- children
- commuting
This is an open-access article distributed under the terms of the Creative Commons Attribution Non-commercial License, which permits use, distribution, and reproduction in any medium, provided the original work is properly cited, the use is non commercial and is otherwise in compliance with the license. See: http://creativecommons.org/licenses/by-nc/2.0/ and http://creativecommons.org/licenses/by-nc/2.0/legalcode.
Statistics from Altmetric.com
Article summary
Article focus
-
Intervention studies investigating whether bicycling to school in fact causes improved cardiometabolic health have not yet been carried out.
-
The aim of this study was to investigate whether bicycling to school cause an increase in cardiorespiratory fitness and induce improvement of clustering of cardiometabolic risk factors.
Key messages
-
This study is the first study to document that bicycling to school had positive effect on clustering of cardiometabolic risk factors in children.
Strengths and limitations of this study
-
The major strength of this study was the randomised design which through elimination of bias allowed for investigation of a causal relationship between bicycling to school and health outcomes.
-
Relatively weak statistical power and impossibility of blindness of the treatment.
Introduction
The metabolic syndrome (MS) is the concurrence of multiple risk factors associated with cardiovascular disease (CVD) and type 2 diabetes mellitus. Prevalence is between 20% and 30% of the adult population in most countries,1 and a rising incidence in children and adolescents2 indicates that the condition represents a major threat to global public health. Exposure of the MS confers a doubled risk of incident cardiovascular event and death3 and up to five times higher risk of developing type 2 diabetes mellitus in adults.4 Furthermore, since clustering of cardiometabolic risk factors track from childhood to adulthood5 early prevention of the MS is important for preventing occurrence of disease later in life.
In children and adolescents physical activity has the potential to prevent a clustering of risk factors,6 underpinned by the notion that an increase of daily moderate physical activity by 10–20% is associated with 33% lower risk of having the MS.7
Active commuting such as walking and bicycling to school might be important contributors of preventive physical activity. Observational studies indicate that bicycling to school is beneficial to health since higher cardiorespiratory fitness8 and lower body mass index (BMI)9 have been observed in children bicycling to school compared to non-cyclists. If bicycling to school is generally acknowledged as a time-efficient and feasible form of daily physical activity it could potentially target the entire population. From a public health perspective this would be very appealing considering that the greatest health benefits are achieved in the least active individuals.10
There seems to be wide-ranging scepticism about the opportunity to bicycle to school in industrialised societies. The level of concern, however, seems often to be negatively associated with the prevalence of bicycling to school, which in Denmark, for instance, is about 60% among adolescents8 ,9 whereas in the UK approximately 2% bicycle to school.11
Intervention studies investigating whether bicycling to school in fact causes improved cardiometabolic health have not yet been carried out. One reason for this could be that very few countries have an infrastructure allowing safe commuting by bike to school. Another reason could be that interventions often include change in the built environment in order to provide safe routes and this is difficult to control in a rigid study design.
The evidence linking bicycle commuting with cardiometabolic health in children is still limited and experimental studies investigating causality have been requested.12 Hence, the aim of this study is to investigate, in a randomised trial, whether bicycling to school causes an increase in cardiorespiratory fitness and induce improvement of clustering of cardiometabolic risk factors.
Methods
Study participants
This study took place in Denmark in the municipality of Odense during spring 2011. Participants were recruited through invitation letters sent to 36 elementary public schools in the municipality of Odense. Investigators then visited 10 of these schools (approximately 92 classes) and presented the project. In addition, the project was presented online and in a radio spot. Participants were included if they at the time of registration stated that they had not bicycled regularly to and from school for at least 3 months (ie, at least from January onwards) prior to the intervention, and if willing to be randomised to one of the two study groups (ie, control group or bicycling group). Reasons for exclusion were not having a bike, and/or affirming less than 1 km between home and school. In total, 189 children volunteered to participate in the study. Out of these, 131, however, claimed that they bicycled regularly to school, and 4 withdrew from the study due to a changed family situation. In all, 54 eligible children were subsequently randomised to either control or intervention. After randomisation 6 and 5 participants from control and intervention group, respectively, withdrew since they did not accept being randomised, leaving 43 participants in the study (figure 1). Written informed consent was obtained from the child's parent or legal guardian after they were given a detailed written explanation of the aims of the study, possible hazards, discomfort, and inconvenience and the option to withdraw at any time. The study was approved by the regional Ethics Committee (S-20100009) and registered at clinicaltrials.gov (NCT01236222) with the purpose of investigating the effect of bicycling to school on the MS and aerobic fitness.
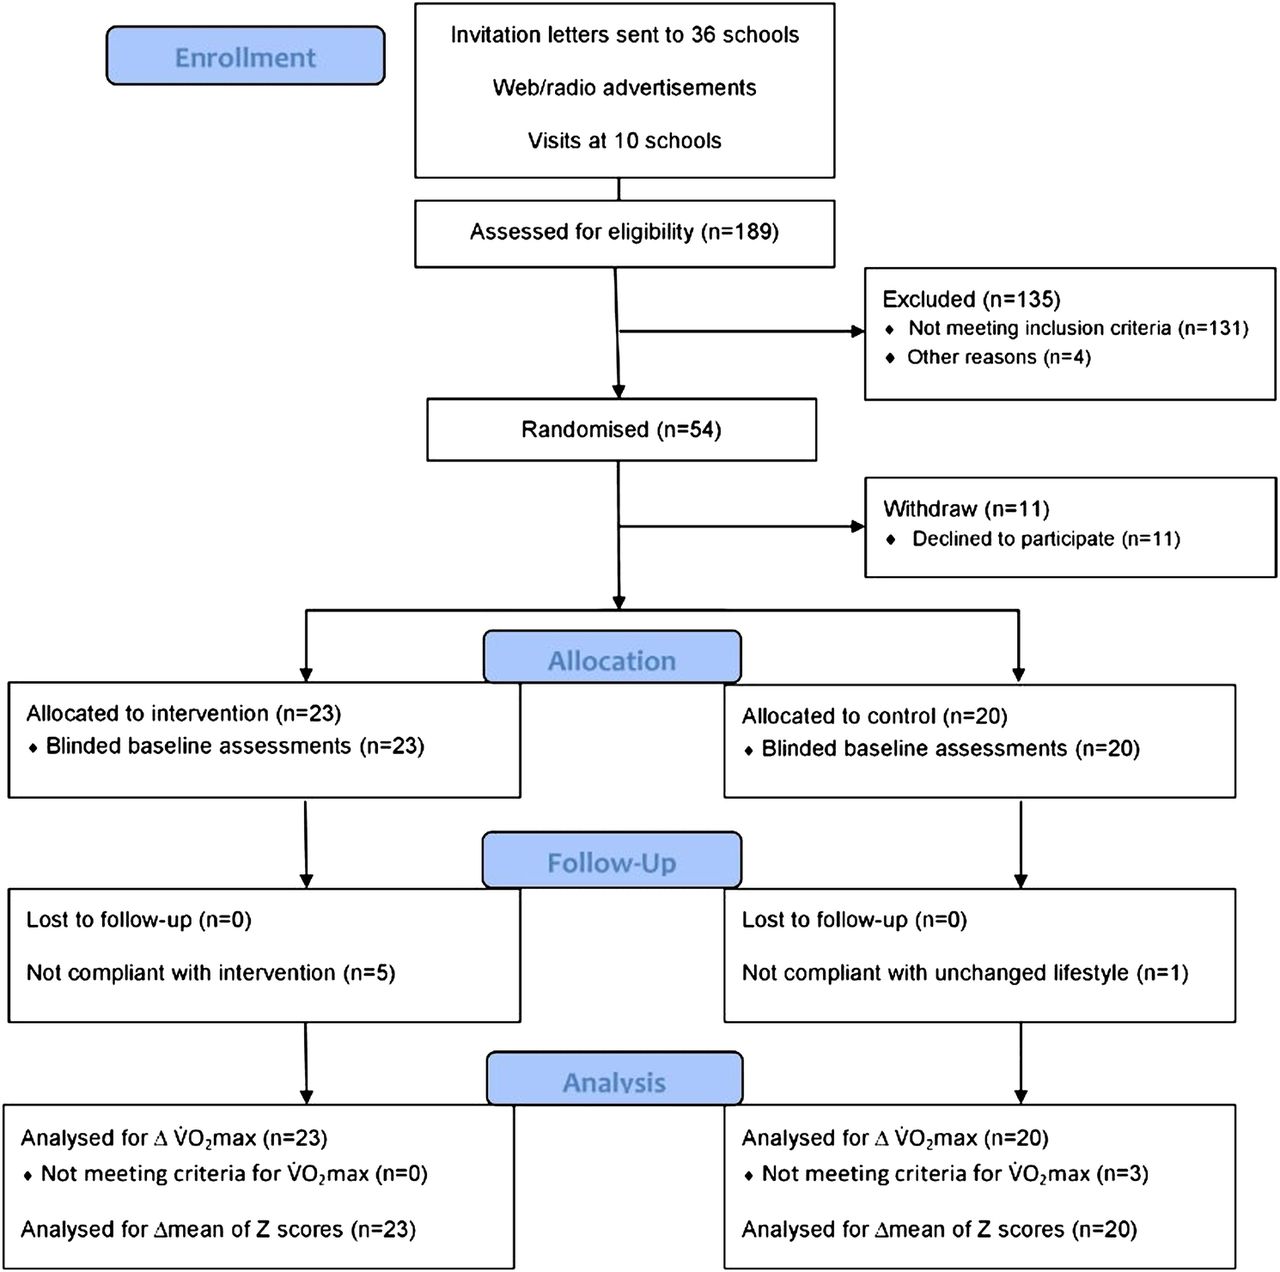
Participants flow diagram.
Study design and intervention
Participants were randomly assigned to a control group (ie, no change in lifestyle) or to an experimental group (ie, commuter bicycling). A permuted random block size (2, 4 and 6) randomisation (http://www.randomization.com) was used to reduce the chances of the assignment schedule seen by those responsible for recruitment of participants.13 Overall, 20 participants were allocated to the control group and 23 participants to the bicycling group. All measurements were repeated at the conclusion of the 8 week intervention programme. There were no restrictions besides the mode of transportation to school. The study period comprised 1 week of national holiday and additionally two bank holidays where no children attended school. Matching baseline test date with follow-up test (to achieve similar intervention duration between subjects) was strived for, but logistically not possible for all participants. This has implications on the amount of exposure the intervention group was able to accumulate. Participants could maximally accumulate between 56 and 74 trips to and from school during the study period. All measurements at baseline and follow-up were conducted by personnel blinded to group allocation. Children were picked up and returned to their home addresses when scheduled for baseline and follow-up tests.
Measurements
Height was measured by a stadiometer (SECA, Hamburg, Germany), children wearing socks or bare feet and weight was assessed by a 0.1 kg precision scale (Soehnle Professional, Murrhardt, Germany) wearing only shorts and t-shirts. Skinfold thickness was measured on the left side with a Harpenden caliper (John Bull, British Indicators Ltd, West Sussex, England) at the biceps, triceps, subcapsular and suprailiac sites. Overweight/obesity status was defined according to age-specific and gender-specific published cut-points for BMI.14
Systolic and diastolic blood pressure was measured by a sphygmomanometer (DINAMAP ProCare 100, GE Healthcare, Tampa, Florida, USA). At least five measurements were made on the left arm with 2 min interval and the mean of the final three measurements were used as systolic and diastolic pressure.
All children were instructed to fast overnight (>8 h), and only allowed to drink water until the blood sample was drawn. Blood was drawn from the right fossa cubitus by a biomedical laboratory scientist. If a participant had not been fasting or if he/she had experienced any illness during the last week, a new test day was scheduled for that child. Samples were analysed for glucose, insulin, cholesterol and triglyceride. Insulin resistance was estimated according to the homoeostasis model assessment (HOMA) as the product of fasting glucose (mmol/l) and insulin (μU/ml) divided by the constant 22.5.15 Breakfast was served on site subsequent of blood sampling. All analysis of the blood specimens were conducted at: Department of Clinical Biochemistry and Pharmacology, Odense University Hospital.
Aerobic fitness (VO2peak) was determined in a progressive bicycle test with an electronically braked ergometer (Monark 839 Ergomedic, Varberg, Sweden). Pulmonary gas exchange was measured with a metabolic cart (Amis 2001, Innovision, Odense, Denmark) with 15 s epoch, and the highest value within 30 s was regarded as a maximal if respiratory exchange ratio (RER) ≥0.99 or maximal heart rate (HR) was ≥185 beats/min (bp/min), and the test leader judged the participant to show signs of intense effort (eg facial flushing or difficulties in keeping up the pedal frequency).16 HR was measured with an HRM (Polar RS800CX, Kempele, Finland) with epoch set to 1 s. Children were thoroughly explained the purpose of the test and that it would require a maximal effort. After a warm-up period of 5 min at 40 W, work load was increased 40 W every 2 min until volitional exertion. Verbal encouragement was given throughout the test and recommended pedalling cadence was 60–80 rpm.
Children completed a general questionnaire regarding transportation to school, sports habits and general quality of life. At follow-up all children marked their route to school using a web-based map tool (http://www.loebererute.dk).
All children had their bike equipped with an odometer on average 2 weeks before baseline measurement. The odometers were individually calibrated in accordance with wheel circumference. Odometer levels were self-reported, by participants in both groups, every Sunday until tested at follow-up by means of a commercial SMS system (SMS-Track ApS). Participants who did not answer on Sunday were contacted on Monday. Malfunctioning odometers were replaced within a few days.
Both groups were instructed to report daily mode of school transportation on a custom-made transport diary. The total mileage of school-related bicycling during the study was calculated from the distance to school (web route assessment) times the number of trips to/from school (transport diary).
Field measurement of intensity of bicycling to school was carried out midway (5 weeks after baseline). Participants in the intervention group received a global positioning system (GPS) logger (Qstarz BT-Q1300S, Qstarz International Inc., Taiwan) and a heart rate monitor (HRM) (PolarTeam,2 Polar, Kempele, Finland) and were instructed to wear the devices during 1 day. Both GPS and HRM were set at an epoch of 5 s. All GPS data were transferred to commercial software (Travel recorder V. 5.0) and corrected for drift using manufacturer software. The GPS was the reference for all HRM data. Mean HR of school transportation, if verified by the diary, was calculated as the mean of the measurements from the first data point when the child exceeded a speed of 5 km/h when leaving home, to the last data point above 5 km/h when the child arrived at school. Both compliant and non-compliant participants were included in the determination of commuter bicycling intensity since the primary outcome is based on intention-to-treat (ITT) analyses.
Physical activity beyond bicycling was assessed with an accelerometer (Actigraph GT3X, Manufacturing Technology Inc, Fort Walton Beach, Florida, USA). Physical activity was monitored for 7 consecutive days from Monday to Sunday at baseline and midway (5 weeks after baseline). Instruments were attached at the hip, and counts were sampled every 2 s. Data reduction was performed using customised software (Propero, Odense, Denmark). Only data from the vertical axis were included in the data analyses. Criteria for a successful recording were a minimum of 3 days of 10 h recording per day. Time periods of at least 30 consecutive minutes of zero counts were deemed to represent periods when the monitor was not worn and thus disregarded. Cut points for intensity levels were based on the Freedson/Trost equation.17 Since cutpoints for physical activity intensity are specifically designed for 1 min epoch these were divided by 30. The average time the accelerometer was worn was 13.5 and 13.6 h per day at baseline and follow-up, respectively, and the number of min spent in the different intensity intervals was proportionally adjusted to 14 h with the following equation: adjusted min=(observed in interval)×(14×60/total min).18
Values for all blood parameters at both baseline and follow-up are missing in one participant from the intervention group due to needle phobia. Insulin and HOMA values were regarded as missing for one participant in the control group due to type 1-diabetes. Follow-up cholesterol for one person and baseline HOMA for another participant from the intervention group were not obtained due to irregularity at the laboratory. Systolic blood pressure is missing in one participant due to resistance.
One participant from the intervention group performed maximal tests, but was not measured with the metabolic cart. VO2peak was in this case estimated from the regression equation between power output (MPO) and VO2peak of the study sample. Change in VO2peak was considered missing in three participants since test criteria were not met at follow-up.
Statistics
Crude baseline measurements were compared between the bicycling and the control group participants using unpaired mean comparison tests (t tests), whereas paired t tests were used in within-group comparisons from baseline to follow-up.
Postintervention values were analysed across the two groups using analysis of co-variance (ANCOVA), as suggested by Twisk and Proper,19 with participants grouped as originally randomised regardless of the degree of intervention compliance and types of activity actually performed. In efficacy analyses, participants are referred to as compliant in the intervention group if at least 80% of possible trips to school were by bike on contrast participants in the control group are considered compliant if less than 20% of possible trips were by bike. Change in outcome was compared between the bicycling and the control group with adjustment for baseline measure and gender. All covariates were selected a priori and thus in any case kept in the statistical modelling even if non-significant. Regression analyses were preceded by verification of fulfilment of parametric assumptions by qq-plots and Shapiro-Wilks tests.
Z scores (observed value—baseline mean/baseline SD) were computed for each of the variables included in the composite Z score. A high Z score value (or an increase) is considered to have adverse health effects for all variables included in the composite score with exception of cardiorespiratory fitness where inverse values were calculated. Composite Z scores, based on baseline and follow-up measurements, were constructed as a mean of the available standardised selected risk factors (fasting triglyceride, insulin sensitivity (HOMA), sum of four skinfolds, systolic blood pressure, total cholesterol/HDL (high-density lipoprotein) ratio and inverse aerobic fitness). Composite baseline and follow-up Z scores were then standardised according to the baseline mean and SD allowing for the interpretation of change in composite Z score. Subsequently, the change in standardised composite Z score was calculated as (standardised mean of Z scores at follow-up—standardised mean of Z scores at baseline).
Assuming a mean change of 10% in VO2peak and a SD of change of 0.3 l O2/min the study needed 21 participants in both groups to be powered at 80%. All analyses were conducted using STATA IC V.11.0 (STATA Corp, College Station, Texas, USA) with α=0.05.
Results
Background characteristics
Of the 54 participants randomised, 11 declined to participate (two due to moving, one due to personal reasons, one due to parental job situation, two due to test methods and five not accepting randomisation) leaving 43 participants (79.6%) in the study. No subjects experienced accidents or other harms. All 43 participants were measured at baseline and returned for follow-up (figure 1). Based on published age and gender BMI cut-off values14 no participants were obese at baseline, whereas three and two participants were overweight in the bicycling and control group, respectively. There were no statistical differences between the control group and the bicycling group participants who completed the 8 week intervention period on any of the baseline features presented in table 1, nor was there any baseline difference in the two primary dependent variables: VO2peak and mean of Z scores.
Baseline characteristics in the intervention and control group by gender
Adherence
All the 43 allocated participants were available at follow-up assessments. Five participants in the intervention group and one in the control group were defined as non-compliant. The average compliance was 96.2% and 84.2% in the control and the intervention group, respectively (table 2).
Number of bicycling trips to and from school accomplished by participants in the intervention and the control group
Absolute and relative bicycling intensity, speed and distance to school by gender in the entire intervention group (ie, both compliant and non-compliant participants included)
Change in VO2peak from baseline to follow-up
Crude comparisons of the effects within groups showed that VO2peak mean increased from 1.81 at baseline to 1.87 l O2/min at follow-up (ie, an increase by 3.3%) in the intervention group whereas the change in the control group was 1.69 vs 1.73 l O2/min (ie, an increase by 2.3%). Based on adjusted ITT regression analyses children who started bicycling to school did not improve fitness (β=0.0336911, p=0.458) compared to controls. Likewise, based on adjusted estimates from efficacy analyses children who started bicycling to school did not improve fitness (β=0.0425191, p=0.404) compared to controls. There was a significant association (p<0.001) between kilometres bicycled to school and fitness improvement (figure 2).

Dose−response between bicycling to school and fitness improvement in the intervention group.
Change in composite Z score from baseline to follow-up
Crude comparisons of the effects within groups showed that the standardised composite Z score decreased from 0.01 at baseline to −0.26 at follow-up in the intervention group, whereas in the control group the corresponding change was from 0.01 to 0.28.
Based on adjusted ITT regression analyses children who started bicycling to school lowered their composite standardised Z score (β=−0.58, p=0.012) compared to controls. Based on adjusted efficacy analyses children who started bicycling to school lowered their standardised composite Z score (β=−0.63, p=0.015) compared to controls. There was no significant association (p=0.512) between kilometers bicycled to school and change in composite Z score.
Post hoc regression analyses of the 6 Z transformed δ variables included in the composite score showed that every single variable, although statistically non-significant individually, contributed to the lower standardised composite score in the intervention group. Standardised δ coefficients were: inverse fitness −0.085867 (p=0.458), systolic blood pressure −0.1074832 (p=0.644), sum of four skinfolds −0.1522508 (p=0.118), triglyceride −0.2713089 (p=0.295), cholesterol ratio −0.0405599 (p=0.838), HOMA score −0.4582449 (p=0.049).
Discussion
Statement of principal findings
The main finding in this study was that bicycling to school for a period of 8 weeks significantly lowered clustering of cardiometabolic risk factors by 0.58 SD. The effect size estimate was different between the control and the intervention group in ITT analyses, though not all participants were fully compliant during the study period. The level of statistical significance of the clustered risk score was statistically significant even when multiple testing (due to two outcomes) was taken into account with the conservative Bonferroni method.20
Standardised residuals were plotted against the predicted values and no systematic patterns were observed which confirmed variance homogeneity. QQ plots and Shapiro-Wilks tests of the standardised residuals of the model expressed normality. The goodness of fit as indicated by r2 values in the regression modelling of change in the standardised composite Z score were 0.16 and 0.19 for ITT and efficacy analyses, respectively. Goodness of fit for the modelling of change in VO2peak was 0.17 and 0.18 for ITT and efficacy analyses, respectively (for additional results from the regression analyses, see supplement 2).
Post hoc regression analyses of the 6 Z transformed δ variables included in the composite score showed that every included variable contributed to the improved clustered score. This is noteworthy since it indicates a consistent positive effect of cycling to school on a range of various health parameters.
The composite risk factor score was used in order to compensate for the day-to-day fluctuation in the single risk factors and included the same variables as in previous studies by our group.6 A continuous score as a proxy of the MS was chosen in favour of a dichotomous outcome in order to enhance statistical sensitivity, and because it is considered to describe the metabolic health condition better.21 Further, none of the children had MS according to the definition by the International Diabetes Federation.22
Bicycling to school did not have the expected effect on cardiorespiratory fitness per se since no significant difference between cyclists and controls was observed. This was contra intuitive since 4.6–5.9% higher aerobic power has been reported in cross-sectional studies comparing adolescents bicycling to school to walkers and passive transporters.23 Furthermore, a 9% improvement has been found in children who started bicycling to school in prospective studies by Cooper et al.24 The discrepancy might be due to a relatively short intervention period in the present study and perhaps also because of too short a distance to school. The latter being indirectly indicated from the significant association between kilometres bicycled to school and cardiorespiratory fitness improvement. In this connection, it is noteworthy that a 7.3% improvement in VO2max 25 has been observed in a randomised study of adults who started bicycling to work and that the commuting trip on average was about 5 km, which is twice the distance of the children included in this study. Interestingly, post hoc linear regression showed that both the relative average and the relative maximal intensity during commuter bicycling was positively associated (see data supplement 1) with cardiorespiratory fitness improvements (p=0.005 and p=0.002, respectively).
Finally, we cannot rule out that the non-significant difference in changes of VO2peak between groups could be a consequence of lack of statistical power (ie, type II-error) since a change in VO2peak by 10% would require 21 perfectly compliant participants in both groups to be powered at 80%. The preliminary power calculations in the present study were based on expected change in VO2peak since no previous data on the potential effect of bicycling to school on cardiometabolic health were available.
Compliance
Participants did not exhibit a behaviour that was fully in accordance with the group they were randomised into. During the intervention period five participants in the intervention group bicycled less than 80% of all possible trips to school, and one participant in the control group cycled more than 20% of all trips to school by bike. A relative cut-off value of 80% was set allowing room for participants to be included in the efficacy analyses though subject to sickness, bike theft and the like. This arbitrary relative cut-off was preferred to an absolute due to slightly varying study duration and coincides well with the frequency of bicycling observed in the underlying population. In the ITT analyses, we maintained the strengths of the randomized controlled trial design and accounted for potential known and unknown confounding through inclusion of all allocated participants in the analyses knowing that the true health potential of bicycling to school is likely to be larger than our estimates. In supplementary efficacy analyses, we accounted for the non-compliance and found slightly larger effect estimates for both composite Z score and VO2peak. We included ‘non-bicycling’ participants based on self-reported mode of transportation to school. From the transport diaries it was possible to assess whether participants in the period preceding the study had in fact been non-bicycling and meeting inclusion criteria (as self-claimed). Four participants in the control group and one in the intervention unfortunately bicycled more than 20% of possible trips to school in the 2 weeks prebaseline period. Participants were kept in both ITT and efficacy analyses though their appearance possibly diluted the true effect of commuter bicycling to school. It is evident that acceptance and understanding of randomisation of transport to school was a challenge. Transport to school is an integrated part of the daily logistics of the entire family making compliance highly susceptible to various factors such as parental job situation, parental marital status and sudden extra vacation.
Strengths and weaknesses of the study
The major strength of this study was the randomised design which through elimination of bias allowed for investigation of a causal relationship between bicycling to school and health outcomes. Compliance was supported by inclusion of participants from numerous classes consequently diminishing the risk of contamination between groups. Direct measurements of VO2peak and all baseline and follow-up measurements being carried out by the same experienced, and blinded test personnel are likewise study strengths. Furthermore, detailed information on the degree of exposure before (allowing an assessment of fulfilment of inclusion criteria) and during (eg mode of transportation to school, amount of bicycling to school, amount of bicycling beyond commuter bicycling, commuter bicycling intensity, general physical activity level) the study is advantageous. A study weakness was a relatively small study sample not behaving perfectly in accordance with the group randomised into, and consequently possible compromised the detection of an effect of bicycling to school on cardiorespiratory fitness. It is likely that the amount of total bicycling assessed from SMS-reported odometer status were underestimated because some odometers reset due to malfunction. Possibly this underestimation is biased as the intervention group generally bicycled more trips and thus was more susceptible to theft and malfunction. This, however, is not crucial in the present study focussing on commuter bicycling being assessed from the transport diaries. Field measurements of commuter bicycling intensity and distance are based solely on one single trip to school and should therefore be taken with caution. Finally, we cannot rule out that the field measurements have been biased due to the Hawthorne effect (ie, children may have changed their behaviour as they knew they were being studied). A possible Hawthorne effect should, however, beside from the field measurements be equal in the two study arms.
Recruitment
It was feasible to carry out the present study because it is relatively safe and feasible to bicycle to school in Denmark. The recruitment of participants, however, turned out to be rather difficult partly due to the fact that approximately 60% of children in the region already bicycled to school9 and thus not includable. From the remaining 40% some lived too far away from the school to bicycle, while others lived so close that they preferred to continue walking. Others were unable or unwilling to have their daily transport dictated by a randomisation. The recruitment difficulties forced us to include participants living closer to the school than our predetermined inclusion criteria of 2 km. The inference of inclusion of children with short commuter distance is that the observed effect of the present study had greater external validity. We experienced that direct personal contact to school pupils was the most efficient way to recruit participants.
Exposure in the intervention group
In the field test children bicycled to school at a self-chosen average intensity of 73.6% of maximal HR, which is similar to Finnish adults who commute at a relative intensity of approximately 73.5–78.6%.26 The relative intensities for adult commuting were converted from %VO2peak to %maximal HR by means of the regression equation reported by Swain.27 Interestingly, web-assessed distance to school was 2.27 km (SD=1.55) in the intervention group, whereas GPS-assessed distance in the same group was 2.13 km (SD=1.51) (p=0.08). Thus, though needed to be investigated further, self-reported commuter distance in children seem to be valid (SD δ variable=0.34).
Despite short school travelling distance, short study duration and non-perfect compliance among the participants included in our ITT-analyses, a significantly decrease in sum of Z score was found in the intervention group compared to the control group. Accelerometer measurements conducted midway in the study indicated that this decrease was not mediated through an increased level of general physical activity since neither mean count nor adjusted minutes at various intensity levels (the latter not included in the results section) were statistically significant different between groups. Our rationale for including children walking to school was based on previous studies reporting no significant differences in various measures of physical fitness between participants walking to school and those using passive transport.8 ,23
Main message
Although comparison of effect sizes should be done with caution28 a lowering of the composite Z score by 0.58 is substantial. In comparison, an increase in continuous MS score of 1 has been associated with an OR of developing type-2 diabetes mellitus of 3.4 and 5.1 in men and women, respectively, and OR for CVD of 1.7.29 Consequently a lowering of MS score by 0.58 could theoretically lower the OR of developing diabetes about 45% and CVD around 25%. In conclusion, bicycling to school counteracted a clustering of cardiometabolic risk factors and should thus be recognised as potential prevention of type 2 diabetes mellitus and CVD.
Acknowledgments
We thank the participating children and parents and the Biomedical Laboratory scientists.
References
Supplementary materials
Supplementary Data
This web only file has been produced by the BMJ Publishing Group from an electronic file supplied by the author(s) and has not been edited for content.
Files in this Data Supplement:
- Data supplement 1 - Online figures
- Data supplement 2 - Online tables
Footnotes
-
Contributors LØ designed the study, performed the randomisation, analysed and interpreted data, drafted the manuscript and is the guarantor. JT collected, analysed and interpreted the data and revised the manuscript. LAB revised the manuscript. LBA interpreted data and revised the manuscript. All authors approved the submitted version of the manuscript.
-
Funding source The study was financed by Trygfonden and supported by the municipality of Odense.
-
Competing interests None.
-
Ethical approval The study was approved by the regional Ethics Committee. Written informed consent was obtained from the child's parent or legal guardian.
-
Data sharing statement Data will not be publically accessible. However, interested individuals may contact the corresponding author.