Article Text

Abstract
Objective To analyse the physical fitness of a large sample of the French population across different ages.
Design Observational cross-sectional study.
Setting Data were collected from the Athletic Track and Field Federation, which organised events dedicated to measuring physical fitness. The events took place in 22 regions between 2006 and 2010.
Participants French volunteer citizens (N=31 349) aged between 4 and 80 years old who participated in events dedicated to measuring physical fitness.
Primary and secondary outcome measures We assessed the results of the following fitness tests: 20 m shuttle run, standing broad jump, repeated squat jump, 4×10 m shuttle run, speed, flexibility and push-ups in relation to age and body mass index (BMI) using Spearman's rho, a one-way analysis of variance. A bi-exponential model was used to represent the performance with age.
Results Our major results showed higher performances for men and for subjects with normal BMI at all age groups except for the flexibility test. BMI was strongly correlated across all ages with physical fitness p<0.0001. Furthermore, through bi-exponential model, a mean peak performance was identified at 26.32 years of age for men and 22.18 years of age for women.
Conclusions Physical fitness assessment using a simple series of tests on the general population offers an important indicator of health status. The possibility of observing the evolution of fitness levels with time provides an important monitoring method from a public health perspective. Further research is needed to reinforce and evaluate the approach.
- Epidemiology
- Public Health
This is an open-access article distributed under the terms of the Creative Commons Attribution Non-commercial License, which permits use, distribution, and reproduction in any medium, provided the original work is properly cited, the use is non commercial and is otherwise in compliance with the license. See: http://creativecommons.org/licenses/by-nc/2.0/ and http://creativecommons.org/licenses/by-nc/2.0/legalcode.
Statistics from Altmetric.com
Article Summary
Article focus
-
Physical fitness is an important indicator of health status with a strong inverse mortality gradient for the highly fit.
-
Sedentary behaviour and increase in body mass index of the general population are serious public health threats across all ages.
-
Few studies report the physical fitness level of adolescents, adults and elderly through the same series of tests.
Key messages
-
The following study reports and analyses the physical fitness level of a French population (N=31 349) through a series of tests designed by the Athletic Track and Field Federation ‘Ligue Nord Pas de Calais’ and performed in 12 regions in France between 2006 and 2010.
-
Results revealed a better overall performance for men compared to women.
-
Performance increases with age until 26–30 then decreases with time, demonstrating a progression–regression curve.
Strengths and limitations of this study
-
The application of the same series of physical fitness tests on a large sample of the population offers an important monitoring tool in the general population.
-
The non-normal distribution of age and the insufficient details on the physical activity habits are certain limitations of the study.
Introduction
Physical fitness is one of the most important factors that determined the survival of our ancestors1 and it is also an indicator of health status. Several epidemiological studies have measured fitness levels using different methodologies to understand the secular trends and their relation to health.2–5 Evidence suggests a strong inverse mortality gradient across fitness groups, with a 50% lower death rate for the highly fit group,6 a better lipid profile and a decreased incidence of coronary heart disease.7
Over the past two centuries, the human species has experienced significant physical growth.8–10 Yet, weight continues to increase in spite of height stability.8–10 We are witnessing a worldwide burden of metabolic risk factors with 1.46 billion adults being overweight or obese.
Furthermore, sedentary behaviour and declining physical fitness have become serious public health threats across all ages. A high level of sedentary behaviour is observed in many regions worldwide and patterns of physical activity and fitness are deteriorating.11 For instance, only a small portion of children (23.8% boys/15.4% girls) aged between 13 and 15 years old in 34 developing countries are meeting the 60 min of exercise per day recommendations.11 Similarly, European adolescents are generally not adhering to the recommendation to limit television-viewing time to no more than 2 hours per day.12
The measurement of physical fitness is a challenging objective due to the high variability of the parameters involved and the presence of correlated factors.13 For example, total body fat, habitual physical activity and socioeconomic status have been independently correlated to physical fitness.14
A number of international studies investigated the fitness level of children and adolescents on representative samples of the population (eg, HELENA (Healthy Lifestyle in Europe by Nutrition in Adolescence), AVENA (Alimentacion Valoracion del Estado Nutriocional en Adolescentes), European Youth Heart Study (EYHS), etc.),15–17 and secular trends in the aerobic performance of children and adolescents have been evaluated in the developed world.18 However, to our knowledge few studies report the physical fitness level of adolescents, adults and elderly through the same series of tests.
The objective of the following study is to analyse the results of a French series of tests designed by the Athletic Track and Field Federation Ligue-Nord-Pas-de-Calais and performed on a large sample of the population between 2006 and 2010.
Methods
Sample preparation and origin
Recruitment was based on a voluntary basis and events took place in 12 regions out of 22 in metropolitan France (Alsace, Aquitaine, Bretagne, Bourgogne, Champagne-Ardenne, Ile-de-France, Langedoc-Roussillon, Midi-Pyrénées, Nord-Pas-de-Calais, Pays de la Loire and Rhône-Alpes). Advertising promotional campaigns in the region, via schools or organisations, took place prior to the date of the test. The schools, municipalities and major local representatives were aware of the coming event and encouraged all inhabitants of the region, including school children and workers, to come and test their physical fitness.
The epidemiological data obtained for this study were collected by retrospectively pooling together results from the organisers of the event that declare their data collection to the CNIL (the National Commission of the Informatics and Liberty). This study therefore used a research protocol qualified as non-interventional, in which ‘all acts are performed in a normal manner, without any supplemental or unusual procedure of diagnosis or monitoring’ (Article L1121-1 of the French Public Health Code). According to the law, its approval therefore did not fall under the responsibility of a committee for the protection of persons (CPP). All data obtained from the organisers of the event were anonymous, declared to the CNIL, and none of the information relayed to the researchers could lead to the identification of any subjects. This study analysed the results of the previously collected data and was designed and monitored by the IRMES committee.
Tests and subjects
The physical fitness series of tests has been developed by the organisers of the event and the reproducibility has been validated in a previous study.19 In that study, healthy volunteers (N=143) with 43 adolescents (average age: 13), 43 young adults (average age 20) and 56 adults (average age 32.8) performed the tests twice in the same conditions and were assessed by a physical educator for reproducibility. The results of the non-progressive shuttle run were compared to the validated 20 m shuttle run reference test. Results showed a good reproducibility of the tests (ICC from 0.81 to 0.90), a strong correlation between the tests and a high correlation between the non-progressive 20 m shuttle run and the 20 m shuttle reference test. Indicators were age, body mass index (BMI) (weight (kg)/height (cm)2) and fitness score on each test. BMI for children and adolescents was set according to the French National Plan for Nutrition and Health (PNNS) scales. For adults a BMI<18.5 was considered underweight (UW), BMI 18.5–24.9 normal weight (NW), BMI 25–29.9 overweight (OW) and BMI>30 was considered obese (Ob). All subjects (8–60 years old) performed the same series of tests named Diagnoform tonic. Separate batteries of tests were designed for other age groups or subjects with health contraindications. All measurements were collected by trained staff and the reporting was supervised.
Field site description
The event took place in large settings such as a schools’ playground or a sports club's gymnasium. The organisers of the event prepared the site in advance and planned the process to welcome a large flow of people at the same time. A separate area was specifically set to archive the results in the database, print result sheets and lead each participant to a nutritionist or a physical educator present to give oral advice on health, physical activity and nutrition.
Description of analysed tests: (35–40 min workshop)
-
Non-progressive 20 m shuttle run measured the maximum distance reached during a 3 min run (in metres). The subject was invited to run back and forth on a straight 20 m line for 3 min. The supervisor counted the number of times the subject went back and forth and translated it to a measurement.
-
Standing broad jump test measured explosive strength (in centimetres). The subject jumped as far as possible with legs joined.
-
Repeated squat jump test measured explosive strength, elastic energy and coordination (in centimetres). The subject jumped five consecutive jumps with legs joined.
-
4×10 m shuttle run test measured speed and agility by recording the minimal time needed to complete the 40 m course (in seconds).
-
Speed measured anaerobic capacity by running as fast as possible a 30 m course (in seconds).
-
Flexibility test measured leniency and the capability to reach down as far as possible starting from standing position and maintaining the position for 3 s. Records were indexed: for placing hands flat on the ground=5, fingers touch the ground=4, fingers reach the ankle=3, fingers reach the tibia=2, fingers/hand reach the knees=1.
-
Push-ups test measured muscular strength and endurance. Subjects performed repetitions with knees on the ground, lowering body to a 90° elbow angle and then back up to the initial position.
Statistical analysis
Descriptive analysis
Mean, SD, Min and Max values for each test and according to age groups (children: 8–11, adolescents: 12–17 and adults 18–60) were calculated.
Comparisons
A one-way analysis of variance (ANOVA) was used to test for statistical difference between age groups, weight categories and performances for each test.
Correlation
Spearman's rho correlation was calculated to measure the relationship between BMI and the different measures of tests.
Model
A bi-exponential model20 ,21 was used to fit the progression–regression curve across all age groups (4–80 years old) for each of the speed test, standing broad jump, 20 m shuttle run and the repeated squat jump test.
The coefficients a, b, c and d are estimated using a least-square non-linear regression method with
Analysis was performed using MATLAB and SPSS, V.19.0 for WINDOWS; SPSS Inc, Chicago.
Results
Descriptive
The total number of recruited subjects in the 231 events was 31 349 with ages ranging from 4 to 80 years. Within this large group the sample for 8–60 years old was N=31 133. Children (8–11) n=6494 (20.85%), adolescents (12–17) n=19 496 (62.62%) and adults (18–60) n=5143 (16.51%). The year 2008 was the year with the highest number of promotional campaign days (PCD) and participants per campaign. The number of PCD between the years 2006 and 2010 with the corresponding number of participants per year is presented in table 1.
Distribution of promotional campaign days (PCD) and participants from 2006 to 2010
Mean scores for the standing broad jump and repeated squat jump test across age groups are described in table 2.
Mean score representation for the standing broad jump and the repeated squat jump test according to gender and age groups
Mean scores for the 20 m shuttle run, 4×10 m shuttle run and the speed test are presented in table 3.
Mean score representation for the 20 m shuttle run, the 4×10 m shuttle run and the speed test according to gender and age groups
Mean scores for the push-ups and the flexibility are presented in table 4.
Mean score representation for the push-up and flexibility test according to gender and age groups
UW children and adolescents were 2.57% (boys) and 2.46% (girls). Normal BMI was 78.32% (boys) and 80.88% (girls). OW children and adolescents were 14.42% for boys, 12.90% for girls. 4.68% boys and 3.66% girls were Ob.
Correlations
BMI and performance
Boys generally performed better than girls in all performances. Girls scored higher on the flexibility test across all ages and weight categories.
Adults in the NW for height category (BMI 18.5–24.9) performed longer distances in the 20 m shuttle run (men: 621.2 m for NW vs 568.8 m for OW, women: 516 m for NW vs 467.30 m for OW); standing broad jump (men: 213.9 cm NW vs 19 957 cm OW, women: 16 073 cm NW vs 142.7 cm OW); repeated squat jump (men: 1077.6 cm NW vs 1 01 722 cm OW, women: 797.1 cm NW vs 706.6 cm OW), and had the best records in respect to time for each of the 4×10 m shuttle run and speed test.
ANOVA analysis revealed a statistically significant difference p<0.0001 between all groups in function of BMI category UW, NW, OW, Ob.
Figures 1 and 2 represent the relationships between the BMI and the seven fitness tests.

Mean performance in children and adolescents according to BMI categories. NW, normal weight; Ob, obese; OW, overweight; UW, underweight. Bars represent ±SD. p Value<0.0001 between categories.
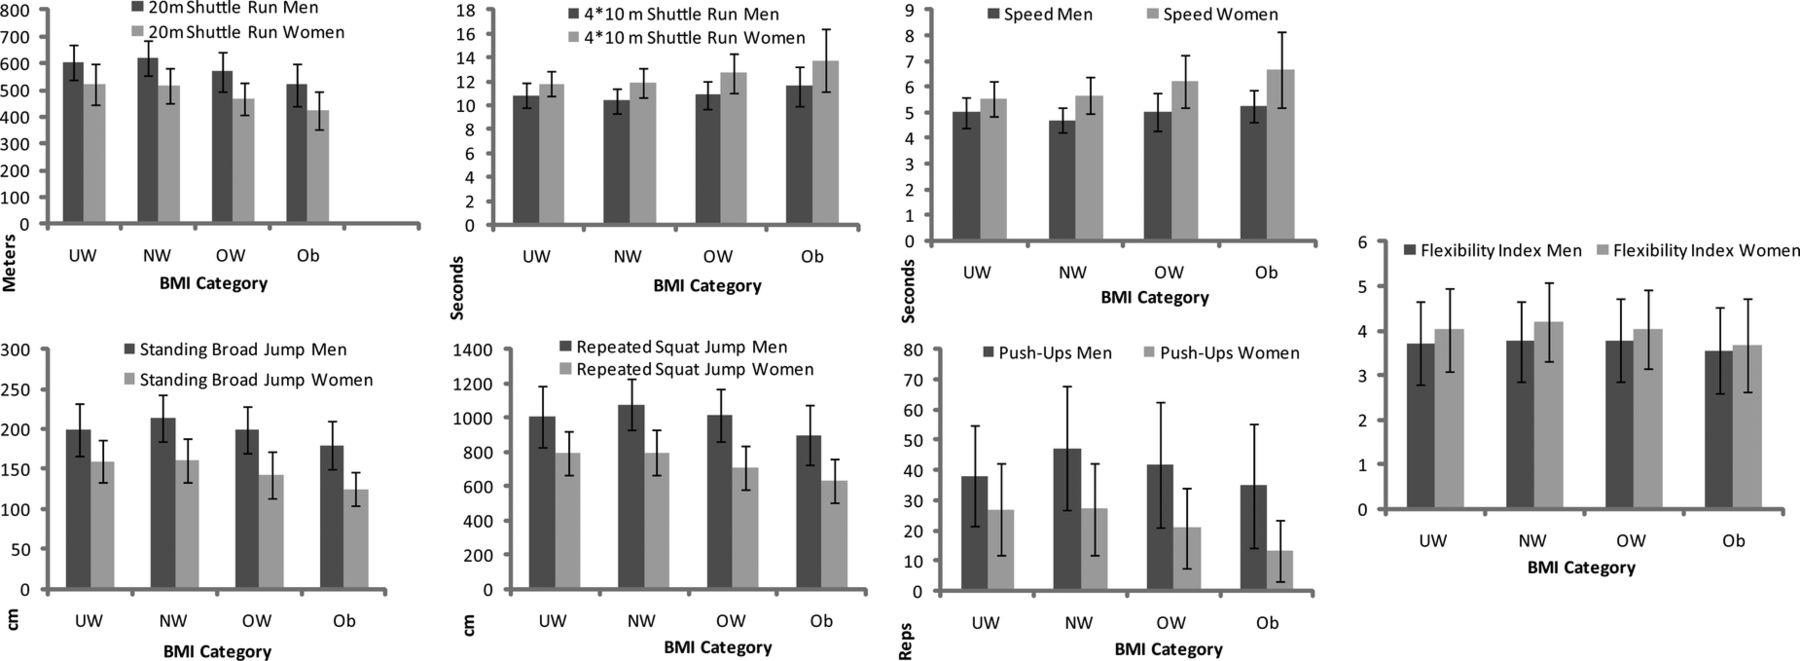
Mean performance in adults according to BMI categories. NW, normal weight; Ob, obese; OW, overweight; UW, underweight. Bars represent ±SD. p Value<0.0001 between categories.
Age and performance
Spearman's rho correlations were small to medium between age and the physical tests for women p<0.0001 and medium to strong correlation for men, but all significant p<0.0001.
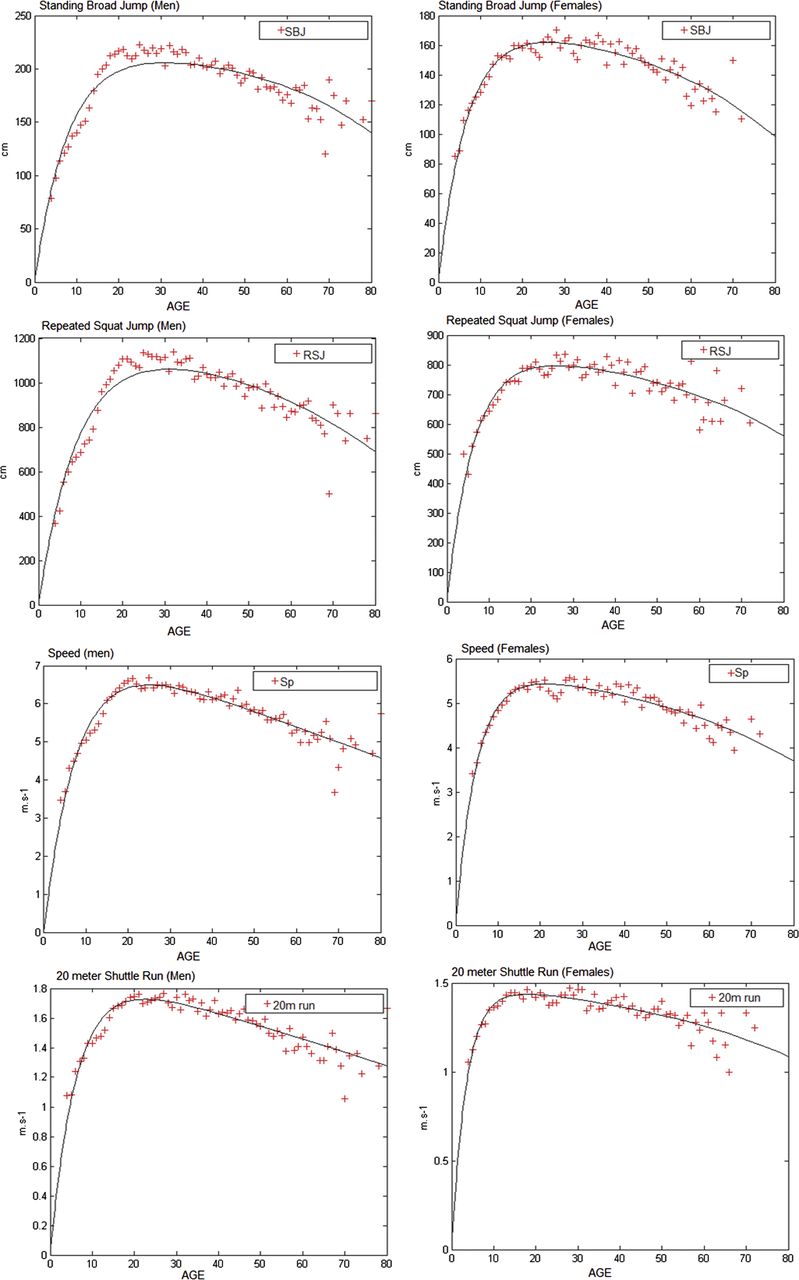
Performance increased with age until the ages 26–30 followed by a decrease demonstrating a progression–regression curve represented in figure 3.
Bi-exponential model fit on the mean performances of four tests for all ages: the standing broad jump test (SBJ) in cm, the repeated squat jump test (RSJ) in cm, the speed test (Sp) in m s−1 and the 20 m shuttle run test (20 m run) in m s−1for men and women at all ages. Peak age calculated is 30.9 years old R2=0.84 for men and 26.1 years R2=0.86 for women in the SBJ test. For the RSJ test: 30.9 years old R2=0.85 for men and 26 years R2=0.78 for women. For the Sp test: 24.9 years R2=0.86 for men and 21.2 years R2=0.87 for women. For the 20 m run test: 22.5 years R2=0.77 for men and 17.7 years R2=0.71 for women.
The mean age peak performance for the speed, standing broad jump, 20 m shuttle run and repeated squat jump fitness tests was 26.32 for men and 22.18 for women.
Discussion
This study analyses the data collected from the Diagnoform test according to age, sex and BMI. The major results of the following study are the mean average performances of the sample and the application of the progression–regression law on performance. The progression–regression law revealed a mean peak at 26.32 years old for mwn and 22.18 for women, showing a greater precocity and earlier decline suggestive of determinants in biological development.8 We found that women had a lower physical fitness performance rate at all ages compared to men except for the flexibility test which is in accordance with the literature.18 In addition, OW and Ob subjects performed less well compared to their peers in the same age group and sex, revealing the negative effect of increased adiposity on physical fitness. The following results are correlated with the fact that most of the tests conducted were weight-bearing tests.
Children and adolescents
In our study we observed that French adolescents performed similar to their Spanish scholars in the HELENA22 and AVENA23 studies,15 specifically in the 4×10 m shuttle run and the standing broad jump. Adolescents in the Diagnoform test had a 4×10 m shuttle run mean score similar to the AVENA study (2001–2002) and to the HELENA study (2006–2007). For the standing broad jump, boys had a score approaching the results of the HELENA study while girls had a score similar to the AVENA study. Although many factors such as physical activity, nutritional status, environmental factors and protocol details might be responsible for variability, we observe a similar trend between the adolescents in the three mentioned studies.
The development of physical fitness performance with age
Several studies identified the age of peak performance. The relationship between age and physical ability is a major characteristic of human development.24 All individuals are subject to a development phase and then undergo a decline during ageing that can be easily described through a bi-exponential model.21 The general population is now subject to sedentary behaviour. Thus, the measurement of fitness is necessary to evaluate the physical capacity and capability of coping. Moore's equation offers a simple model that depicts the development phase of children, adolescents, young adults and the declining phase of older adults and the elderly. Adults in our sample (18–60 years old) achieved higher scores than children and adolescents on all tests. Furthermore, we specifically observed that adults aged 40–60 years old performed better than expected given their age. In fact, physical fitness is expected to decline with age if not maintained with a habitual physical activity.17 ,25 ,26 However, given the lack of detailed information on their habitual physical activity we are unable to report correlations that might infer this conclusion. We assume that the sample in our study are more aware and competent in the physical fitness domains such as coordination, endurance and flexibility, compared to how physical fitness is valued and skilled in older people.27
Physical fitness measurement: a promotional tool?
Measuring physical fitness as a health indicator similar to BMI and waist circumference constitutes an essential variable to be monitored in order to analyse and understand the secular trends and the evolution of risks for metabolic and cardiovascular disease.28 Nevertheless, the correlation between the measurement at a given time and the follow-up process has not shown to reverse habits or modify behaviour to increase physical fitness and daily energy expenditure. In fact, physical fitness testing and awareness is efficient if conducted as part of a larger multidimensional health promotion campaign that takes into consideration the nature and amount of habitual physical activity, the environment and the barriers.29
Although some authors discussed the inconclusive negative effects of large-scale fitness testing,30 assessing relevant health indicators using simple tools such as the physical fitness series of tests remains an essential component of health impact assessment. Our study reinforces its importance and suggests implementing it following an intervention on habitual physical activity to demonstrate that the small changes in fitness are associated with a change in health.6
Perspectives
This series of tests seems to be an important initiative in the field of prevention and physical activity promotion in the French regions. The consequences of physical deconditioning can be mitigated by a well-designed risk reduction strategy targeting the highest-risk individuals while maintaining a critical approach in the understanding of the secular increase in obesity and sedentary behaviour.31 ,32 Multilevel programmes such as Intervention auprès des Collégiens centrée sur l'Activité Physique et la Sédentarité (ICAPS)33 in the eastern French region proved to be efficient in improving physical activity in adolescents. Active transportation is another effective way to help in reversing the decrease in physical fitness and promote physical activity. A 20–30 min cycling transportation to school or work may increase aerobic power and thus result in higher levels of fitness.34
Successful physical activity interventions target intrapersonal, social, physical, environmental and policy changes. This series of tests can be considered an important health indicator and might be able to complement strategies as a promotional tool. Its application on a representative population across all ages will open the possibility of creating quintiles, healthy fitness zones and analyse correlations with different life-style factors. Thereafter, evaluating changes that differ from normal zones would offer a new tool for public health monitoring.
Study limitations and strengths
The strengths in the following study are: (1) the applicability of the same series of tests on a large French population across 4 years, (2) the high number of participants during the promotional days and (3) the possibility of modelling the data using a new approach that offers a global transversal picture of the fitness level in a population according to performance in the series of tests. The limitations in this study are in relation to: (1) The non-normal distribution of age with a minor representation of the elderly and the insufficient details on the physical activity habits of the participants. (2) The use of the non-progressive 20 m shuttle run, which might not be sufficient in reflecting cardiovascular and endurance fitness and limits the capacity of comparisons with other studies. (3) Although most of the tests used have been shown to be valid and reliable in youth, whether they are equally reliable in adults and older people is still not very well understood and merits further research and validation.
Conclusion
Our study reports the physical fitness level of a large French sample and uses a bi-exponential model to show the consistency in depicting the progression–regression of fitness levels. Its applicability as an evaluation and monitoring tool might offer new insights into the field of health promotion.
Acknowledgments
We thank the INSEP teams, and the Ligue Nord Pas De Calais for their full support. We thank Mr Stéphane Len, Ms Marion Guillaume, Mr Geoffroy Berthelot, Ms Nour El Helou, Mrs Karine Schaal and Mr Andy Marc for their helpful input during the analysis and the review of the article.
References
Footnotes
-
Contributors HN is the main author of the original contribution; she contributed to the design of the study, analysed the data and drafted the final manuscript. AS and JS contributed to the conception of the study, the interpretation of the data and revised the final manuscript. MT and EA contributed to the data analysis, interpretation and revised the final manuscript. TD, HM and HO contributed to the conception, the data collection and revised the manuscript. FD and JF-T contributed to the conception, design and revised the article for final approval of the version to be published.
-
Competing interests None.
-
Provenance and peer review Not commissioned; externally peer reviewed.
-
Data sharing statement No additional data are available.