Article Text

Abstract
Introduction Cardiovascular disease (CVD) prevention guidelines recommend lifetime risk stratification for primary prevention of CVD, but no such risk stratification has been performed in India to date.
Methods The authors estimated short-term and lifetime predicted CVD risk among 10 054 disease-free, adult Indians in the 20–69-year age group who participated in a nationwide risk factor surveillance study. The study population was then stratified into high short-term (≥10% 10-year risk or diabetes), low short-term (<10%)/high lifetime and low short-term/low lifetime CVD risk groups.
Results The mean age (SD) of the study population (men=63%) was 40.8±10.9 years. High short-term risk for coronary heart disease was prevalent in more than one-fifth of the population (23.5%, 95% CI 22.7 to 24.4). Nearly half of individuals with low short-term predicted risk (48.2%, 95% CI 47.1 to 49.3) had a high predicted lifetime risk for CVD. While the proportion of individuals with all optimal risk factors was 15.3% (95% CI 14.6% to 16.0%), it was 20.6% (95% CI 18.7% to 22.6%) and 8.8% (95% CI 7.7% to 10.5%) in the highest and lowest educational groups, respectively.
Conclusion Approximately one in two men and three in four women in India had low short-term predicted risks for CVD in this national study, based on aggregate risk factor burden. However, two in three men and one in two women had high lifetime predicted risks for CVD, highlighting a key limitation of short-term risk stratification.
- Cardiovascular disease
- risk stratification
- lifetime risk
- cardiac epidemiology
- diabetes and endocrinology
- lipid disorders
- epidemiology
- coronary heart disease
- echocardiography
- hypertension
- heart failure
- qualitative research
- research methodology
- India
- primary healthcare
- diabetes
- developing countries
- adult cardiology
This is an open-access article distributed under the terms of the Creative Commons Attribution Non-commercial License, which permits use, distribution, and reproduction in any medium, provided the original work is properly cited, the use is non commercial and is otherwise in compliance with the license. See: http://creativecommons.org/licenses/by-nc/2.0/ and http://creativecommons.org/licenses/by-nc/2.0/legalcode.
Statistics from Altmetric.com
- Cardiovascular disease
- risk stratification
- lifetime risk
- cardiac epidemiology
- diabetes and endocrinology
- lipid disorders
- epidemiology
- coronary heart disease
- echocardiography
- hypertension
- heart failure
- qualitative research
- research methodology
- India
- primary healthcare
- diabetes
- developing countries
- adult cardiology
Article summary
Article focus
Lifetime risk of cardiovascular disease (CVD) in the Indian population.
Gender differences in lifetime risk of CVD.
Educational status and lifetime risk of CVD.
Key messages
Nearly half of individuals with a low short-term predicted risk had a high predicted lifetime risk for CVD.
The proportion of individuals with all optimal risk factors was 15%.
A significantly lower proportion of individuals in the lowest educational class had all optimal risk factors compared with individuals in the higher educational class.
Approximately one in two men and three in four women from working families in India had low short-term predicted risk for CVD.
Strengths and limitations of this study
These are the first estimates to combine short-term and lifetime predicted risks for CVD in India.
Our simple cardiovascular-risk-factor counting strategy provides a good way of identifying individuals at high and low lifetime risk for CVD, but the lifetime CVD risk prediction model has not been validated or calibrated in India.
Introduction
Cardiovascular disease (CVD) is the leading cause of death in India, contributing to nearly one-third of all deaths.1 Coronary heart disease (CHD) deaths, a major contributor to CVD deaths in India, rose from 1.17 million in 1990 to 1.59 million in 2000 and are further projected to rise to 2.03 million in 2010.2 Risk stratification and identification of individuals with a high risk for CHD who could potentially benefit from intensive primary prevention efforts are critically important in reducing the burden of CVD in India. Short-term CHD risk assessment and stratification tools have been widely used for risk stratification among asymptomatic individuals who are clinically free of CHD.3–11 However, a significant proportion of CHD events occur among individuals with a relatively low short-term (10 year) predicted CHD risk,12 as many of them become high-risk across the lifespan. Lifetime CVD risk estimation, which measures the cumulative risk of developing the disease during the remainder of an individual's lifespan, may provide a more appropriate assessment on future CVD risk than short-term (typically 10 year) risk estimates, especially in younger individuals in whom short-term risks are low. Therefore, various guidelines now recommend stepwise stratification of asymptomatic and disease-free individuals into high short-term, low short-term/high lifetime and low short-term/low lifetime CHD risk groups for targeting primary prevention strategies in all eligible individuals.13–16
Short-term CHD risk prediction models discriminate reasonably well across ethnic groups17 but need to be recalibrated based on the differences in age- and sex-specific disease incidence rates of the population in question. Since Indians have been shown to have a higher risk factor burden at younger ages compared with Western populations,18 risk prediction models developed in Western countries may underestimate short-term CHD risk. Short-term risk prediction models, such as the Framingham Risk Score, have been recalibrated for Indian emigrants to the UK in the ETHRISK calculator19 and to a small rural population in India.20 However, no lifetime risk models have been available for Indians living in India.
We report here the estimates of lifetime CVD risk among disease-free, adult Indians who participated in a nationwide risk factor surveillance study in industrial settings, using a previously published short-term and lifetime risk algorithm based on traditional CVD risk factors (age, sex, total and high-density lipoprotein cholesterol, tobacco, blood pressure, antihypertensive treatment, and diabetes).13 21
Methods
Study participants
We identified eligible individuals from the Sentinel Surveillance study in the Indian industrial Population (SSIP) database. The details of the SSIP study have been described previously.22 Briefly, 10 medium-to-large industries (defined as industries employing 1500–5000 people) were selected from different sites spread across India, from both public and private sectors, based on their willingness to participate in the study and proximity to an academic medical institution. All employees and their family members between the ages of 20 and 69 years were eligible to be included in the survey. Data were obtained from randomly selected employees and their eligible family members (n=2000 at each centre) at each participating centre. Further, from this group, we chose nearly 1000 individuals per centre (800 employees and their family members) by stratified random subsampling for biochemical analysis. The study is approved by ethic committee/institutional review boards of all participating academic institutes, and written informed consent was obtained from all participants. A total of 19 973 (11 898 men) individuals consented to participate in the questionnaire survey and 10 543 individuals for the biochemical analysis in the age group of 20–69 years. Individuals with a past history of CHD, missing values for age, systolic blood pressure (SBP), total cholesterol (TC), HDL cholesterol (HDL-c), plasma glucose (PG), antihypertensive treatment history and tobacco use were excluded from the analysis. The final database included 10 054 individuals.
Socio-demographics, lifestyle habits, medications and medical history (including the Rose angina questionnaire) were assessed using a structured questionnaire administered by trained study staff. Standard procedures and equipments were used to measure body weight and height. Blood pressure was measured using automated BP monitoring equipment (Omron MX3, Bannockburn, Illinois, USA). Two measurements were taken at least 5 min apart before collecting the blood samples and averaged. Study participants were instructed in advance not to consume any drinks and tobacco at least 1 h before attending the screening clinic. A fasting blood sample was also collected (minimum 8 h fasting) for biochemical analysis of PG and serum lipids. The central coordinating laboratory reanalysed 10% of the biochemical samples and reported less than 5% coefficient of variation between the central coordinating laboratory results and the individual laboratory results.
Risk factor definitions
Current tobacco use was defined as the use of any form of tobacco products (smoking and smokeless form) in the previous 30 days. Obesity was defined as a body mass index (BMI) of ≥30 kg/m2. Diabetes was defined as either a fasting PG value of ≥126 mg/dl23 or on medication for diabetes. CHD was defined as physician-confirmed myocardial infarction or unstable angina or symptoms suggestive of CHD from the Rose angina questionnaire. Low high-density cholesterol (HDL-c) was defined as an HDL-c of <40 mg/dl for men or <50 mg/dl for women.13
Short-term and lifetime risk stratification
The 10-year short-term predicted risk for CHD events (myocardial infarction or coronary death) was estimated for all participants using the Adult Treatment Panel III (ATP III) risk-assessment tool.13 17 A high short-term predicted risk was defined as a 10-year predicted risk for a hard CHD event (death, myocardial infarction) of ≥10% or diagnosed diabetes.24 Among individuals with a low short-term predicted risk, the lifetime predicted risk for CVD (myocardial infarction, coronary insufficiency, angina, atherothrombotic stroke, intermittent claudication or CVD death) was estimated using a previously published algorithm based on the aggregate risk factor burden (table 1).21 Subsequently, a secondary analysis was performed, which included obesity and low HDL-c as major risk factors.
Estimation of lifetime risk for cardiovascular disease (CVD)
Statistical analysis
We used summary statistics (proportion, mean and SD) to describe the data. The study group was divided into three different risk strata (low short-term and low lifetime risk, low short-term and high lifetime risk, and high short-term risk) as per the methods described above. The proportion of individuals in each risk strata was estimated separately for men and women. The differences in proportion of individuals within each stratum were compared across, educational status categories and locations of industries. Furthermore, using linear regression models with age as an independent variable, we estimated the risk factor levels at the age 50 for all individuals and stratified the groups into various lifetime CVD risk categories. We used Statistical Package for Social Sciences Version 17 for all analyses.
Results
A total of 10 054 individuals (men=6307) were eligible to be included in this analysis. The mean age (±SD) of the study population was 40.8±10.9 years. The proportions of tobacco users, participants with hypertension and diabetes were 26.9%, 26.4% and 9.5%, respectively. The proportions of individuals with dyslipidaemia were 25.5% (TC >200 mg/dl) and 53.4% (HDL-c <50 mg/dl in women and <40 mg/dl in men).
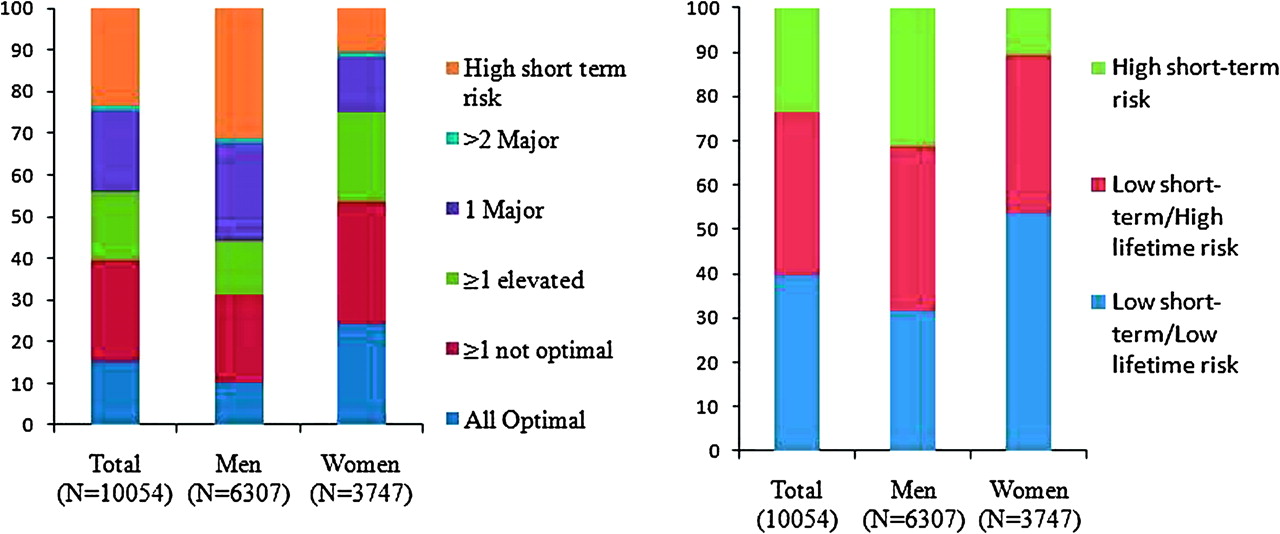
A high short-term risk (≥10% 10-year risk or diabetes) for CHD was prevalent in more than one-fifth of the population (23.5%, 95% CI 22.7 to 24.4). The proportion of individuals with a high short-term predicted risk was significantly higher in men (31.2, 95% CI 30.1 to 32.4) than in women (10.6, 95% CI 9.6 to 11.6) (figure 1). Nearly half of the individuals with a low (<10%) short-term predicted risk (48.2%, 95% CI 47.1 to 49.3) had a high predicted lifetime risk for CVD based on the aggregate risk factor burden. Almost one-third (31.4%, 95% CI 30.2 to 32.5) of men and more than half (53.5%, 95% CI 51.9 to 55.1) of women were in the lowest risk stratum of low short-term/low lifetime predicted risk.
Sample estimates of risk strata (as per table 1) among cardiovascular-disease-free, non-pregnant participants of the Indian Sentinel Surveillance Study.
As expected, the mean age, SBP, DBP, BMI, waist circumference, fasting PG, triglycerides and TC/HDL-c were lowest in the low short-term/low lifetime risk group (table 2). The proportions of current tobacco use were 43% and 47% in the low short-term/high lifetime and high short-term predicted risk groups, respectively. Hypertension was present in more than half (53.1%) of the high short-term risk group, in more than one-third (37.9%) of the low short-term/high lifetime risk group and in none of the low lifetime risk group. The prevalence of dyslipidaemia increased from 12.6% (low short-term/low lifetime risk) to 24.4% (low short-term/high lifetime risk) to 48.8% (high short-term risk) across the three groups. The prevalence of diabetes among the high short-term risk group was 40.3% but was 0% (by definition) in the both the low short-term/low lifetime risk and low short-term/high lifetime risk groups. The median Framingham 10 year risk score increased from 0.8% (IQR: 0.1–2.9) in the low short-term/low lifetime risk group to only 3.6% (IQR: 1.3–6.4) in the low short-term/high lifetime risk group.
Characteristics of study population
The proportion of individuals with all optimal risk factor levels was 15.3% (95% CI 14.6% to 16.0%). In the youngest age group (20–29 years), nearly one-third (32.6%, 95% CI 30.6 to 34.7) of participants had all optimal risk factors (table 3), while only 4.8% (95% CI 3.9% to 5.6%) of participants from the oldest age group (≥50 years) had this optimal profile. While the prevalence of the high short-term risk group was 50.0% (95% CI 47.9% to 52.0%) in the age group of ≥50 years, <1% of participants from the youngest age group had a high short-term risk.
Distribution of combined 10-year coronary heart disease and lifetime cardiovascular disease predicted risk strata in the Indian Industrial Sentinel Surveillance data
The proportions of individual with a high short-term risk were 27.6% (95% CI 26.5% to 28.8%), 21.8% (95% CI 20.2% to 23.5%) and 12% (95% CI 10.5% to 13.5%) in highly urban, urban and periurban locations, respectively. While the proportion of individuals with all optimal risk factors was 20.6% (95% CI 18.7% to 22.6%) in the highest educational group (graduate school education), only 8.8% (95% CI 7.7% to 10.5%) of participants from the lowest educational group (up to primary school education) had this optimal risk profile (p<0.001). Similarly, the proportion of individuals with high-short term risk was 15.2% (95% CI 13.5% to 17.0%) in the highest education group and 25.6% (95% CI 24.1% to 28.3%) in the lowest educational group (p<0.001).
In the secondary analysis with obesity and low HDL-c included as major risk factors, the overall proportion of individuals with high short-term risk was 23.5% (95% CI 22.7% to 24.4%). It was significantly lower in women (10.6%, 95% CI 9.6% to 11.6%) than in men (31.2%, 95% CI 30.1% to 32.4%). While the overall proportion of low short-term/low lifetime risk was 32.6% (95% CI 31.6% to 33.5%), it was 37.3% (95% CI 36.1% to 38.5%) in men but only 24.5% (95% CI 23.2% to 25.9%) in women (figure 2).

Distribution of combined 10-year cardiovascular disease (CVD) and lifetime CVD predicted risk strata in the CVD-free, non-pregnant participants in the Indian Sentinel Surveillance Study with obesity and low HDL included as major risk factors.
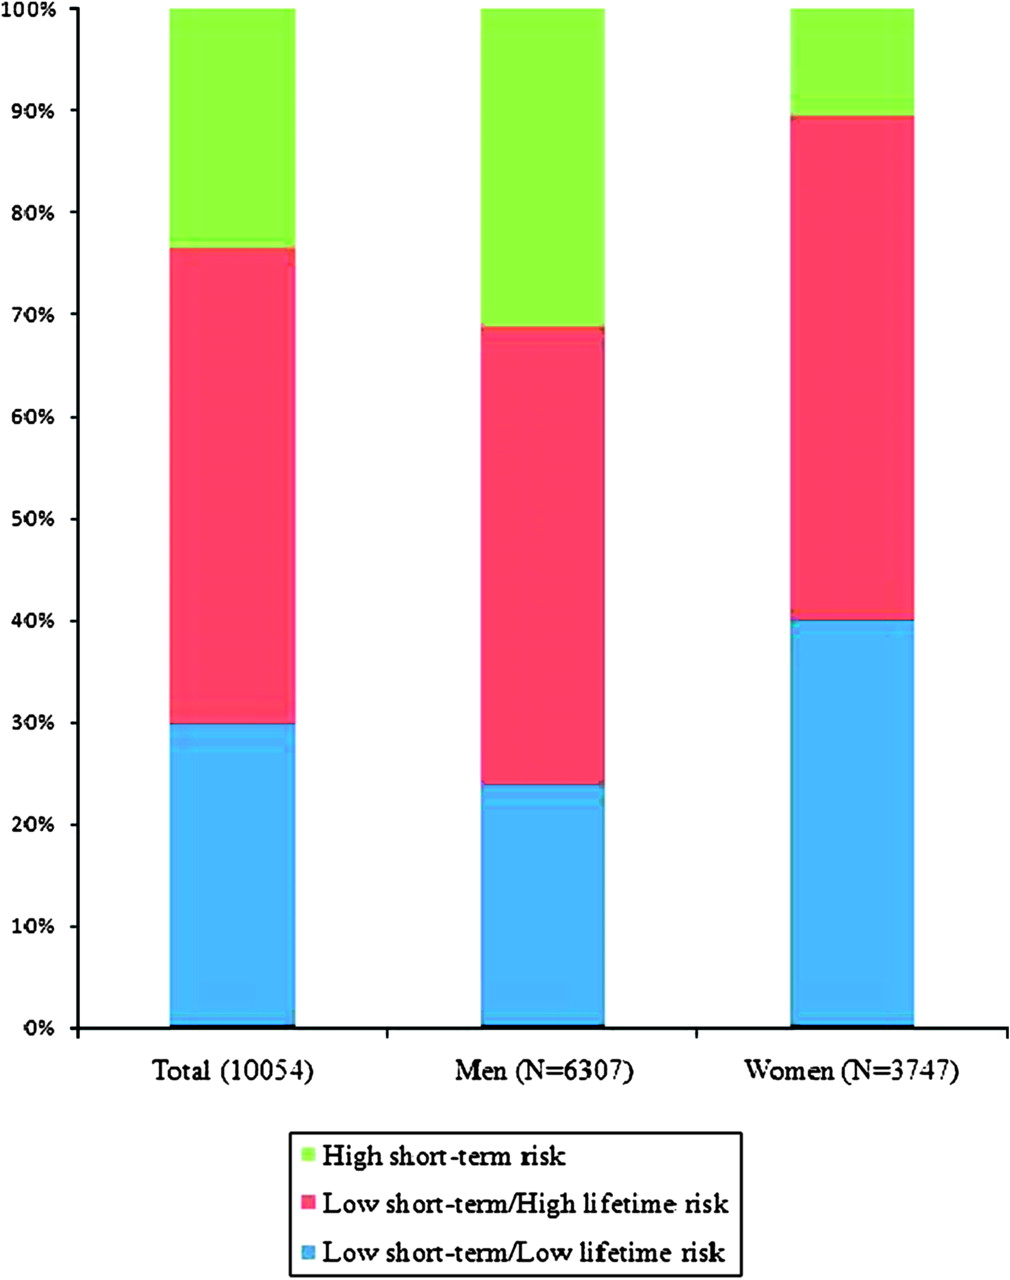
In the final analysis with estimated risk factors for all individuals at age 50 years, the proportions of individuals in the low short-term/low lifetime and low short-term high lifetime risk strata were 30% (95% CI 29.0% to 30.8%) and 47% (95% CI 45.6% to 47.6%), respectively (figure 3).
Sample estimates of risk strata (as per table 1) among cardiovascular-disease-free, non-pregnant participants of the Indian Sentinel Surveillance Study using estimated risk-factor levels at age 50 years.
Discussion
We have reported the distribution of short-term CHD and lifetime CVD predicted risks using data from a national cardiovascular risk factor surveillance study in India. To the best of our knowledge, lifetime risk stratification algorithms have not been used in the Indian population for risk categorisation. The vast majority (85%) of adults in this population have ≥1 non-optimal risk factors. Although more than three-fourths of the study population are at low (<10%) short-term predicted risk for a CHD event, nearly half are at high lifetime predicted risk for CVD based on their current aggregate risk factor burden.
While the absolute short-term and lifetime risk estimates presented here have not been calibrated to an Indian population, the nearly universal risk relationships between risk factors and incident CHD18 suggest that this risk-factor counting algorithm provides a reliable discrimination between individuals at lower and higher short-term and lifetime risk. These data provide best estimates of short-term and lifetime risk stratification in the absence of underlying CHD and CVD incidence data based on hard end-points.
In the US National Health and Nutrition Examination Surveys (2003–2004 or 2005–2006 surveys), the same lifetime risk-stratification algorithm classifies a lower proportion of individuals into the all-optimal risk factor profile,24 compared with our sample (11% in the USA vs 15% in India). This difference appears to be due, at least in part, to a higher proportion of older individuals (60–79 years) in the National Health and Nutrition Examination Survey sample. Nevertheless, maintenance of this profile into middle age has been associated with substantially lower rates of CVD across the lifespan,21 greater longevity,21 25 better quality of life at older ages,26 compression of morbidity and reduced medical expenditures later in life.27 While more than half (55.5%) of the US adult population is classified as low short-term/high lifetime risk group,24 this risk profile was seen in 37% of our sample. This group may be a key target for primary CVD preventive efforts, particularly in light of the burgeoning CVD epidemic in India.
Risks by gender and age group
The lifetime risk algorithm identified significant proportions of women and younger adults (<40 years) to be at low short-term/high lifetime risk category. Given the limitations of the ATP III risk-assessment tool for risk prediction and underestimation of CHD risk in women and young adults,28 29 the lifetime risk tool may provide important adjunctive information in this population. Although the inclusion of obesity and low HDL-c does not substantially increase the prevalence of men with low short-term/high lifetime risk, these factors significantly increase the proportion of women with low short-term/high lifetime risk. Therefore, the addition of BMI and HDL to short-term and lifetime risk prediction for Indian women may help to identify more women with elevated CVD risk who may benefit from targeted primary preventive efforts.
Although women and younger adults have a significantly lower risk for CVD in the present study, they are at significantly greater risk for future CVD events during the life course in comparison with those with a low lifetime predicted risk. Communicating these additional messages to this target community may help to motivate high-lifetime-risk individuals to adopt a healthy lifestyle so as to achieve a desirable risk profile.
Risks by urbanicity and socio-economic status
A growing vulnerability of individuals in urban locations and in the lower socio-economic status (SES) to CHD has been recognised in the Indian population.30–32 When we stratified the risk groups according to industry location, a significantly higher proportion of individuals in the highly urban region were found to have a high short-term risk for CHD than individuals in the periurban region. The implications of these findings are enormous in a country like India where the number of population residing in urban areas has increased from 26 million in 1901 to 288 million in 2001.33
Among several measures of SES, educational attainment has been reported to be a valid and easily measurable indicator of SES34 that is also considered suitable for social ranking across many populations at different stages of development. In our population, a significantly higher proportion of individuals in the lowest educational class reported a high short-term CHD risk in comparison with the highest educational class, as previously reported.30 Similarly, the proportion of individuals with a high lifetime risk was significantly higher in the low educational class in comparison with the highest educational class. The social gradient observed in CHD risk in India demonstrates the importance of targeting those with lower levels of education when planning CVD-risk-factor-prevention programmes.
Strengths/limitations
These are the first data from India to evaluate the proportion of individuals with low and high predicted lifetime risks for CVD. Lifetime risk stratification may be more relevant to real-world scenarios than Kaplan–Meier estimates, which tend to overestimate risk, since lifetime risk modelling accounts for competing causes of death. Lifetime risks may also improve risk communication with patients.
Our analysis has several limitations. First, both short-term and lifetime risk-stratification algorithms have not been validated and calibrated in the Indian population. Traditional risk-stratification algorithms, such as the Framingham Risk Score, tend to overestimate risk in low-risk populations and underestimate it in high-risk populations.35 36 However, India does not currently have any cohort (longitudinal) data with hard CVD endpoints to validate these models. The strength of a simple risk-factor counting strategy to stratify individuals into high and low lifetime risk takes advantage of the similar relative risks associated with incident CHD events, as demonstrated in the INTERHEART study.18 Second, the short-term model used predicts hard CHD events (death, myocardial infarction), whereas the lifetime-risk model used predicts total CVD events. Nonetheless, total CVD may be more clinically relevant than restricting risk prediction to CHD-only events. Finally, the concept of lifetime risk is taken from risk-factor data among participants of the Framingham study when they reached the age of 50 years.21 To account for this difference, we have estimated the expected risk-factor levels in all participants at 50 years of age and analysed the lifetime CVD risk. However, the risk-factor–disease lifetime risk relationship is further strengthened with the evaluation of markers of preclinical atherosclerosis, especially in younger individuals. For example, younger individuals with higher risk-factor burdens (the low short-term/high lifetime risk group) have a thicker carotid intima media thickness and higher coronary calcium scores than individuals with lower risk-factor burdens (low short-term/low lifetime risk group).37
Conclusion
In conclusion, these are the first estimates to combine short-term and lifetime predicted risks for CVD in India. Approximately one in two men and three in four women in this study have a low short-term risk, but two in three men and one in two women have a high lifetime risk for CVD, highlighting a key limitation of short-term risk stratification. Only 15% of participants had all optimal cardiovascular risk factors, a pattern associated with healthy longevity. A significantly lower proportion of individuals in the lowest educational class had all optimal risk factors compared with individuals in the higher educational class. We believe that these data provide strong evidence for broad preventive measures to combat the CVD epidemic in India, which appears likely to grow further without such measures.
References
Supplementary materials
Supplementary Data
Files in this Data Supplement:
Footnotes
To cite: Jeemon P, Prabhakaran D, Huffman MD, et al. Distribution of 10-year and lifetime predicted risk for cardiovascular disease in the Indian Sentinel Surveillance Study population (cross-sectional survey results). BMJ Open 2011;1:e000068. doi:10.1136/bmjopen-2011-000068
Funding The original study received financial support from Ministry of Health and Family Welfare, Government of India and WHO. P Jeemon is supported by a Wellcome Trust Capacity Strengthening Strategic Award to the Public Health Foundation of India and a consortium of UK universities.
Competing interests PJ is supported by a Wellcome Trust Capacity Strengthening Strategic Award to the Public Health Foundation of India and a Consortium of UK Universities. M Huffman is supported by an NHLBI training grant in cardiovascular epidemiology and prevention (T32 HL069771-08).
Patient consent Written informed consent was obtained from all participants before starting study measurements.
Ethics approval Ethics approval was provided by the ethics committee/IRBs of all participating academic medical colleges.22
Contributors DP, KSR, PJ, SG and VC designed the data-collection tools and monitored data collection for the whole study. KRT, VM, PPJ, FA, BVMM, MR and RA coordinated the data collection. PJ and MDH wrote the statistical analysis plan, cleaned and analysed the data, and drafted the paper. LR performed the biochemical analysis and quality control. DML-J reviewed the statistical analysis plan. PJ, DP, MDH, LR, SG, KRT, VMM, PPJ, BVMM, FA, MR, RA, VC, DML-J and KSR revised and approved the final paper.
Provenance and peer review Not commissioned; externally peer reviewed.
Data sharing statement Only aggregate data are presented in the paper.