Article Text

Abstract
Background and objectives The cytokine midkine (MK) is pathologically implicated in progressive chronic kidney disease (CKD) and its systemic consequences and has potential as both a biomarker and therapeutic target. To date, there are no published data on MK levels in patients with different stages of CKD. This study aims to quantify MK levels in patients with CKD and to identify any correlation with CKD stage, cause, progression, comorbid disease or prescribed medication.
Methods In this observational, single-centre study, demographic data were collected, and serum and urine assayed from 197 patients with CKD and 19 healthy volunteers in an outpatient setting.
Results The median serum and urine MK level in volunteers was 754 pg/mL (IQR: 554–1025) and 239 pg/mL (IQR: 154–568), respectively. Compared with serum MK in stage 1 CKD (660 pg/mL, IQR: 417–893), serum MK increased in stage 3 (1878 pg/mL, IQR: 1188–2756; p<0.001), 4 (2768 pg/mL, IQR: 2065–4735; p<0.001) and 5 (4816 pg/mL, IQ: 37477807; p<0.001). Urine MK levels increased from stage 1 CKD (343 pg/mL, IQR: 147–437) to stage 3 (1007 pg/mL, IQR: 465–2766; p=0.07), 4 (2961 pg/mL, IQR: 1368–5686; p=0.005) and 5 (6722 pg/mL, IQR: 3796–10 060; p=0.001). Fractional MK excretion (FeMK) increased from stage 1 CKD (0.159, IQR: 0.145–0.299) to stage 3 (1.024, IQR: 0.451–1.886, p=0.047), 4 (3.39, IQR: 2.10–5.82, p=0.004) and 5 (11.95, IQR: 5.36–24.41, p<0.001). When adjusted for estimated glomerular filtration rate, neither serum nor urine MK correlated with primary CKD diagnosis or CKD progression (small sample). There was a positive correlation between protein:creatinine ratio and FeMK (p=0.003). Angiotensin blockade (adjusted for proteinuria) was associated with lower urine MK (p=0.018) and FeMK (p=0.025).
Conclusion MK levels sequentially rise with CKD stage beyond stage 2, and our data support existing animal evidence for an MK/renin angiotensin-system/proteinuria relationship. To what extent this is related to renal clearance versus pathology, or the consequences of chronically elevated MK levels requires further exploration.
- immunology
- chronic renal failure
- cytokine
This is an Open Access article distributed in accordance with the Creative Commons Attribution Non Commercial (CC BY-NC 4.0) license, which permits others to distribute, remix, adapt, build upon this work non-commercially, and license their derivative works on different terms, provided the original work is properly cited and the use is non-commercial. See: http://creativecommons.org/licenses/by-nc/4.0/
Statistics from Altmetric.com
Strengths and limitations of this study
This is the first study to explore midkine (MK), a potential biomarker and therapeutic target in chronic kidney disease (CKD), in a predialysis CKD population.
The data are collected prospectively, in a range of stages and diagnoses.
MK assay performed by single experienced technician.
Single-centre and predominantly Caucasian population limits generalisability.
Due to the tight definition and infrequency of CKD progression in this cohort, the sample size is inadequate to confirm or exclude MK as a biomarker of progression.
Introduction
Chronic kidney disease (CKD) is common and is associated with significant morbidity, mortality and healthcare burden, particularly if end-stage kidney disease occurs necessitating dialysis or transplantation.1 Although preventive measures such as optimal blood glucose and blood pressure control may slow CKD progression, direct therapies targeting the mechanisms that drive progressive renal damage have been elusive.2 Likewise, biomarkers that can identify those who are going to progress are being investigated3 but are yet to be validated. If identified, these biomarkers could be used to streamline recruitment into clinical trials and potentially guide therapies in the future.
Midkine (MK) is a 13 kDa cytokine that is pathologically implicated in multiple disease processes, including malignancy, inflammatory diseases and acute and chronic kidney disease.4–6 MK was initially identified as an embryonic heparin-binding growth factor strongly expressed during midgestation,7 with a key role in nephrogenesis.8 MK expression continues at low levels throughout adulthood, produced mainly in the renal tubular cells and the endothelium (resident in the glycocalyx).9 10 Serum levels in the normal population are generally below 1000 pg/mL.9
In relation to CKD, MK is implicated in glomerular, endovascular and tubular inflammatory injuries.9 11–13 Proposed mechanisms include enhanced inflammatory cell recruitment via monocyte chemo attractant protein-1, macrophage inhibitory protein (MCP-1) and osteopontin, and progressive fibrosis through activation of transforming growth factor beta 1 (TGF-β).11–14 Animal models have shown that increased intrinsic renal MK expression promotes inflammatory cell infiltration in diabetic nephropathy,12 13 ischaemia/reperfusion-induced tubulointerstitial damage,11 14 and 5/6 nephrectomy hypertension-induced renal damage.15 Moreover, renal damage was mitigated when a therapeutic anti-MK agent (oligonucleotide) was administered.16 Recently, MK has been implicated as a potential driver of some of the malignant6 and systemic diseases associated with CKD, such as hypertension,15 17 vascular disease18 19 and cardiac dysfunction.20 21
Human data on MK levels in kidney disorders are limited. There are only two publications relating to CKD.13 22 The first study, looking at the effect of heparin in serum MK levels, showed that in 20 end stage renal failure (ESRF) maintenance haemodialysis patients heparin administration increased MK levels acutely and transiently during dialysis, likely pulling resident glycocalyceal MK into the circulation. MK levels were unchanged when non-heparin anticoagulation (serine protease inhibitor, Nafamostat) was used.22 In the second study, kidney biopsy tissue from nine patients with diabetes showed increased MK protein staining in the glomeruli and tubular cells when compared with healthy subjects.13 There are four recent publications of MK in acute kidney injury, predominantly focusing on its potential as a biomarker, although in small sample sizes.23–26 However, due to the frequent administration of heparin22 in the predictable (and therefore more commonly studied) acute kidney injury (AKI) settings (percutaneous coronary intervention, cardiopulmonary bypass and aortic surgery), the interpretation of these data may not be straightforward.
The aims of this study were to quantify MK levels in the serum and urine of patients with CKD, to establish any correlation between these levels and estimated glomerular filtration rate (eGFR), CKD stage, cause and progression and to determine any association with comorbid disease or medication.
Materials and methods
This is an observational cohort study performed in two sites within the Sunshine Coast Hospital and Health Service, Queensland, Australia. Participants who attended the renal outpatient department for an appointment were approached and provided informed consent, and the study underwent ethics committee (HREC/12/QRBW/56) and local governance approval.
The study population included CKD and healthy volunteer (HV) cohorts. Target recruitment of 200 CKD patients, in the absence of any available guiding data in this population, was based on the anticipated feasible recruitment from our service. Serum and urine samples were simultaneously obtained from patients with CKD attending an outpatient clinic appointment as well as HV (people accompanying the outpatient) between April 2013 and May 2014. Participant selection was opportunistic. Inclusion and exclusion criteria are shown in table 1.
Inclusion and exclusion criteria
Patient data collected on the day of enrolment included demographics (age, gender, weight, smoking status, blood pressure (mm Hg), comorbidities and medications and histological diagnosis of renal disease where available). Retrospective pathological data collected included most recent HbA1c (%) among patients with diabetes and fasting lipids (mg/dL). HVs were informed that if they were found to have proteinuria or abnormal renal function, a consultation with a nephrologist would be provided, and they would be withdrawn from the study. If they were hypertensive, they would be provided with this result and to consult with their family practitioner.
Participants underwent venesection and provided a urine sample at the clinic visit. Serum creatinine (μmol/L) (Jaffe method) and spot urine protein:creatinine ratio (PCR) (g/mol) were both measured at the local site on a Beckman Coulter Unicell Dxc860i machine. The remainder was spun, and the serum was stored at −70°C in a dedicated research freezer. The samples were then transported to a second site with experience using the commercially available MK ELISA kit (Cellmid, Sydney, Australia). This commercially available MK ELISA was validated in serum in accordance with accepted techniques.6 Additional validation testing of the MK ELISA kit performed by Biogenes (Berlin, Germany) included sample stability assessment of both a panel of patient sera and healthy patient serum spiked with MK protein. The MK ELISA kit passed this validation testing following several freeze–thaw cycles of samples as well as an extended storage of samples unfrozen at 4°C–8°C (see online supplementary file). With regard to urinary measurement, MK is rich in basic amino acid and cysteine residues and can thus maintain structural stability, which allows accurate measurements of urinary MK.25 Both serum MK (pg/mL) and serum C reactive protein (CRP) (mg/dL) were measured. CRP elevation was defined as CRP >5 in HV and CKD 1 and 2, and CRP >10 in stages 3, 4 and 5.27 The CRP levels were assessed using a CRP Vario commercially available kit (Abbott Laboratories), calibrated with high sensitivity calibrators for use on the Architect c16000 analyser (Abbott Laboratories, Abbott Park, Illinois, USA).
Defining CKD stage and primary diagnosis
The eGFR at recruitment was calculated using the CKD-EPI formula,28 and CKD severity was defined according to stage.29 Proteinuria was defined as a spot urine PCR of >30 g/mol.28 CKD primary diagnosis was determined clinically by the treating nephrologist, with kidney biopsy results, where available.
Determining and defining CKD progression
An investigator blinded to the purpose of the study analysed all retrospective serum creatinine and eGFR results for all CKD participants from 6 to 12 months prior to recruitment and 6–12 months after recruitment. The measurements closest to 12 months before and after recruitment were used in the study. These results were obtained from both the local pathology provider and private providers. In Australia, all pathology laboratories use the Jaffe method for creatinine measurement, are calibrated and calculate eGFR with the same formula.29 Participants were identified as having CKD progression in accordance with previous definitions used in clinical trial outcome measures,30 31 with additional stringency on fluctuation due to the potential impact of intermittent/acute insults on MK levels (table 2). ‘Stable’ and ‘progressive’ cases were then matched for eGFR (±5 mL/min/1.73 m2), age (±10 years) and gender. ‘Marginally stable’ and ‘potentially progressive’ cases were excluded due to the potentially unreliable/unreflective MK levels in this group.
Categorisation of CKD progression30 31
Relationship with MK levels
Serum and urine MK levels were analysed for correlation with eGFR, CKD stage, CKD cause, progressive CKD, comorbid diseases, medications, PCR and CRP. ‘Fractional excretion of MK’ (FeMK)(%) was calculated according to the formula [(urine MK pg/mL × serum creatinine umol/L) / (urine creatinine umol/L × serum MK pg/mL) × 100]. FeMK was considered an indicator of possible postglomerular contributions of MK to the urine, through production and/or secretion.
Statistical analysis
Data were organised, and trends were reported using simple descriptive statistics (mean (±SD); median (IQR); or proportions). Prior to analysis, the data were checked for normality using the Shapiro-Wilk test. Depending on the data distribution, either an unpaired t-test for normally distributed data or a Mann-Whitney U test for non-normal data was undertaken.
Multivariate analysis was performed to identify significant associations between predictor variables and the outcome variables: serum MK concentration, urinary MK concentration and FeMK. In general, models were developed using techniques of backward elimination, and likelihood ratio testing was used between iterations to validate variable deletion. Residual analysis was performed on the final models to check for normality and heteroscedasticity.
A case-matched, multivariable analysis was undertaken to further examine the statistical relationships between the stable and progressive CKD groups and the outcome variables outlined above.
Throughout, the level of significance was set at p<0.05.
All statistical analyses were performed using STATA V.14.1.
Results
Cohort characteristics
Two hundred and six patients with CKD and 22 HVs were enrolled. Results were available for 19 HVs (two had eGFR <60 mL/min/1.73 m2, one failed collection) and 197 patients with CKD (nine samples either failed collection or testing). The cohort characteristics are shown in table 3. Primary cause of CKD was biopsy proven in 31 (16%) patients. No HV had proteinuria.
Baseline characteristics
CKD progression
Of 197 patients, 36 had progressive CKD, 55 were stable, 76 were unstable, and in 30, follow-up results were unavailable. Of the 36 progressive patients, only 15 pairs could be matched for eGFR, age and gender due to the high proportion of progressors being CKD stages 4–5.
Proteinuria and CRP in patients with CKD
One hundred and nineteen of 197 (60%) had proteinuria, 19 were >300 mg/mol, maximum 1000 mg/mol. Nineteen of 192 (9.9%) patients had an elevated CRP, nine were >15 mg/dL, maximum 62.5 mg/dL.
Relationship between CKD stage/eGFR and MK
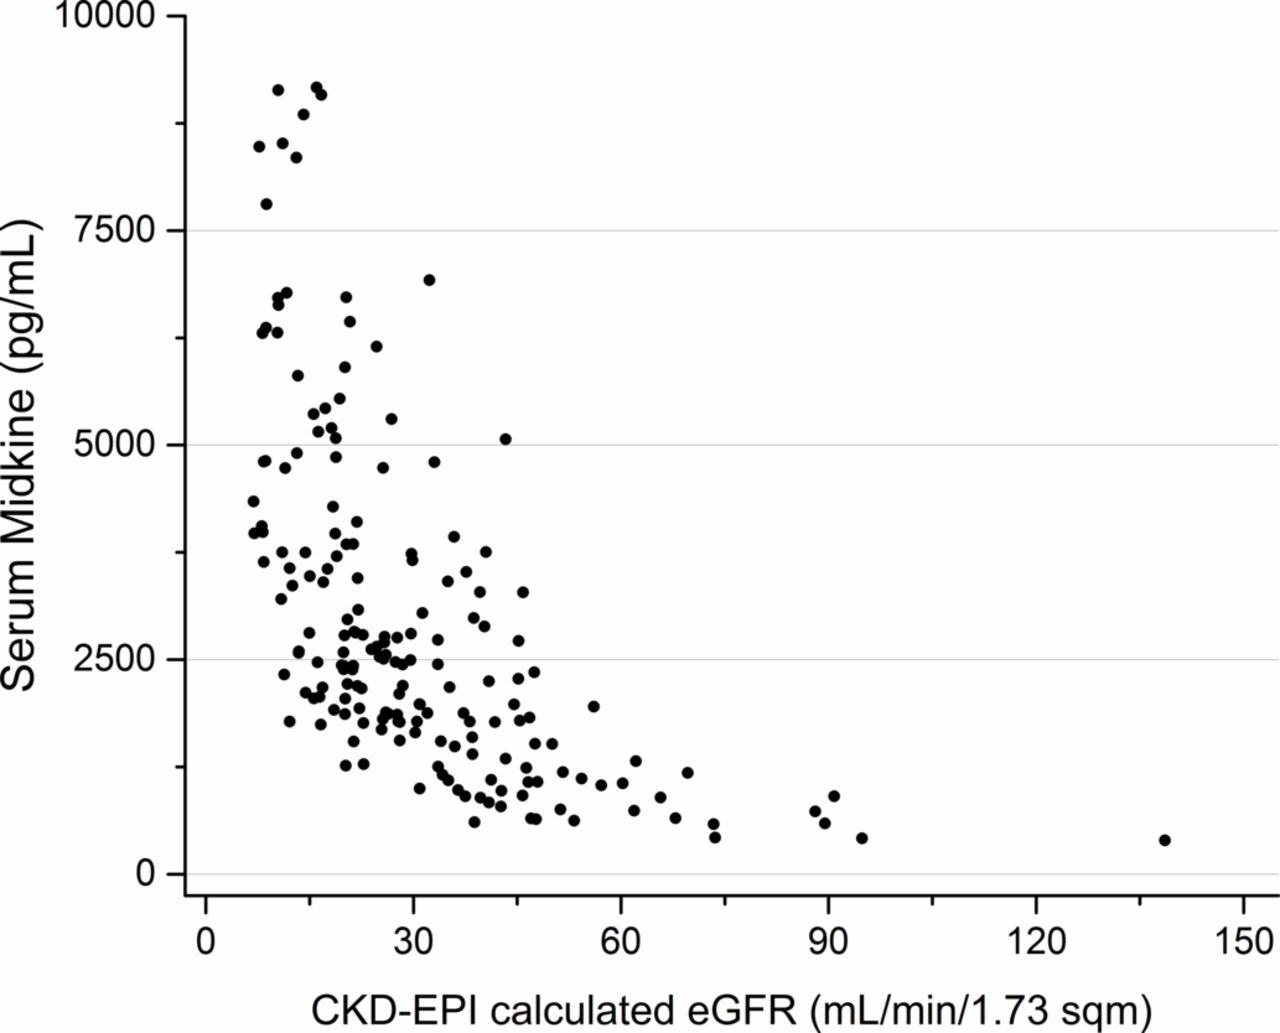
Of the 197 CKD patients, 192 patients had samples sufficient to analyse urine MK, and 191 patients had samples sufficient to analyse serum MK. The relationship between MK and CKD stage and eGFR is shown in figures 1–4. The median serum and urine MK level in HV were 754 pg/mL (IQR: 554–1025) and 239 pg/mL (IQR: 154–568), respectively. Compared with serum MK in stage 1 CKD (660 pg/mL, IQR: 417–893), serum MK increased in stage 3 (1878 pg/mL, IQR: 1188–2756; p<0.001), 4 (2768 pg/mL, IQR: 2065–4735; p<0.001) and 5 (4816 pg/mL, IQR: 3747–7807; p<0.001) (figure 1). Compared with urine MK level in stage 1 CKD (343 pg/mL, IQR: 147–437) urine MK increased in stage 3 (1007 pg/mL, IQR: 465–2766; p=0.07), 4 (2961 pg/mL, IQR: 1368–5686; p=0.005) and 5 (6722 pg/mL, IQR: 3796–10 060; p=0.001) (figure 2). Serum MK correlated with eGFR (r2=0.04), but correlation with urine MK level (r2=0.06) was not significant (figures 3 and 4). One hundred and eighty-six patients with CKD had complete sampling for calculation of FeMK. FeMK also increased with increasing CKD stage. Compared with FeMK in stage 1 CKD (0.159, IQR: 0.145–0.299), FeMK increased in stage 3 (1.024, IQR: 0.451–1.886, p=0.047), 4 (3.39, IQR: 2.10–5.82, p=0.004) and 5 (11.95, IQR: 5.36–24.41, p<0.001) (figure 5), maximum 66.81%.

Relationship between serum midkine (MK) (pg/mL) and chronic kidney disease (CKD) stage. Values >10 000 excluded for visual purposes. Diamond=outlying results; shaded boxes= median andinterquartile range; whiskers=95 and 5 percentiles; squares=mean.

Relationship between urine midkine (MK) (pg/mL) and chronic kidney disease (CKD) stage. Values >10 000 excluded for visual purposes.

Relationship between serum midkine (MK) (pg/mL) and estimated glomerular filtration rate (eGFR) (ml/min/1.73 m2). Values >10 000 excluded for visual purposes. CKD-EPI, Chronic Kidney Disease Epidemiological Collaboration.

Relationship between midkine (MK) (pg/mL) and estimated glomerular filtration rate (eGFR) (mL/min/1.73 m2). Values >10 000 excluded for visual purposes. CKD-EPI, chronic kidney disease epidemiological collaboration.

Relationship between fractional excretion of MK (FeMK) (%) and estimated glomerular filtration rate (eGFR) (mL/min/1.73 m2). FeMK values >300 have been excluded for visual purposes.
Relationship between demographics and MK (adjusted for eGFR)
Multivariate analysis was carried out and eGFR (and therefore CKD stage) was found to be the only independently associated factor. That is why further relationships presented in the results were corrected for eGFR. For medications, the use of angiotensin blockade (ACE inhibitors (ACE-I) or angiotensin II receptor blocker (ARB)), was negatively correlated with urine (p=0.018) and FeMK (p=0.025). This correlation remained when corrected for PCR (p=0.03). There was no correlation with any other medications. When the data were adjusted for eGFR, no correlation was found between serum (p=0.64) or urine (p=0.23), MK and PCR; however, there was a positive correlation with FeMK (p=0.003).
Relationship between progressive CKD and MK (adjusted for eGFR)
There was no relationship between CKD progression and MK levels in serum and urine nor FeMK (once case-matched for eGFR) (n=15 progressive, 15 stable) (table 4).
CKD progression and MK levels (pg/mL)
Discussion
In this clinical cohort of CKD patients, serum and urine MK levels significantly increased sequentially from CKD stages 3–5, with both serum and urine levels 10 times higher than the HVs or that previously described in the normal population.9 There was no significant relationship between MK and either diagnostic category or CKD progression in this cohort, but the sample size was underpowered for these outcomes.
There are a number of possible explanations for the positive relationship between MK levels and CKD stage. These include potential contributions from altered renal clearance, increased intrinsic renal tubular production and CKD itself being a proinflammatory state.
First, we must consider the effect of renal clearance on MK levels. It remains unclear as to whether MK (13 kDa protein) circulates free (filterable) in the setting of CKD or protein bound (unfilterable). Hayashi and colleagues25 suggest that MK is protein bound in the circulation and therefore not filtered, although based on the work by Weckbach,10 it would seem that this protein binding may be adherent to the glycocalyx (immobilised and inaccessible to the assay) rather than to circulating proteins. If this were the case, then the measured serum MK levels could represent soluble ‘free’ levels (as it moves in and out of the glycocalyx), capable of being filtered through the glomerulus. This could explain the rapid but transient increase in serum MK levels seen with heparin (high affinity) administration in ischaemic heart disease patients and in normal HVs.22 In patients post-percutaneous coronary intervention, abdominal aortic aneurysm repair or cardiopulmonary bypass, where MK as a biomarker is also being explored, circulating MK levels may not only be influenced by heparin administration but by the physical effects of glycocalyceal disturbance associated with reperfusion.23–26
If MK is indeed filtered, it would be expected that MK filtration would decrease (glomerular loss) and excretion would increase (proximal tubular failure) as nephron mass is lost. There is no direct data for MK as there are for other similarly sized proteins,32 so the exact quantification of ‘expected’ MK excretion variations in response to falling clearance has not been established. However, the observed wide variation in levels and the high FeMK in some (up to 60%) raises the possibility that MK levels in patients with CKD are influenced by more than just clearance alone.
Second, increased systemic or intrinsic renal production in the setting of CKD are both possible. This is consistent with animal studies showing that MK production in the renal tubules is increased in streptozotocin-induced diabetic nephropathy and the increased MK found histologically in the tubules of human diabetic kidney biopsies.13 This could also explain the unexpectedly normal predialysis (baseline) serum MK levels reported in the aforementioned haemodialysis study.22 One might expect, if MK is renally cleared, that predialysis levels would be high, but they were <1000 pg/mL in that study, equivalent to HVs. One explanation for this could be that this cohort had been on dialysis for 9.2±3.5 years22, and the residual renal tissue had few functional tubule cells capable of producing MK protein. The fact that dialysis patient serum MK levels still peaked in response to heparin22 suggests that the MK bound in the glycocalyx adjacent to the endothelium remains present and mobilisable. The absence of urine MK elevation immediately postcardiac bypass (despite increases in measured serum levels)24 may also be attributable to heparin binding in this cohort.
Third, MK is known to be associated with inflammation, but few patients with elevated MK levels had an increased CRP, suggesting the elevated MK was not simply due to systemic inflammation.
In fact, the reason for elevated MK levels in CKD is likely multifactorial, with uraemia perhaps causing chronic glycocalyceal disturbance, increased production and decreased clearance. Regardless of the aetiology, it does appear that patients with CKD are exposed to supraphysiological levels of MK in both serum and urine. This chronic exposure to high MK levels may be relevant in light of recent studies supporting a pathological role of MK in a number of the systemic diseases associated with CKD. MK has been implicated as a potential driver of progressive kidney damage and CKD-associated hypertension,15 17 vascular disease18 19 and cardiac dysfunction.20 21 With MK known to be associated with cancer promotion,4 it could be speculated that the chronically high urinary levels may contribute to the increased incidence of urothelial malignancy seen in patients with CKD.6 33
Preliminary analysis of the data suggested a relationship between both serum and urine MK and progressive CKD but was confounded by the increased risk/rate of progression with decreased eGFR. This resulted in limited numbers for comparison. A validation cohort would be necessary to exclude or confirm this.
There was no independent relationship found between diagnostic category and MK levels, although this study had inadequate power to be conclusive. This may seem unexpected when considering the different pathological processes of glomerular, vascular and tubular injuries. However, with the higher MK levels seen at later stages of CKD, it is possible that if MK plays a pathogenic role, it is late, when the common pathway of fibrosis and scarring becomes a major contributor.34
Although the observation of increased FeMK with increasing proteinuria is not surprising, the finding that angiotensin blockade is associated with both lower urine MK levels and FeMK, even after correction for proteinuria, is of interest. Proteinuria is associated with chronic and progressive tubulointerstitial damage in CKD, and although a number of mechanisms for this have been identified, the processes are not fully understood.35 36 The proinflammatory and fibrotic effects of a chronically elevated intrarenal and/or urinary MK level may be one mechanism by which proteinuria drives progressive renal damage, with MK shown as being upstream from the established drivers (chemokines such as MCP-1, macrophage infiltration, TGF-β, osteopontin) of induced injury.11–13 This association with angiotensin blockade (ACE-I/ARB) was of particular interest in light of the study by Hobo and colleagues.15 In a hypertensive 5/6 nephrectomy animal model, they showed that MK upregulates the renin-angiotensin system (RAS) and that blocking MK downregulates the RAS and reduces renal consequences. It is accepted that RAS stimulation in CKD contributes to CKD-associated hypertension and that blockade confers renal protection, with reduction in proteinuria and GFR loss.35–37 The observation that angiotensin blockade is associated with both lower urine MK levels, and FeMK does not prove a causal relationship, but in patients with CKD raises MK as a potential mechanism by which renal protection occurs with ACE-I or ARBs.
Study limitations
This is a single health service, single timepoint observational study, and the population is primarily Caucasian, which must be considered in respect to generalisability.
All MK measurements were done using an ELISA assay. Although the Cellmid assay has a validation profile with a strong affinity to detect the presence of the MK protein, we cannot confirm whether the assay is detecting free protein, active protein or potentially inactive fragments. Assay accuracy in urine is still being validated, but as MK is rich in basic amino acid and cysteine residues, it is likely to maintain structural stability, which allows accurate measurements of urinary MK.25 The assay, however, does not distinguish between that filtered from the serum and that produced de novo by the renal tissue. This is an important distinction to make, as explained above, with de novo production perhaps representing a response to, driver of, or marker of progressive injury. Quantification of this ‘intra-renal MK activity’ may be more relevant but beyond the ability of an ELISA test. FeMK is also a novel and unvalidated parameter in MK measurement, and assumptions have been made based on data available for lysozyme, which is of equivalent size. Other differences in kinetics must be considered.32
Although the nephrology clinic setting of this cohort offers advantages regarding ‘bench to bedside’ introduction of biomarkers, it does introduce complexities. Kidney biopsy tissue would have been helpful to elucidate the cellular origin of the MK in the urine, but additional tests when not clinically indicated would have been inappropriate and/or greatly compromised recruitment. Non-invasive indicators (messenger RNA, exosomes) may be helpful in the future. The PCR was measured in urine collected at the clinic, and so was not always an early morning sample, which must be considered when interpreting the results. However, using 24-hour collections, or separating sampling from the clinic visit (ie, the next morning), would not have been feasible.
A relationship between MK and progressive CKD would have supported the concept of MK as either a biomarker or a direct nephrotoxin; however, patient numbers were limited once the strict criteria were applied. It was striking to see how few patients met these criteria and lead us to ponder the impact this may have on clinical trial outcome measures. Likewise, the current study was underpowered to confirm homogeneity of MK levels across diagnostic categories. The lack of a biopsy-proven diagnosis could be criticised; however, in the Australian end stage kidney disease (ESKD) population recorded by ANZDATA,38 the frequency of biopsy diagnosis is 75% of glomerulonephritis and 15% of non-glomerulonephritis, consistent with our biopsy diagnosis rate of 16%.
Conclusion
This is the first study to analyse MK levels in a CKD population and reveals that serum and urine MK levels become higher with increasing CKD stage, more than 10-fold by CKD 5. The source of these high levels is at least in part related to clearance, although there is also support for increased renal tubular production in the CKD setting. The impact of chronic systemic exposure to these supraphysiological levels is yet to be established, but increasing animal data suggest this may be systemically significant, and the relationship with RAS blockade and proteinuria supports the possibility of MK being a driver in the final converging pathological stages of CKD. More research is required to explore MK’s role in the progression and systemic consequences of CKD and its potential as a biomarker and therapeutic target.
Acknowledgments
This has been an investigator/industry partnership. The authors would like to thank the Wishlist Foundation for a $21 000 grant to support this research, and Cellmid Ltd for additional funding including all blood and urine testing. Thank you also to all the staff of the Nambour General Hospital Renal unit for their hard work and dedication to ensuring the efficient completion of this study, and to our patients for their commitment.
References
Footnotes
Contributors VKC: principal investigator; CMA: statistical analysis; RPG: data management; DCC: data management; CJC: recruitment and manuscript review; EPN recruitment and manuscript review; KM: recruitment and manuscript review; PRH: recruitment and manuscript review; AJP: research coordinator; STH: pathology technician; DRJ: literature research; NAG: coinvestigator, recruitment and manuscript review.
Funding This work was funded as a industry/investigator partnership, with funding from Cellmid Ltd and grant funding from the Wishlist Foundation.
Competing interests Victoria Campbell receives a consultancy fee from Cellmid Ltd. Darren Jones was an employee of Cellmid Ltd. Sharron Hall has salary support from Cellmid Ltd. Dominic Burg is an employee of Cellmid Ltd.
Ethics approval Royal Brisbane Hospital HREC/12/QRBW/56.
Provenance and peer review Not commissioned; externally peer reviewed.
Data sharing statement There are no additional unpublished data from this study; however, the complete (deidentified) dataset can be made available upon request, and spare sample aliquots have been stored (with individual patient consent) for potential future use.