Article Text

Abstract
Background Accurate estimation of prognosis in multimorbid hospital patients could improve quality of care. This study aims to determine the relative importance and added value of a performance-based activities of daily living (ADL) measure with regard to mortality prediction.
Methods 200 inpatients, aged over 60 years, were recruited at the Department of General Internal Medicine at a tertiary university hospital. Two nested survival models were built, one with established risk factors (age, sex, Charlson comorbidity index, haemoglobin, albumin, body mass index and glomerular filtration rate), and one using the same covariates with the Gottfries-Bråne-Steen (GBS)-ADL measure added. The relative importance of GBS-ADL was evaluated in the full model. The added value of GBS-ADL was determined by comparing the nested models using four approaches: difference in overall χ2, discrimination, continuous net reclassification index (NRI >0) and integrated discrimination improvement (IDI).
Results In the full model, GBS-ADL was the single most important predictor of mortality (χ2-df=30, p<0.001). The likelihood ratio χ2 test showed significant added value of ADL (p<0.001). The C-statistic was 0.78 with ADL and 0.72 without (difference 0.058, 95% CI 0.022 to 0.094). The NRI >0 was 0.42 (95% CI 0.20 to 0.58) and IDI 0.15 (95% CI 0.07 to 0.22).
Conclusions Compared with a set of available clinical risk factors, impairment in ADL was a stronger predictor of all-cause mortality, showing substantial added value. Implementing quantitative ADL measurements could enable more appropriate and individual care for the elderly.
- aging
- comorbidity
- mortality
- functional status
- statistical modeling
This is an Open Access article distributed in accordance with the Creative Commons Attribution Non Commercial (CC BY-NC 4.0) license, which permits others to distribute, remix, adapt, build upon this work non-commercially, and license their derivative works on different terms, provided the original work is properly cited and the use is non-commercial. See: http://creativecommons.org/licenses/by-nc/4.0/
Statistics from Altmetric.com
Strengths and limitations of this study
A rigorous survival analysis was used to determine the relative importance of impaired activities of daily living (ADL), compared with readily available clinical information.
Four different methods were used to determine the added prognostic value of impaired ADL.
However, the study was a secondary analysis, using data from an intervention study, and a larger study is needed.
Only one ADL measurement was used, the results need to be confirmed for other ADL scales to be considered generalisable.
Introduction
Improving the accuracy of prognostic estimates could have several benefits for medical inpatients. Such benefits include reduced overtreatment, such as polypharmacy or the use of life-sustaining measures inconsistently with patients’ preferences.1–4 Other elderly patients are withheld treatment due to an incorrectly supposed poor prognosis, this could possibly be another important aspect.5–7 Furthermore, patients with poor prognosis may prefer improved quality of life over extended survival. Therefore, accurate estimates could support doctors initiating a discussion regarding goals of care.8 In addition, advance care planning could help patients and families to make necessary arrangements and increase quality of life.9–11
Impairment in activities of daily living (ADL) is a well-known predictor of mortality and lower quality of life in hospitalised and community-dwelling elderly.12–20 However, the majority of studies use interview-based scales,13 15 18 shown to differ significantly from performance-based ones.21 22 In addition, several studies use regression models without reporting overall performance14 15 18 23 and only few studies determine the added value of ADL.13 15 Recently, novel statistical methods have been introduced to establish the incremental value of prognostic markers.24
In this article, we aim to use these methods to determine the relative importance and added value of a performance-based ADL measure compared with clinical data, with regard to mortality prediction.
Method
This study constitutes a secondary analysis, all patients were concurrently taking part in a prospective trial, aiming to improve quality of care.25
Setting
The study was carried out at the Department of General Internal Medicine at Skåne University Hospital in Malmö, Sweden. This teaching hospital provides care to the city’s approximately 300 000 inhabitants. The department has four wards, with a total of 100 beds. Patients are admitted through the hospital’s emergency department. Normally, the patients in the department are elderly with multiple comorbidities. More specialised medical departments (cardiology, nephrology, endocrinology, etc) are separate and were not included in this study.
Patients
The recruitment of patients, that took place in 2009 and 2010, has been described in detail in a previous publication, including a flowchart.25 In short, patients aged over 60 years, living in their own homes were eligible. Exclusion criteria comprised terminal disease, language barrier, blindness/deafness/aphasia or other disease with inability to communicate, transfer to another department/intensive care unit, early discharge and isolation due to communicable disease.
In total, 200 patients were included and underwent a baseline measurement. One half (101) of the patients constituted a control group while the other half (99) received a hospital-based, multidisciplinary intervention aiming to reduce rehospitalisations. The intervention consisted of a medication overview, improved discharge planning, telephone follow-up and improved liaison with general practitioners. Group allocation (intervention or control) used convenience sampling with geographic selection. At 1 year follow-up, the intervention group had significantly fewer rehospitalizations than the control group.25
ADL measurement
As part of the baseline measurement in the original trial, an ADL measurement was implemented by two experienced occupational therapists, who had received special training. The assessment was carried out when patients were stabilised, typically a few days into the admission.
The ADL subset of the Gottfries Bråne Steen (GBS) scale rates six items: dressing, food intake, physical activity, spontaneous activity, personal hygiene and toileting.26 Items are scored on a performance-based 7-point scale ranging from 0 (best) to 6 (worst). For example, dressing is scored as follows:
0: Dresses and undresses without help.
1:
2: Gets help with buttons, zips, etc.
3:
4: Requires help from a caregiver to dress and undress but takes an active part.
5:
6: Is completely dependent on a caregiver to be dressed and undressed.
The points 1, 3 and 5 are not defined but are used by the observer to increase discrimination. Combining the six items gives a total ADL score of 0 (no impairment) to 36 (maximum impairment).
Other data from the original trial protocol
The Charlson comorbidity index was collected from the original protocol to obtain a measure of combined comorbidity.27 This index’ performance concerning short-term and long-term mortality has recently been validated.28
Data collection from medical records
Additional data were collected retrospectively regarding physiological and laboratory values. Since no blood samples were drawn in the original trial, only clinical data could be used. Candidate predictors were selected a priori on the basis of availability and previously established association with all-cause mortality. All data were obtained from the same hospital episode as ADL was measured. If a blood sample had not been drawn during that hospitalisation, the data point was labelled ‘missing’. If several blood samples were taken during the hospitalisation, the one closest to admission was used. The following variables, all independently related to all-cause mortality, were collected: Body mass index (BMI), kg/m2; haemoglobin, g/L; estimated glomerular filtration rate (eGFR), mL/min; albumin, g/L and brain natriuretic peptide (BNP), ηg/L.29–33
Statistical method
This study was a secondary analysis, thus no specific power calculation was done beforehand, this had been done for the original intervention study, although with a different research question.25 The goal of this study was to compare the GBS-ADL measurement with the best set of available clinical risk factors using survival analysis. First, we built a multivariate Cox regression model, called ‘model without ADL’, using the established risk factors as covariates. Then, this model was refitted, with ADL added, to obtain the ‘full model’. To determine the added value of ADL, the performance of these two models were compared. In addition, the relative importance of ADL was examined in the ‘full model’.
The modelling algorithm is based on previous recommendations, primarily by Harrell et al and Steyerberg et al.24 34–37 All steps are explained in larger detail in online supplementary file 1. All modelling was executed in R, the script is supplied in online supplementary file 2.
Outcome. The study endpoint was mortality status on 6 Feb 2014. Follow-up was defined as time from discharge of the original hospitalisation.
Crude analysis. Separate bivariate proportional hazards regressions were carried out for all variables on their original scaling. Crude analysis were accomplished for all separate ADL items but in further analysis only the total GBS-ADL score was used.
Missing data. Missing values in covariates were quantified and controlled for systematic patterns resulting in their missing status. Missing values were then imputed using an imputational regression model.
Variable transformations. Haemoglobin was prespecified to have a non-linear association with mortality. All other continuous variables were tested for non-linearity and transformed accordingly. Outliers were controlled for data entry errors and considered for truncation.
Fitting the two multivariate models. The ‘model without ADL’ was fitted first, using the transformations and imputations described above. Then, ADL was added and the model was refitted to obtain the ‘full model’.
Multicollinearity. The models were tested using the variance inflation factor.
Interactions. Pooled two-way interaction tests were carried out for all variables, in both models, separately. If the pooled test was significant, specific interactions were pursued for that variable.
Proportional hazards. The proportional hazards assumption was tested with global tests and Schoenfeld residual plots for each variable.
Influential observations. Observations with a standardised DfBeta >0.20 SE were noted for each variable. As ADL was of particular interest, a sensitivity analysis was performed without this variable’s influential observations.
Determining the relative importance of ADL. As the models contained non-linear variables as well as interactions, simple measurements of main effects, such as HRs, could not be used. To obtain an estimate of the relative importance of the different predictors, an analysis of variance test was used instead, where interaction terms and non-linear terms are incorporated into each variable.
Determining added value of ADL. To determine added value, the ‘model without ADL’ and the ‘full model’ were compared using:
Likelihood ratio test. Performed as a χ2 testing the difference in likelihood ratio between the models’ χ2 over df = number of additional independent variables.
Discrimination, measured with the C, or concordance, statistic. The C-statistic is the probability that, in a case–control pair, the case will be given a higher predicted risk from the model than the control. C-statistics ranges from 0.5 (coin toss, useless) to 1.0 (perfect discrimination). The difference in C-statistic between models was tested using the method described by Uno et al.38
Continuous net reclassification index (NRI >0)39 40 This index determines to what extent adding a new variable leads to a change in the correct direction of predicted risk for each observation (towards higher risk for deceased, towards lower for survivors). NRI ranges from 0 (no increased value, useless) to 1 (all cases reclassified in the right direction). NRI has been shown to be more sensitive than change in C-index, especially when the baseline model has a good performance.
Integrated discrimination improvement (IDI). Originally developed by Pencina et al for logistic models, IDI has been extended to time-to-event data.39 41 While NRI >0 measures the percentage of observations that have been reclassified, it cannot distinguish between a small change in prediction and a large. IDI, however, measures the mean amount of such change. IDI and NRI with CIs were calculated with the method by Uno et al.42
Internal validation. Both models were internally validated through 1000 bootstrap resamples to estimate the amount of overfitting and to obtain optimism-corrected performance estimates.
Updating and presenting final model. The ‘full model’ was updated through the use of a least absolute shrinkage and selection operator (LASSO) procedure to reduce the effects of overfitting.43 44 The updated LASSO model was used to build a nomogram, with which patients were stratified into four equally sized risk groups, displayed in a Kaplan-Meier graph.
Results
In two cases, mortality status could not be obtained; these were discarded from further analysis. Of the remaining 198 cases, 126 were deceased at follow-up. The median follow-up time for survivors was 1428 days (range 1312–1548). Baseline characteristics are displayed in table 1.
Baseline characteristics
The results from the crude analysis are presented in table 2.
Crude analysis
BNP was missing in 115 cases (58%) and the variable was discarded from further analysis. eGFR and BMI were missing in 1 and 3 cases, respectively; these were considered to be missing completely at random. Albumin was missing in 17 cases, these were predominantly female (15/17) and had lower scores on Charlson comorbidity index. Missing values were imputed with a minimal change in variable properties (see online supplementary file 1).
Haemoglobin was fitted using a 4-knot restricted spline, and GBS-ADL was transformed using the natural logarithm. No other predictors showed significant non-linear properties and they were kept in their original form. eGFR had one extreme outlier at 198 mL/min that was winsorised at the 99th percentile (118 mL/min).
A significant sex–BMI interaction was found and included into the models (low BMI was a significant predictor in men but not in women). Another interaction, eGFR–ADL, was included as well (ADL was a stronger predictor when eGFR was unimpaired and vice versa). No other significant interactions were found. No significant multicollinearities were found. The proportional hazards assumption was not violated. In the full model, 21 observations were influential, of which nine for ADL and/or its interaction with eGFR. A sensitivity analysis with these cases removed showed a slight improvement in model fit and is presented in online supplementary file 1. However, all observations were kept in the models.
In the ‘full model’, ADL was by far the most significant predictor. The relative importance of the predictor variables is shown in figure 1. All four measurements showed added value for model with ADL (see table 3).
Added value of ADL
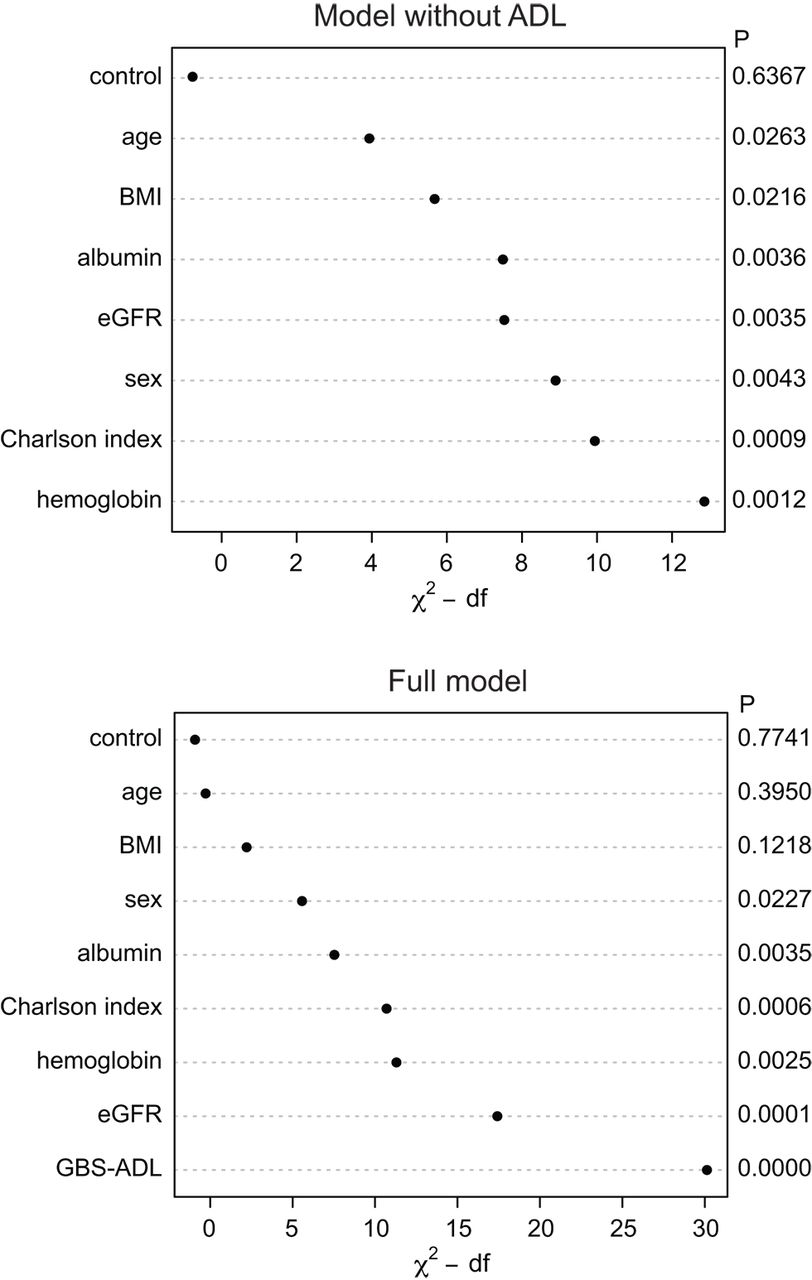
Relative importance of predictors in the multivariate ‘model without ADL’ and the ‘full model’. Interaction terms and non-linear effects have been incorporated in the variables. A higher χ2-df value indicates a stronger association. Control—the grouping variable from the original study. BMI, body mass index; eGFR, estimated glomerular filtration rate; GBS-ADL, Gottfries-Bråne-Steen—activities of daily living.
When bootstrapped 1000 times, the calibration slope of the ‘model without ADL’ was 0.84 and of the ‘full model’ was 0.83. Optimism-corrected R2 was 0.27 versus 0.40, respectively. Optimism-corrected C-statistics were 0.70 and 0.76. When the LASSO was employed to shrink coefficients and update the model, the mean shrinkage was 0.84. The nomogram using the updated model coefficients is shown in online supplementary file 1 and the subsequent Kaplan-Meier graph for the four risk groups are presented in figure 2.

Kaplan-Meier estimates from the updated full model including customary risk factors and ADL. The participants have been stratified into four equally sized groups by quartiles of risk. ADL, activities of daily living.
Discussion
In this study, we confirm that impaired ADL is an important predictor of mortality in elderly medical inpatients. The relative contribution of ADL was larger than of the available predictors in a real-life setting, including a comorbidity index, available physiological parameters and laboratory values. In addition, ADL showed a substantial added value when compared with a model combining all of these traditional predictors.
In the crude analysis, four of the GBS-ADL items were stronger predictors than the Charlson comorbidity index. Thus, a simple rating of dressing ability had better predictive value than a combined comorbidity measure, designed to predict mortality. This indicates that performance-based ADL measures are truly important mortality predictors in multimorbid patients. In multivariate analysis, impairment in ADL was by far the most important predictor and all four measures signalled added value when GBS-ADL was added to the traditional predictors.
The mechanism underlying the association between ADL and mortality is probably multifactorial. Impairment in ADL could contribute directly to mortality in some aspects. Obvious complications to functional decline include pressure sores, atrophy, falls, thrombosis, etc. However, less intuitive factors could also apply, such as attaining multiresistant bacteria or Clostridium difficile.45 46 Even more likely, ADL acts a proxy for a confounder not measured by the model. A possible such confounder is frailty, defined as an increased vulnerability, where small stressors lead to adverse outcomes, such as hospitalisation or death.47 The frailty phenotype includes unintentional weight loss, along with loss of strength, low physical activity, slow walking speed and exhaustion.48 There is a considerable overlap between frailty, comorbidity and ADL impairment. Our study used specific measures for comorbidity and ADL impairment, but not for frailty. However, our model is most likely describing the effects of frailty as well.
Several methodological issues need to be addressed. First, the choice of ADL scale, where the GBS scale was chosen to facilitate implementation locally. There are large variations and lack of standardisation regarding functional measures used in medical inpatients.49 The GBS scale proved feasible and has been shown to have a good construct validity and inter-rater reliability.50 In addition, the GBS-ADL has correlated strongly with other ADL measurements, for example Katz’ index.51 52 Ideally, two different scales should have been employed to enable a comparison between scales and possibly improve generalisability. A potentially confounding issue was the concurrent non-randomised trial, that is, the intervention could have affected mortality rates. However, the variable ‘control/intervention status’ was included in all statistical analyses, both bivariate and multivariate, without any sign of bias. In addition, no power calculation was done, the sample size was small and internal validation showed that our models were indeed overfitted, with a calibration slope of 0.83. This overfitting is probably not a result of having too many covariates but rather a result of the global interaction tests and tests of non-linearity. This multiple comparison situation has been called ‘testimation bias’.37 The overall aim was not to develop the most comprehensive and parsimonious prediction model to use in future populations but to describe the importance and added value of ADL. Therefore, we prioritised not to miss clinically important interactions and/or transformations in the trade-off with overfitting. To compensate partly, we used a LASSO procedure to shrink estimates. The small sample size and the aim to compare ADL with the best possible model was also the reason underlying the imputation of missing values. In addition, the main diagnosis of the current hospitalisation was not included as a predictor in the analysis. The reason for this was the large heterogeneity of main diagnoses (with 97 different International Classification of Diseases codes in 200 patients), although this could possibly have been achieved with a larger sample size as well.
The primary strength of this study is the rigorous statistical approach. State-of-the-art methods were used in the model building to handle missing data, to address non-linearity, to screen for interactions, for model diagnostics and for internal validation. In addition, four different methods were applied to estimate added value. Previously, a study has showed increase in model χ2 when adding a composite ADL measure, regarding 2-year mortality.15 However, this study compared ADL only with comorbidity indices. With such a limited reference model, it is likely that a new measure will add value but the final model could still perform poorly, which was reflected by low model χ2 values and a final C-statistic of 0.66. The use of comorbidity indices only as reference model is also far from the clinical reality. Another study shows increase in discrimination when adding an ADL measurement to a 1-year logistic regression mortality prediction model.13 This study also starts with comorbidity indices alone and does not report any other measurement of overall performance (such as overall χ2 or R2). Our study compares ADL to a much more complex reference model and yet shows added value using both these previously applied measurements as well as several others.
Implications for further research include research regarding performance-based ADL scales, including the relation to specific frailty ratings. Larger studies could obtain head-to-head comparisons of ADL versus disease-specific predictors, such as ejection fraction in heart failure.
Today, ADL is very often assessed in a variety of ways in medical inpatients to assess the individuals’ needs after discharge. Implementing a performance-based quantitative measurement could have many benefits, also apart from prognostic value, such as increased standardisation and the possibility to follow a patient over time. As a final remark, mortality prediction is not all about avoiding overtreatment due to a poor prognosis. Our model identified 50 elderly multimorbid medical inpatients with a 90% chance of 3-year survival. This group should not be undertreated simply due to age discrimination.
In conclusion, an ADL measurement showed significant added value as a predictor of mortality in a multimorbid elderly hospital population. Implementation of standardised ADL measurements could lead to better prognostic estimates and in the end a more appropriate and individualised care for the elderly.
Acknowledgments
The authors would like to thank Sofia Raccuia, Jenny Cappelin and Anna Johansson for their assistance in the data acquisition.
References
Footnotes
Contributors The study was conceived by LS and LM. Data collection was done by GT and supervised by EL. GT performed all analysis and drafted the manuscript, which was critically revised by LS, LM and EL. All authors have approved the final version.
Funding This study was financed by the Swedish Research Council (Vetenskapsrådet #523-2010-520), the Swedish Brain Power programme, the National Swedish Board of Health and Welfare and the Governmental Funding of Clinical Research within the National Health Services (ALF). All researchers acted independently to the funding bodies. The funding agencies had no role in study design; in the collection, analysis, and interpretation of data; in the writing of the report; or in the decision to submit the article for publication.
Competing interests None declared.
Ethics approval Regionala Etikprövningsnämnden Lund.
Provenance and peer review Not commissioned; externally peer reviewed.
Data sharing statement Since the participants were not specifically asked for consent to share data, such sharing is not compatible with the current Swedish legislation. The data protection officer at Skåne University hospital, the data protection officer at Lund university as well as lawyers at the Swedish data protection authority have unanimously advised us not to publish data, even if anonymized.