Article Text

Abstract
Objective This study aimed to explore the potential for the Waterlow score (WS) to be used as a predictor of 30-day mortality and length of hospital stay (LHS) in acutely admitted medical patients aged 65 years and older.
Design Prospective observational cohort study.
Setting UK District General Hospital.
Subjects 834 consecutive patients aged 65 years and older admitted acutely to medical specialties between 30 May and 22 July 2014.
Methods Admission WS (range 4–64) assessment paired with the patient’s status at 30 days in terms of mortality and their LHS.
Primary outcomes 30-day mortality and length of inpatient stay.
Results 834 consecutive acute medical admissions had their WS recorded. 30-day mortality was 13.1% (109 deaths). A significant difference in the distribution of WS (p<0.001) was seen between those who survived (median 12) and those who died (median 16) within 30 days, particularly within respiratory (p<0.001), stroke (p<0.001), cardiology (p<0.016), non-respiratory infections (p<0.018) and trauma (p<0.044) subgroups. Odds of dying within 30 days increased threefold for every 10-unit increase in the WS (p<0.001, 95% CI 2.1 to 4.3). LHS was also positively linearly associated with the WS in those who survived 30 days (median=5, IQR=10; r=0.32, p<0.01). A five-unit increase in WS was associated with approximately 5 days increase in LHS. On the other hand, quadratic regression showed this relationship was curvilinear and negative (concave) for those who died within 30 days where a five-unit increase in WS was associated with an approximately 10 days decrease in LHS.
Conclusion This study demonstrates an association between a high WS and both 30-day mortality and LHS. This is particularly significant for mortality in patients in the respiratory, stroke and cardiac subcategories. The WS, a nursing-led screening tool that is carried out on virtually all admissions to UK hospitals, could have additional use at the time of patient admission as a risk assessment tool for 30-day mortality as well as a predictor of LHS.
- Waterlow Score
- 30-day mortality
- length of stay
This is an open access article distributed in accordance with the Creative Commons Attribution Non Commercial (CC BY-NC 4.0) license, which permits others to distribute, remix, adapt, build upon this work non-commercially, and license their derivative works on different terms, provided the original work is properly cited, appropriate credit is given, any changes made indicated, and the use is non-commercial. See: http://creativecommons.org/licenses/by-nc/4.0/.
Statistics from Altmetric.com
Strengths and limitations of this study
This prospective cohort study examines the additional utility of the Waterlow score (WS), a widely used tool that is already a mandatory assessment for all patients admitted to hospital in the UK.
This study uses logistic regression and non-linear quadratic regression models for statistical prediction.
The study captures the heterogeneous nature of patients admitted acutely to hospital, as illustrated by the patient subcategories.
This is a study of the potential value of the WS in evaluating risk of death and predicting length of hospital stay in patients over 65 years of age.
This study was based on a single district general hospital and therefore requires further research in a wider context to confirm our observations.
Introduction
Predictive mortality and morbidity scores are widely used to aid clinical decision-making and resource allocation. Hospitals routinely collect a range of data on patient admission; however, this is rarely standardised between hospitals.1 A range of validated risk assessment models are commonly used in everyday clinical settings, usually with reference to a specific pathology, for example, the Mini-Grace risk score2 for suspected acute coronary syndromes. These specific assessment models cannot be extrapolated beyond their validated clinical settings because of their disease specificity. The use of more general prognostic models is limited by their need to consider a broad range of clinical and demographic information due to the heterogeneous nature of patient populations. Broader prognostic models have been developed such as the APACHE (Acute Physiology, Age, Chronic Health Evaluation) III score,3 developed as a gatekeeper to intensive care, and frailty indices4 5 are used in the geriatric setting. However, none are simple or practical and are limited by complexity and time constraints.
The Waterlow score6 (WS) is a multidimensional pressure ulcer risk assessment tool encompassing functional status and comorbidity, which was developed in the 1980s. It is a nursing-led screening tool that is carried out on virtually every patient on admission to a UK hospital. Its components are age, nutritional status, weight, mobility, gender, smoking status, comorbidities, use of medication and continence, all combined to generate a single numerical figure between 2 and 64. Patients with scores over 10 are considered to be at risk of pressure ulcer, while scores of over 15 and 20 are considered to represent high risk and very high risk statuses, respectively.6 Other notable pressure ulcer risk assessments exist,7 but the WS remains the most widely used in the UK.
The primary aim of this study was to look at the potential role of the WS as a predictor of 30-day mortality in acute medical admissions aged 65 years and older and second to look at their length of hospital stay (LHS) as a marker of morbidity burden. The application of the WS is appropriate because its criteria already take into account those of other comorbidity models such as the Charlson Comorbidity Index.8 The latter, a widely used comorbidity measure, is a component of the dataset used in standardised hospital mortality indicators in the UK.9 Deriving additional utility from the WS could aid patient risk stratification, potentially improving patient care and guiding resource management. An association between the WS and outcomes has already been demonstrated in a cohort of surgical patients.10 Furthermore, identifying additional applications of the WS would not incur any additional time resource requirements.
Methods
Study population
Following approval from a research ethics committee, the study group prospectively recruited all consecutive acute medical patients aged 65 years and older admitted during an 8-week period between 30 May and 22 July 2014 to the Lister Hospital, a 720-bed District General Hospital in Stevenage, UK. Patients who were already established on a personalised end of life care plan at the time of admission were excluded. Patients had their admission WS recorded and were followed up for 30 days or until discharge from hospital, whichever occurred first. Repeat admissions of the same patient were considered as a further episode.
Patient information was collated daily. Diagnosis and length of stay were recorded. Sources of data to determine morbidity and mortality included inpatient notes, discharge letters and submissions of death notification to the hospital bereavement office. Summary hospital mortality and death records at 30 days were checked against the bereavement office administrative service. Data were anonymised at the point of collection by the research team.
Patient and public involvement
No patient advocacy was sought in the design of this study. Participants have been anonymised and will therefore not be directly informed of the results. The study was designed to have no interference with the day-to-day patient care and priorities.
Subcategory definition
Patients were classified according to the medical subspecialty managing their discharge diagnosis for subgroup analysis. These were broadly categorised according to their presenting organ-specific sites, including respiratory, cardiology, stroke, haematology/oncology, gastroenterology, trauma, neurology, renal, endocrine and other infections (which excluded respiratory infections). We defined these subcategories to reflect the common breakdown of medical specialities within a general hospital. Cross-speciality patients and patient with multiple diagnoses on discharge were categorised according to their primary discharge diagnosis. At Lister Hospital, the electronic discharge system uses The International Classification of Diseases Ninth Revision (ICD-9) for coding purposes.
Statistical analysis
The analysis was based on determining if the WS at admission was different for those patients who were alive or dead at 30 days. The WS exhibited approximately normal distribution and hence as a conservative approach a non-parametric Mann-Whitney U test was used to compare the distribution of WS between two groups. The result was further explained using a box plot. Subgroup analyses were also performed using Mann-Whitney U test. Binary logistic regression was used to assess the predictability of WS for 30-day mortality. Receiver Operating Characteristic (ROC) analysis is normally carried out as a diagnostic test. We calculated the area under the curve (AUC) to see the accuracy of WS for the 30-day mortality/survival.
The second part of the analysis was to assess if there was a relationship between the WS and LHS. Inspection of the median LHS and WS indicated a large degree of variance. To reduce the effect of outliers, the median length of stay was calculated for each of five index WS categories (4–9, 10–14, 15–19, 20–24, 25+) and displayed using a clustered bar chart. LHS is distributed as positively skewed. Therefore, non-parametric Spearman rank correlation was used between LHS and the WS separately for alive and dead patients. Non-linear quadratic regression was used to determine the predictability of LHS using categorical WS. Both logistic and quadratic regression models were built without consideration of other parameters (univariable) as calculation of the WS included all other variables, and hence, multivariable adjustments were not needed.
P value less than 0.05 was considered statistically significant. IBM SPSS Statistics for Windows V.25.0 was used to conduct statistical analyses.
Results
Patients studied
A total of 834 patients were recruited during the allocated period, of whom 460 (55.2%) were female. Of the population, 207 (24.8%) were aged 65–74, 198 (23.7%) were aged 75–80 and 429 (51.4%) were aged ≥81. Fifty-five (6.6%) episodes were readmissions, of which seven patients had a third readmission. All patients had a WS calculated on admission. A total of 714 (85.6%) of patients had a categorical pathology. The remaining 120 patients, where no firm diagnosis was made or where the diagnosis was based on symptoms alone (eg, chest pain), were grouped into a miscellaneous subcategory for analysis. These subcategories showed a wide variation in patient numbers. As would be expected in acute medical admissions, respiratory, cardiac and non-respiratory infections were the leading subcategories, see table 1. There were 109 deaths (13.1%) recorded at 30 days.
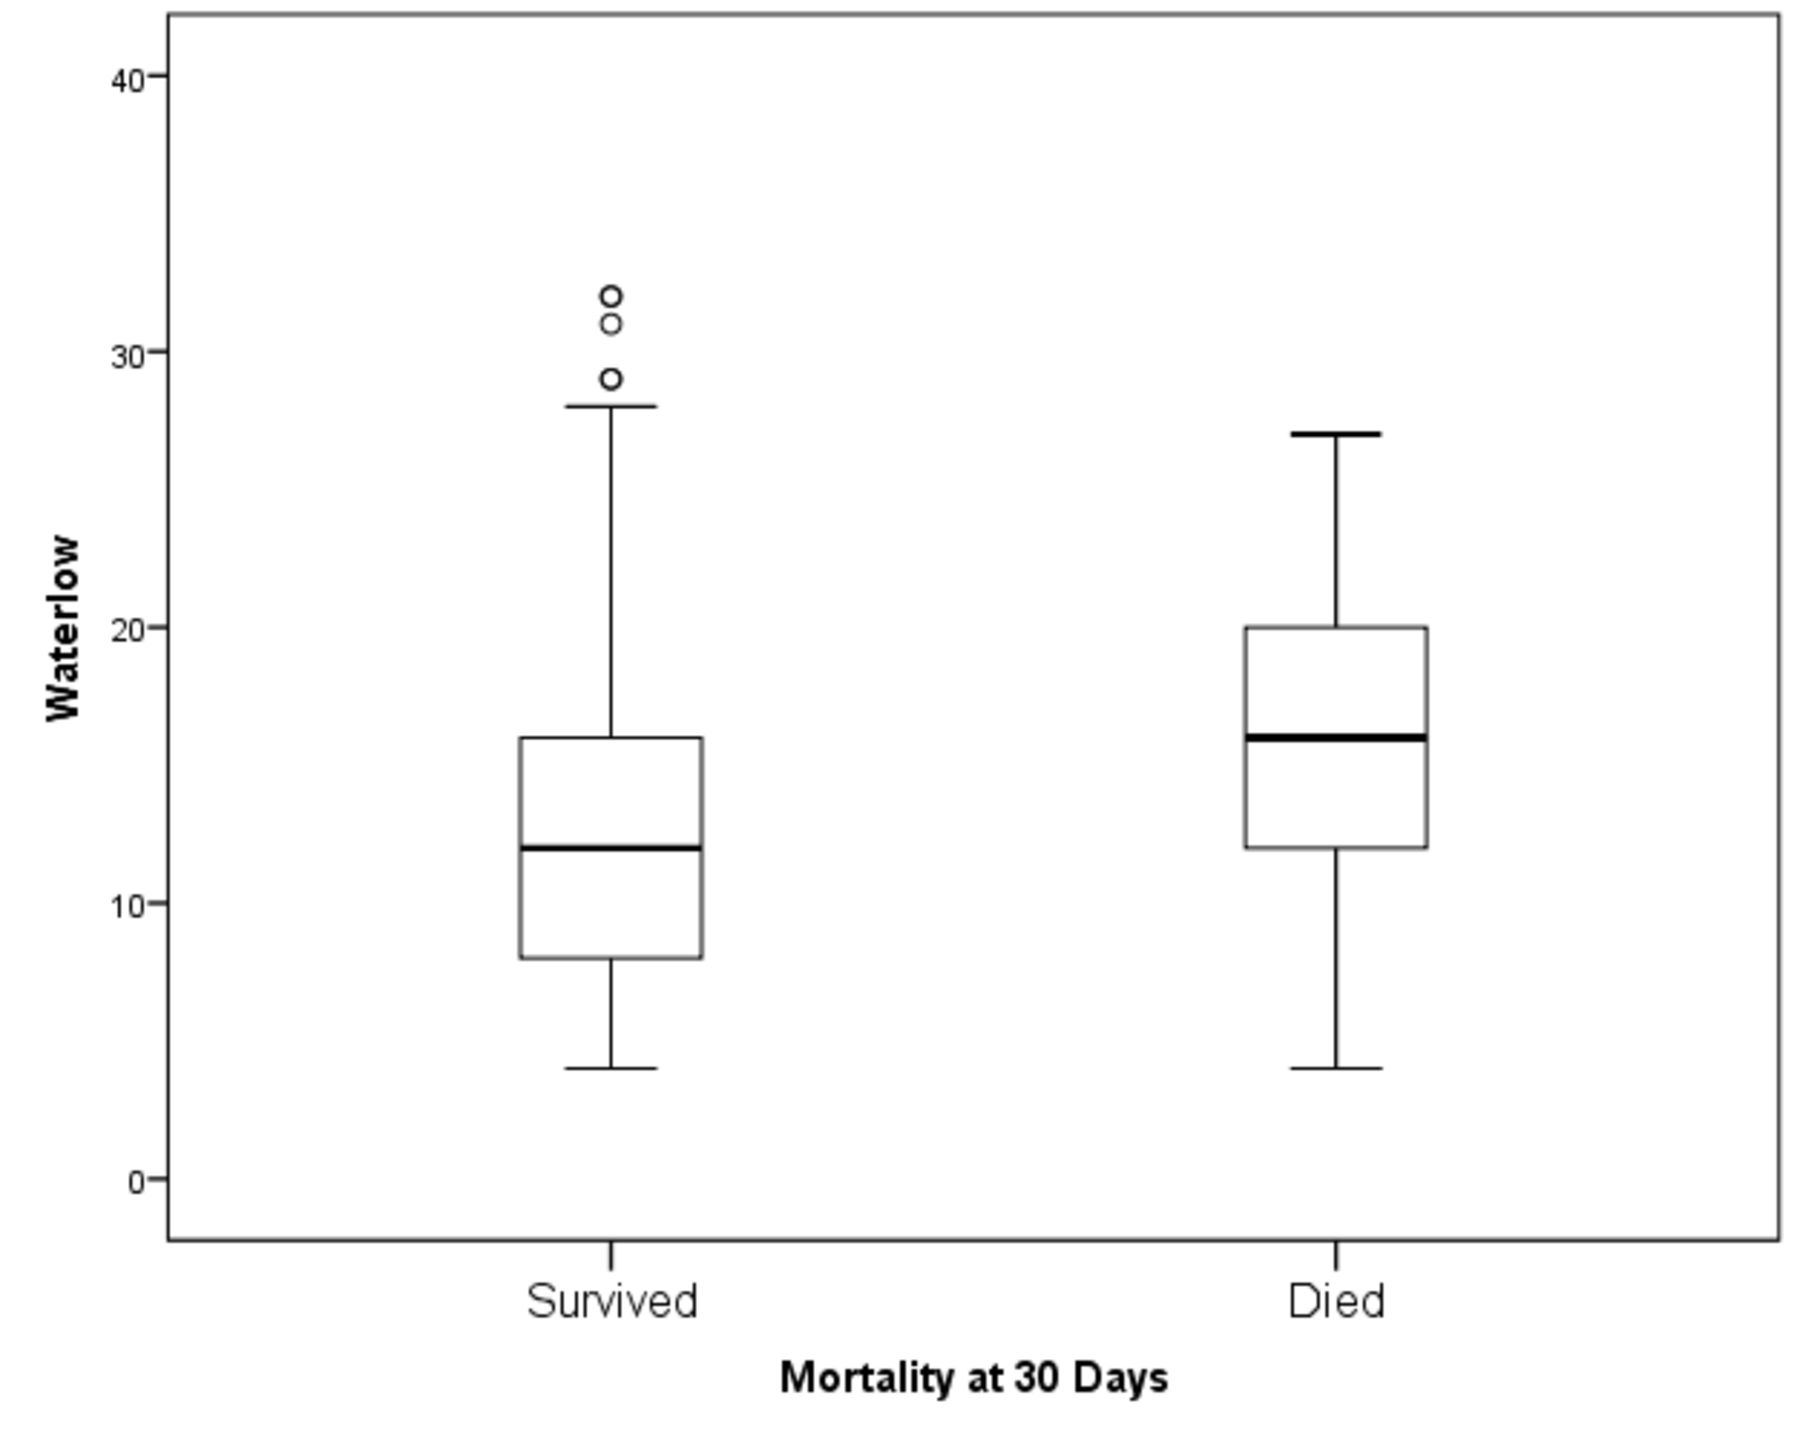
The median Waterlow scores at admission for patients who were alive or dead at 30 days
Relationship between WS and survival at 30 days
There was considerable variation in the WS within the two groups (those who survived and those deceased at 30 days). Mann-Whitney U test was used to assess the difference in the distribution of the WS in terms of 30-day mortality. A significant difference in the distribution of WS (p<0.001) was seen between those who survived (median 12) and those who died (median 16) at 30 days as (see table 1) demonstrated in figure 1. On subgroup analysis, a significant difference in the distribution of WS between those who survived and those deceased at 30 days was also found in the following clinical subcategories: respiratory (p<0.001), stroke (p<0.001), cardiology (p<0.016), non-respiratory infections (p<0.018) and trauma (p<0.044), see table 1.

The box plot for median Waterlow scores for patients who were alive or dead at 30 days postadmission.
Logistic regression model (table 2) showed that the odds of dying within 30 days was increased threefold (exp (1.1)) for every 10-unit increase in WS (p<0.001, 95% CI 2.1 to 4.3). Cox & Snell pseudo R2 was 0.043, indicating only a limited variation in the 30-day mortality can be explained by the WS.
Results of the binary logistic regression model
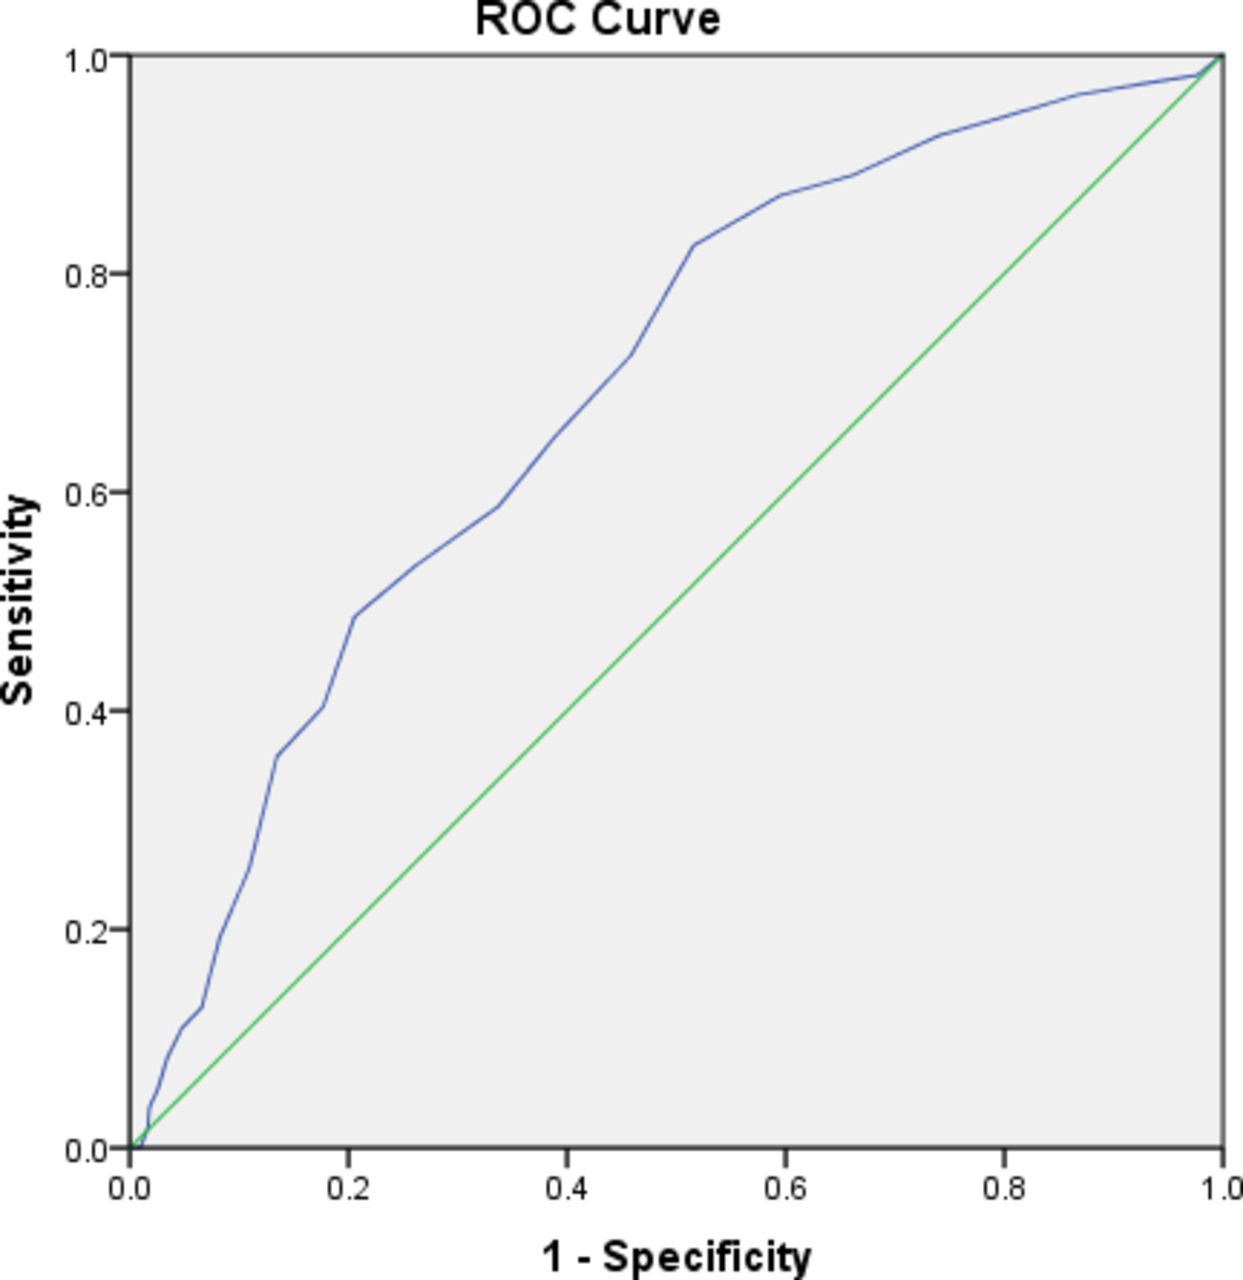
We also studied how well the WS can separate patients in terms of 30-day mortality using ROC curve, see figure 2. The ROC curve demonstrates a relationship with an AUC of 0.69 (95% CI 0.64 to 0.74), which may be considered borderline (between poor and moderate). The actual cut-off value for WS depends on the required sensitivity and specificity in the context. An appropriate cut-off value of WS to separate high-risk patients (based on our ROC analysis, not presented) may be ≥12, which gives a sensitivity of 73% and a specificity of 54%.

ROC curve analysis for Waterlow scores in terms of 30-day mortality (AUC 0.69, 95% CI 0.64–0.74).
Relationship between WS and length of stay
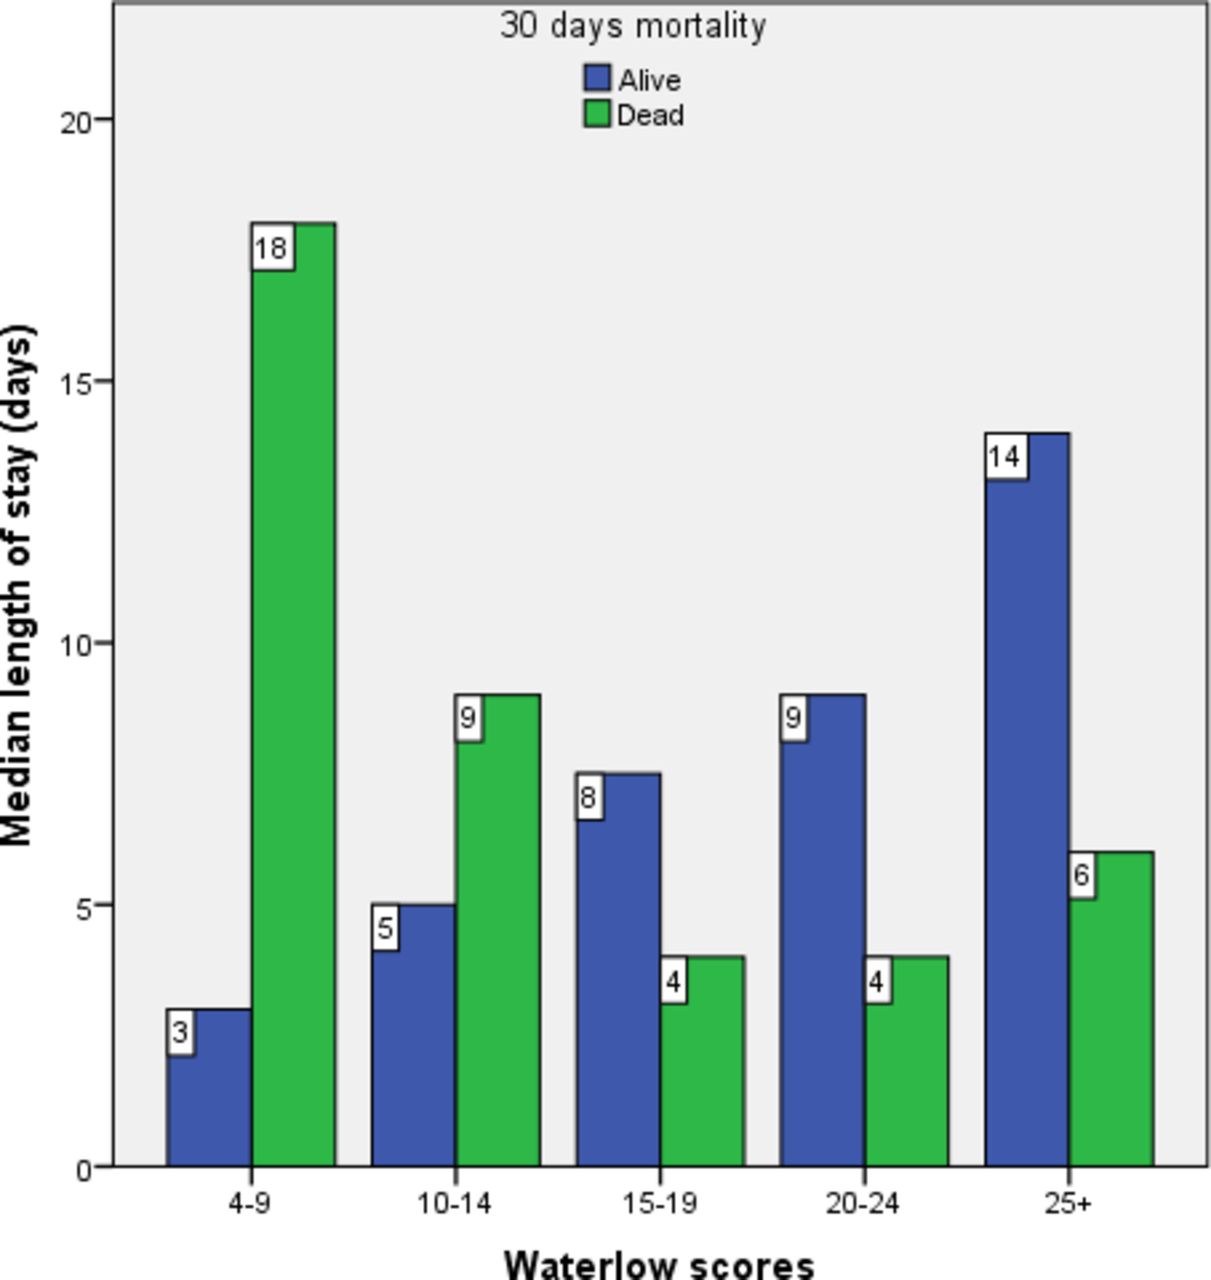
There was a wide variation in the WSs in terms of LHS. To reduce the effect of outliers, median LHS for five index WS categories was used. Figure 3 shows that the length of stay linearly increases with an increase of the WS for those patients who were alive at 30 days (median=5, IQR=10; r=0.32, p<0.01). However, the scenario was opposite for the patients who died within 30 days (median=5, IQR=9; r=−0.20, p=0.04), meaning LHS had a negative relationship with the WS.

Clustered bar chart for median length of stay for all patients within each category of Waterlow score.
LHS was not normally distributed and quadratic regression fitted relatively better with LHS as a dependent variable. Therefore, in table 3 we fitted quadratic regression with WS as a categorical variable (as done in figure 3). As expected, it showed that WS had a significant linear relationship with LHS (because the quadratic term was not significant, p=0.27) for those patients who were alive at 30 days. LHS increases by 4.7 days (5.1–0.41) if WS increases by five units. On the other hand, for the patients who died within 30 days, WS had a significant curvilinear (concave) relationship with LHS (linear term was negative and quadratic term was positive and they were both significant). LHS decreases by approximately 9.8 days (−11.45+1.65), with a five-unit increase in the WS. However, this decrease reduces gradually with the increase of the WS to form a concave shape. This indicates that WS may be used as a predictor of LHS for patients 65 or older.
Results of quadratic regression analyses
Discussion
Prognostic scoring tends to be cumbersome and resource intensive when trying to account for a heterogeneous population with multiple variables. Introduction of new tools also requires additional resources in the form of training and support. The WS was developed in the 1980s as a focus for education, intervention and resource management in the prevention of pressure ulcers.6 11 12 It is widely used in the UK as part of standard nursing practice across all hospital admissions. Thus, an infrastructure is already in place for this assessment, and the results are easily accessible for use as a potential prognostic tool. The high compliance rate in our study (100%) confirms previous findings, as expected in a mandatory assessment.10 We have shown that the WS, a routinely collected tool which is used throughout the UK at the point of hospital admission to assess pressure ulcer risk, is actually a good predictor of both 30-day survival (OR=1.12, AUC=0.69) and LHS.
Our study captured the heterogeneous nature of acute medical admissions, as illustrated by the patient subcategories (see table 1). Despite this heterogeneous cohort, our results demonstrate a statistically significant relationship between the WS and 30-day mortality. This was also confirmed by Sampson.13 Our data confirm that there is a difference in the distribution of WS for those who survived compared with those who died, suggesting a score above 12 (figure 2) to be associated with a higher mortality risk, although further analysis in wider context would be required to confirm this. WS categories have a positive correlation with 30-day mortality categories (see figure 1). The respiratory, stroke, cardiology, non-respiratory infections and trauma subcategories showed a statistically significant difference in the distribution of the WS between those who survived and died. This was not seen in other subcategories, which generally had fewer patients. In acute medical admissions, as seen in our study, respiratory, cardiac and septic patients predominate. A further larger prospective study would be necessary to determine if the WS had additional predictive value in some clinical subcategories compared with others.
With regard to LHS, there is clearly a complex relationship between it and the WS. A high WS is both correlated with increased LHS in those who survive past 30 days, and conversely also correlated with a decreased LHS in those who were deceased at 30 days. Although this information has minimal value retrospectively in managing acute admissions, we can prospectively draw the conclusion that a patient with high admission WS will likely be a more resource intensive admission—either from high mortality risk (where acute deterioration and death can be inferred from the shorter LHS) or a protracted stay. As WS includes an assessment of chronic comorbidities, and the poorer baseline in the high WS scoring patient could account for both of these associations.
There are limitations to the WS itself, which was designed to be a tool to aid clinical risk assessment and is not superior to clinical judgement.14 In its original role in predicting the development of pressure ulcers, the WS is highly sensitive (82.4%) but has a low specificity (27.4%), which was confirmed in subsequent studies.12 15 Despite its widespread use, interobserver variability in score calculation has been confirmed in several studies, relating to the assessor’s clinical experience and training.16–18
The utility of the WS has been explored in various other cohorts. Thorn et al 10 looked at inpatient mortality in a high-risk surgical group, including elective and emergency admissions, and found that a high WS was a predictor of mortality. A positive correlation has been shown between surgical patients with WS above 15 and mortality.19 It also correlated with rates of postoperative infections in a study in patients with fractured neck of femur20 and in predicting outcomes in patients with acute pancreatitis, with an AUC score of 0.73 for mortality.21 Furthermore, it has specifically been found to be an independent predictor of mortality among acute medical patients suffering from dementia.22 Our study population was limited to patients aged 65 years and older and thus cannot be extrapolated to a younger population. However, acute hospital attendances today among the elderly are increasing,23 50% of our patients were aged over 81 years. Further studies would be required to confirm our findings in other acutely admitted patient populations. This study also took place at only one centre, and therefore, more work needs to be done to validate the findings in other hospitals before it can be generalised nationally.
Conclusion
The findings suggest that the admission WS could have further potential use beyond its role as a predictor of risk of pressure ulcer development. This study shows that it could have an additional role as a predictor of 30-day mortality and length of stay in older, acutely admitted medical patients. The findings support further study to test this hypothesis.
Acknowledgments
Anita Holme, senior research nurse, Lister Hospital, East and North Hertfordshire Trust, Corey’s Mill Lane, Stevenage, Hertfordshire SG1 4AB.
References
Footnotes
Contributors All authors provided input in all aspects of the study. There were additional dedicated contributions beyond this as follows: JWW—principle investigator and lead author; design and execution of study, analysis and final write-up. TH and ML—coinvestigators, contributed to design, analysis and final write up. AO, CB and SE—coinvestigators, data collection and analysis. CT, S-JS and PS—statistical analysis and final write-up.
Funding The authors have not declared a specific grant for this research from any funding agency in the public, commercial or not-for-profit sectors.
Competing interests None declared.
Patient consent for publication Not required.
Ethics approval Ethical approval for the study was given by the NRES Committee Yorkshire & The Humber – Bradford Leeds, REC reference: 14/YH/0074.
Provenance and peer review Not commissioned; externally peer reviewed.
Data availability statement De-identified participant data is available in the form of excel database upon request from the lead author for a year following publication for use in collaborative research.