Article Text

Abstract
Objectives To validate case ascertainment algorithms for identifying individuals experiencing homelessness in health administrative databases between 2007 and 2014; and to estimate homelessness prevalence trends in Ontario, Canada, between 2007 and 2016.
Design A population-based retrospective validation study.
Setting Ontario, Canada, from 2007 to 2014 (validation) and 2007 to 2016 (estimation).
Participants Our reference standard was the known housing status of a longitudinal cohort of housed (n=137 200) and homeless or vulnerably housed (n=686) individuals. Two reference standard definitions of homelessness were adopted: the housing episode and the annual housing experience (any homelessness within a calendar year).
Main outcome measures Sensitivity, specificity, positive and negative predictive values and positive likelihood ratios of 30 case ascertainment algorithms for detecting homelessness using up to eight health service databases.
Results Sensitivity estimates ranged from 10.8% to 28.9% (housing episode definition) and 18.5% to 35.6% (annual housing experience definition). Specificities exceeded 99% and positive likelihood ratios were high using both definitions. The most optimal algorithm estimates that 59 974 (95% CI 55 231 to 65 208) Ontarians (0.53% of the adult population) experienced homelessness in 2016, a 67.3% increase from 2007.
Conclusions In Ontario, case ascertainment algorithms for identifying homelessness had low sensitivity but very high specificity and positive likelihood ratio. The use of health administrative databases may offer opportunities to track individuals experiencing homelessness over time and inform efforts to improve housing and health status in this vulnerable population.
- Homelessness
- validation
- health services research
Data availability statement
Data are available upon reasonable request.
This is an open access article distributed in accordance with the Creative Commons Attribution Non Commercial (CC BY-NC 4.0) license, which permits others to distribute, remix, adapt, build upon this work non-commercially, and license their derivative works on different terms, provided the original work is properly cited, appropriate credit is given, any changes made indicated, and the use is non-commercial. See: http://creativecommons.org/licenses/by-nc/4.0/.
Statistics from Altmetric.com
Strengths and limitations of this study
This study validated health administrative codes used in Canadian health databases against a longitudinally collected representative sample of individuals with known housing status.
Health administrative data for certain subgroups without Ontario health coverage (eg, First Nations on reserves, individuals newly arrived to Ontario) were unavailable.
Our general population sample was assumed housed for the entirety of their observation period. It is possible despite our screening efforts that certain individuals experienced homelessness episodes during their participation in this study.
Introduction
Individuals experiencing homelessness commonly face physical and mental health challenges, increased morbidity, mortality and healthcare usage.1 2 However, surveillance of this population has proven challenging,3–8 with most efforts to date primarily focused on enumerating homeless people at a given point in time.8 9 In Canada, the most recent such effort estimates 235 000 individuals, or 0.67% of the population, experienced homelessness in 2016.10 While such ecological measures are of some value for service planning, they have been criticised as inaccurate and unrepresentative. Cross-sectional counts taken at select dates may not reflect the homeless population year-round,3–5 8 are likely to miss certain types of vulnerably housed individuals (for instance, those temporarily or transitionally housed)3–5 8 and are resource and time consuming.11 12 Further, these measures do not permit follow-up over time or the evaluation of targeted strategies,13 14 including Canada’s recently announced National Housing Strategy.15
In the absence of concerted surveillance, nations like Canada that provide government-funded universal healthcare may offer an alternate avenue to measure and track individuals experiencing homelessness. In particular, several administrative databases such as those for hospital services are standardised nationwide, allowing for population-level tracking of health and healthcare delivery of Canadians.16 Health administrative data are already widely used in Canada for population surveillance of health conditions such as diabetes, asthma and ischaemic heart disease,17–21 permitting counts of the population at any point in time as well as tracking changes in group demographics, health status, healthcare trajectories and gaps in care.22–24 Currently, the utility of these data in tracking social determinants of health, such as homelessness, is less well understood. Moreover, although health administrative data provide a convenient and low-cost option for population surveillance, they are prone to errors in misclassification.25 Validation studies are thus necessary to evaluate the accuracy of case ascertainment algorithms.26–28
The aims of this study were to (A) develop and validate case ascertainment algorithms to identify individuals experiencing homelessness in health administrative databases in Ontario, Canada; and (B) estimate annual population prevalence of homelessness in Ontario over a 10-year period using the best performing algorithm.
Methods
Study design and participants
We validated 30 case ascertainment algorithms to detect homelessness using up to eight health administrative databases in Ontario, Canada’s most populous province. All databases were linked using unique encoded identifiers and analysed at ICES (formerly known as the Institute for Clinical Evaluative Sciences),29 a not-for-profit research institute. ICES is a prescribed entity under section 45 of Ontario’s Personal Health Information Protection Act, which authorises ICES to collect personal health information, without consent, for the purpose of analysis or compiling statistical information with respect to the management of, evaluation or monitoring of, the allocation of resources to or planning for all or part of the health system.
Patient and public involvement
Due to the coded nature of ICES data, this research was conducted without patient involvement. Patients were not involved in the development of the research question, invited to comment on the study design, consulted to interpret the results and were not invited to contribute to the writing or editing of this document for readability or accuracy.
Data availability
While data sharing agreements prohibit ICES from making the data set publicly available, access to the data may be granted to those who meet prespecified criteria for confidential access, available at www.ices.on.ca/DAS. The full data set creation plan and underlying analytic code detailing all analysis procedures are available from the authors on request, understanding that computer programs rely on coding templates or macros unique to ICES, which may be either inaccessible or require modification.
Participants
Our validation cohort included adults (18 years or older) eligible for Ontario health coverage who participated in the Health and Housing in Transition study (the ‘HHiT sample’).30 The HHiT study was conducted between 2009 and 2014 in three Canadian cities (Toronto, Ottawa and Vancouver) and aimed to assess the impact of housing transitions on health. Participants were randomly selected at shelters, meal programmes, community health centres, drop-in centres, rooming houses, and single-room occupancy hotels and interviewed once per year until the end of the study or until the individual withdrew. Collected participant data from the two Ontario cities (Toronto and Ottawa) were organised into consecutive self-reported housing episodes, ranging from an earliest date of 31 January 2007 to a latest date of 14 March 2014.
Due to the low prevalence (<5%) of exclusively housed individuals in this cohort, an additional group of adults presumed housed (the ‘general population sample’) was randomly selected from the ICES Registered Persons Database (RPDB), which includes all individuals eligible for Ontario health coverage. A similar approach was used in previous validation studies.31 32 To ensure our general population sample had a high likelihood of being housed, we deemed individuals eligible if they were not part of the HHiT study, resided in Toronto or Ottawa throughout the study period and did not reside in a postal code associated with shelter services. We randomly selected 200 individuals for each HHiT participant to approximate the nearest available Canadian homelessness prevalence estimate.33
Reference standard
The period over which housing status is assessed substantially impacts any analysis of agreement between the reference standard and case ascertainment algorithms. Thus, we a priori selected two reference standard definitions (units of analysis) based on their expected utility: (A) the housing episode and (B) the annual housing experience. Within the HHiT cohort, housing episodes were categorised as housed or homeless based on pre-established criteria.34 Responses about housing status were classified into one of 25 categories, and then resolved into housed, institution and homeless categories. ‘Institution’ episodes (which include situations like hospitalisation or prison) were then resolved into either housed or homeless categories based on the preceding and subsequent housing episodes: episodes flanked by any homelessness were generally also classified as homeless, as the individual was not stably housed either at the time of entry or exit (or both) from the institution. The general population sample was assumed housed for the entirety of their observation period. For the annual housing experience definition, individuals were categorised as homeless if a homeless episode occurred during the calendar year.
Case ascertainment algorithms and data sources
Homeless indicators were identified by searching the ICES data dictionary35 for data elements indicative of housing status (search terms included: ‘homeless’, ‘shelter’, ‘housing’, ‘residence’, ‘transient’) (online supplementary table 1). We assessed housing status indicators present in: the Discharge Abstract Database, the National Ambulatory Care Reporting System, the Ontario Mental Health Reporting System, the Home Care Database, the Resident Assessment Instrument Contact Assessment Database, the National Rehabilitation Reporting System and the Canadian Organ Replacement Registry. The first three sources report hospital encounters and are tracked by the Canadian Institute for Health Information (CIHI)13; for brevity these are hereafter referred to as ‘CIHI databases’.
Supplemental material
Postal codes are also often recorded in the above records; therefore, we additionally assessed postal codes where present and in the ICES PSTLYEAR database (which provides a yearly postal code for individuals with Ontario health coverage) against Toronto and Ottawa-based postal codes identifying shelter services or hospitals (which are sometimes erroneously coded instead of shelters).36 Postal codes which included residential addresses, as determined through a Geographic Information System, were not used to avoid misclassifying housed individuals as homeless.
We tested 30 case ascertainment algorithms (described in online supplementary table 2) which varied by: (1) databases included (all vs CIHI only); (2) inclusion or exclusion of postal code indicators (none, in health service databases or in PSTLYEAR); and (3) extension of time intervals (ranging from 0 to ±180 days) before and after the reference period. The practice of extending time intervals is known to enhance the sensitivity of case ascertainment algorithms.37 38 Reference housing episodes or calendar years without overlapping healthcare encounters were coded as test negative (‘housed’) by default, to reflect the administrative data’s inability to identify homelessness for such reference periods.
Other data sources used to describe the cohort (all data sources are further described in online supplementary table 3) included the ICES RPDB, Ontario Health Insurance Physicians claims database, the Immigration, Refugee and Citizenship Canada Permanent Resident Database and several ICES-derived population surveillance data sets, including: the chronic obstructive pulmonary disease,39 Ontario Diabetes Dataset,40 congestive heart failure41 and Ontario HIV42 derived cohorts.
Statistical analysis
We provided cohort demographics, comorbidities and recent health services usage (variables defined in online supplementary table 4). Sensitivity, specificity, positive predictive value (PPV), negative predictive value and positive likelihood ratio (LR+) were calculated for all algorithms (formulae in online supplementary table 5). 95% CIs were calculated using the Wilson score method.43 For each reference standard, we deemed the algorithm with maximised sensitivity, specificity and PPV to be optimal, while also considering its scalability (ie, applicability of the algorithm outside Ontario).
We then applied the optimal annual housing experience algorithm to identify Ontarians experiencing homelessness in each of the 2007–2016 calendar years, further describing those identified during 2016. Finally, we estimated population prevalence of homelessness between 2007 and 2016, correcting for sensitivity by dividing the number of identified homeless by the algorithm’s sensitivity. Prevalence rates were calculated by dividing estimated population prevalence by the total adult Ontario population for each year. A Poisson regression model was used to estimate the annual change in prevalence over time.
All analyses were conducted using SAS V.9.4.44
Results
Cohort
We identified 686 eligible HHiT participants (6948 housing episodes, 3443 of which were homeless) and randomly selected a further 137 200 individuals from the RPDB (137 200 housing episodes) to generate a total cohort of 137 886 individuals contributing 144 148 housing episodes (figure 1). HHiT participants were followed for, on average, 64 months, and experienced homelessness for, on average, 40.4% of their overall participation period, with a median homeless episode of 75 days (IQR: 29–181 days) (table 1). Individuals in the general population sample were followed for an average of 52 months. We found substantial differences between the HHiT and general population samples, with HHiT participants being younger, more likely male, less likely to have recently immigrated and having more chronic health conditions and recent healthcare use.
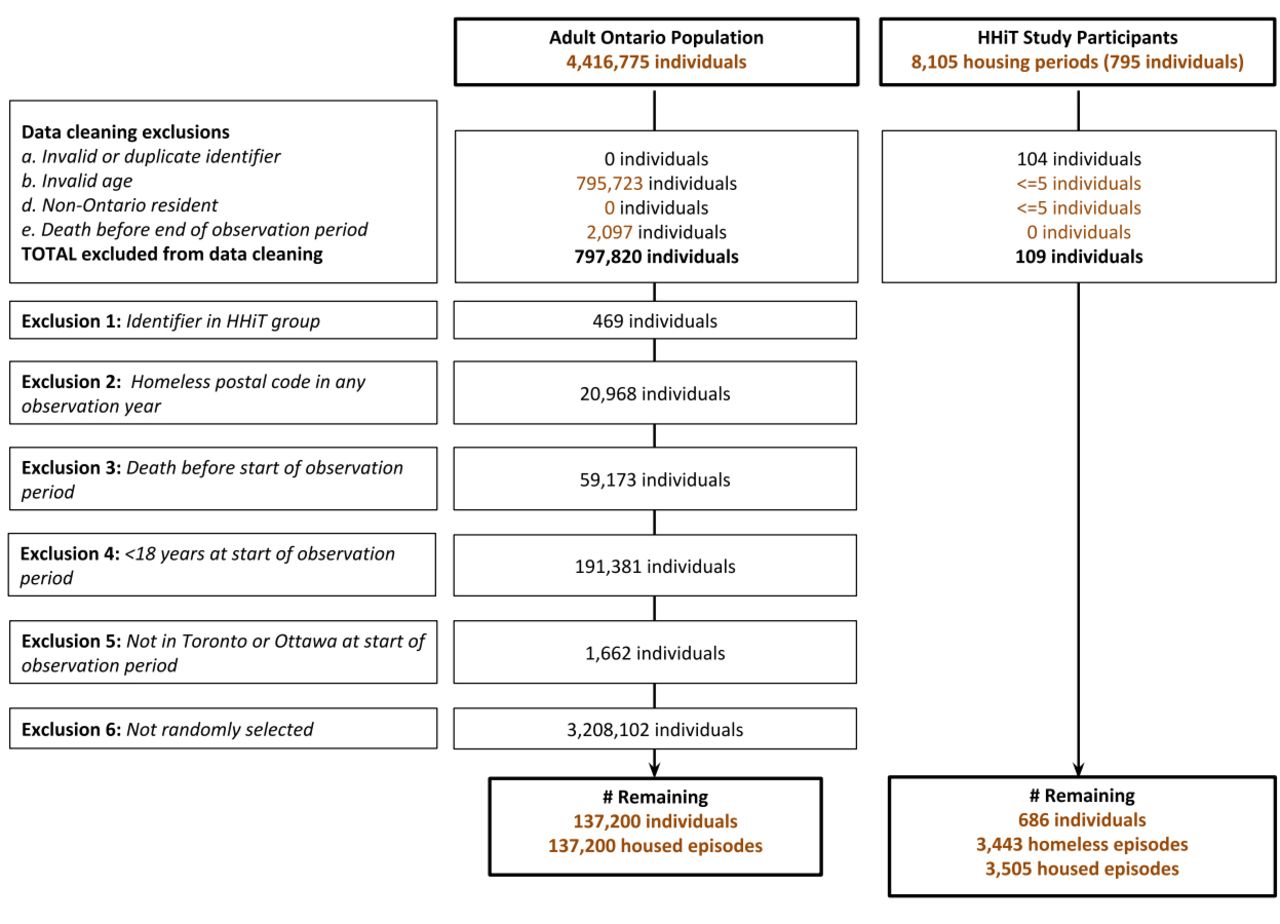
Cohort build. HHiT, Health and Housing in Transition study.
Cohort characteristics at the start of a randomly selected housing episode, by source
Validation results
Algorithm sensitivities when identifying a homeless housing episode (among 144 148 total episodes) ranged from 10.8% to 28.9%, with specificities exceeding 99% (table 2). Extending time intervals or including postal code indicators in health service databases increased sensitivity, while marginally decreasing specificity. The use of all databases, as opposed to only CIHI databases, resulted in negligible gains in sensitivity. LR+ were all in excess of 10, indicating a substantial increase in the likelihood of homelessness following a positive test.45 Based on these findings, we chose any CIHI database indicator +/−45 days as the optimal algorithm based on its scalability and maximised sensitivity, specificity and PPV. More false positives (n=595) using this algorithm came from the HHiT sample (n=397, or 66.7% of false positives) than the general population sample (n=238) (online supplementary table 6A). Absence of a healthcare encounter during the reference period accounted for 64.5% (n=1825) of false negatives.
Accuracy of case ascertainment algorithms in identifying individuals experiencing homelessness
Algorithm sensitivities when identifying homeless annual housing experiences (n=491 213 total calendar years) ranged from 18.5% to 35.6%, with specificities at 99.9% (table 2). LR+ were all in excess of 200, indicating a very substantial increase in the probability of homelessness following a positive test.45 Sensitivity increased without impacting specificity when time windows were extended or when postal code indicators during healthcare encounters or in PSTLYEAR were included. The use of all databases, as opposed to solely CIHI databases, resulted in negligible gains in sensitivity.
The algorithm that maximised validation statistics was any CIHI database indicator +/−15 days or a PSTLYEAR postal code. Most false positives (n=365) using this algorithm were sourced from the general population sample (n=250; 68.5% of false positives overall) (online supplementary table 6B). Absence of a health encounter within the reference period accounted for 62.7% (or 997) of false negatives. However, because this algorithm requires a comprehensive database of postal codes uniquely identifying shelters or hospitals to be scaled, we deemed this algorithm suboptimal and therefore opted to use any CIHI database indicator +/−15 days for generating provincial estimates.
Estimates of homelessness
Applying the optimal annual housing experience algorithm, we identified 11 731 Ontarians experiencing homelessness during 2016 (table 3). Flagged individuals were predominantly male (70%) and between the ages of 25 and 65. One in 10 were recent immigrants, about one-third resided in Metropolitan Toronto, and a large proportion recently received mental or substance use-related healthcare (25.7% for psychotic disorders; 54.8% for non-psychotic disorders and 41.9% for substance use disorders). Over 10 years, we identified a total of 54 873 adults who experienced homelessness, of which 18 217 (33.2%) were detected in more than 1 year (online supplementary table 6C).
Characteristics of individuals identified as homeless in 2016 using the optimal annual housing experience algorithm (any CIHI indicator +/−15 days)
As specificity for our chosen algorithm is near 100%, we corrected for sensitivity by dividing our identified cohort count by sensitivity to estimate a total 2016 homeless population of 59 974 (95% CI 55 231 to 65 208) Ontarians, or 0.53% of the adult Ontario population (figure 2). Between 2007 and 2016, the number and rate of individuals experiencing homelessness increased by 67.3% and 48.1%, respectively, with an annual percentage increase of 4.4% in the estimated rate of homelessness (95% CI 4.2% to 4.7%).

Estimated number of individuals and population prevalence (per 100 adults) experiencing homelessness in Ontario from 2007 to 2016 using the optimal annual housing experience case ascertainment algorithm (any CIHI indicator +/−15 days), with 95% CIs, correcting for sensitivity. Annual percentage change with CI was calculated using a Poisson regression. CIHI, Canadian Institute for Health Information.
Discussion
We validated health administrative database algorithms for homelessness against the known housing status of individuals in a longitudinally collected representative sample at risk for homelessness and a random sample of housed individuals in Ontario, Canada. We tested our algorithms’ ability to identify individuals during an experience of homelessness and during a year in which homelessness occurred, as either definition could be used for different purposes (research and surveillance, respectively). In both cases, algorithms exhibited low sensitivity but excellent specificities and LR+.
The low sensitivity of the algorithms can be partially explained by the large proportion of reference periods without a healthcare encounter, which increased false negatives by default. This reaffirms the consensus that homelessness is ephemeral for many individuals, making it difficult to capture in health administrative data.1 3 5 Although homeless individuals are known to access acute care services at a much higher rate than the general population,1 2 a substantial subgroup in our homeless cohort did not access hospital-based healthcare services during specific housing periods, and therefore could not be identified as such using the algorithms. We observed that homeless individuals more frequently accessed care through outpatient physician clinics, which are captured through fee-for-service billings. This data holding (the Ontario Health Insurance Plan) currently lacks housing status information and therefore could not be included in our validation.
Our population prevalence estimates suggest substantial increases in homelessness between 2007 and 2016, both in absolute and relative terms. Case sensitivity did not noticeably change over time in our validation cohort (less than a 4% variation throughout, with no trend), but we cannot know for certain whether case sensitivity increased across Ontario during this period, partially or fully accounting for the observed increase. However, a recent presentation by Employment and Social Development Canada indicates that, among Canadian communities who conducted point in time counts in 2016 and 2018, homelessness increased by 14%46; the estimates generated by the 2013 and 2016 State of Homelessness in Canada reports indicate similar increases.10 33 These results suggest that our observed increase may reflect a true increase in the prevalence of homelessness in Ontario.
No Ontario-specific statistics exist against which to directly compare our most recent population prevalence estimate47; however, if we assume Canadian homelessness as recently reported10 is proportionally distributed among the 13 Canadian provinces and territories population (Ontario accounted for 38.3% of Canada’s population in 2016),48 approximately 90 000 homeless individuals would be attributable to Ontario in 2016. This prevalence estimate is greater than the 2016 estimate concluded in this study (of approximately 60 000), but individuals identified as homeless in our algorithm share similar demographics with individuals in that report: approximately 25% in both sources are aged 50 and older; 16%–19% are youth; and roughly 30% are women.10 Furthermore, one in three individuals were identified in multiple years, similar to the proportion of individuals using shelters in multiple years reported recently.49 Therefore, the gap between methodologies does not appear to reflect a bias in the types of individuals identified in these two sources.
This is the first study to validate health administrative data algorithms against a reference standard with the intended purpose of population surveillance. Most prior work50–57 identified homelessness using homeless indicators or shelter addresses given during healthcare encounters, assuming these data represented true housing status. Recently, Vickery et al validated addresses indicative of homelessness during healthcare encounters against self-reported housing status in a sample of Medicaid recipients, finding sensitivities between 30% and 76% and specificities between 79% and 97%.58 However, this study required the use of location and time-specific shelter address registries, making the methodology challenging to scale or generalise. Moreover, this study’s results refer to the population using healthcare (rather than the population overall) and assumed self-reported housing status did not vary over the nearly 4-year study period. Our study recognised changes in housing status and deliberately included individuals who may not have used healthcare, in order to estimate the algorithm’s ability to count the complete homeless population.
We readily acknowledge some limitations to this validation. First, because it was conducted in a universal, single-payer healthcare system, this validation’s applicability is limited to jurisdictions with similar settings who collect similar types of standardised information. Even so, before implementation policymakers should undertake a validation similar to that described here to determine how data sources available to them perform. However, among such jurisdictions this methodology can permit inexpensive, population-level research and surveillance.
Second, as this validation relied on health administrative data with housing indicators, algorithm sensitivity was significantly reduced due to the number of individuals who did not access hospital-based healthcare services during their housing period and were thus automatically considered housed. Other jurisdictions having access to housing status variables in standardised health services data and the ability to link non-health administrative data containing housing variables (such as in social services, law enforcement or shelter service data) may realise improved algorithm performance through increased opportunities for encounters during a homeless episode.
Third, we could only validate homelessness among adults eligible for Ontario healthcare coverage, which although near complete (>99%) does not include recent arrivals to Ontario, First Nations on reserves, Inuit, certain refugee claimant groups, inmates in federal penitentiaries, eligible veterans and serving members of the Canadian Forces. Since veterans and First Nations, Metis and Inuit individuals are believed to be over-represented among homeless people,10 33 49 59 our algorithms almost certainly underestimate homelessness in these populations, which (in conjunction with the lack of youth in the count) may account for much of the gap between our population estimate and the estimate loosely calculated from the State of Homelessness in Canada 2016.10 However, this gap is the result of linkage through Ontario-specific identifiers rather than an inherent limitation of the indicators: future pan-Canadian homelessness surveillance and research can include these populations by accessing these indicators through CIHI.
Fourth, we were forced to assume our general population sample was housed during the entirety of their assigned housing period. It is possible, despite our screening efforts, that some individuals experienced homelessness during their participation in this study. On review of the false positives, we identified 238 individuals from the general population sample (0.17% of that sample) who might have thus been misclassified as housed when they were, in fact, homeless. We deemed misclassifying up to a few hundred individuals from a pool of over 140 000 to be preferable to excluding or recoding such individuals on the basis of the same administrative data we are attempting to validate. Moreover, given the low prevalence of homelessness in the population, the impact of such individuals should be negligible to our overall findings.
Despite the recent Canadian federal government commitment of $2.2 billion over 10 years to tackle homelessness,60 current costs associated with enumeration11 12 and programme evaluation are high, necessarily reducing funding for programme implementation. Overall, our algorithms present, despite their low sensitivity, important potential cost-saving opportunities as a homelessness enumeration and surveillance tool. Moreover, these algorithms can track individuals over time and be used to evaluate efforts to improve housing and health status, similar to applications from other previous validation work for population surveillance.20–25 Introduction of mandatory reporting of homelessness among hospital and non-hospital-based healthcare encounters may result in increased identification of homelessness in Ontario.
Data availability statement
Data are available upon reasonable request.
Ethics statements
Patient consent for publication
Ethics approval
This study was approved by the St Michael’s Hospital Research Ethics Board, and follows the STARD guidelines for reporting diagnostic accuracy studies.
Acknowledgments
We gratefully acknowledge the HHiT team for the use of their data, and Emily Kovacs for compiling postal codes identifying shelter services in Toronto and Ottawa.
References
Footnotes
Contributors LR conceived the study, participated in the study coordination, study design, acquisition of data and interpretation of results, performed the analysis and drafted the manuscript. SZS conceived the study, participated in the study design, interpretation of study results and provided feedback on the manuscript. SWH, RN and RB participated in the study design, acquisition of data, and interpretation of study results and provided feedback on the manuscript. CF, KC, MA and KW contributed to the study design, interpretation of study results and provided feedback on the manuscript. All authors read and approved the final manuscript.
Funding This study was supported by an Ontario Trillium Foundation–Local Poverty Reduction Fund grant (held by CF, RB and SZS), an Academic Medical Organization of Southwestern Ontario Academic Health Science Centre Alternate Funding Innovation Fund grant (held by KC and SZS) and two Canadian Institutes of Health Research grants, CIHR MOP-86765 and HOA-80066 (held by SWH and RN). This study was conducted at the ICES Western Site, which receives core funding from the Academic Medical Organization of Southwestern Ontario (AMOSO), the Schulich School of Medicine and Dentistry, Western University, and the Lawson Health Research Institute. ICES is funded by an annual grant from the Ontario Ministry of Health and Long-Term Care. Information in the Immigration, Refugees and Citizenship Canada Permanent Resident Dataset was provided by Immigration, Refugees and Citizenship Canada.
Disclaimer The opinions, results and conclusions reported in this paper are those of the authors and are independent of the funding sources. No endorsement by ICES or the funding agencies is intended or should be inferred. Parts of this material are based on data and/or information compiled and provided by CIHI. However, the analyses, conclusions, opinions and statements expressed in the material are those of the author(s), and not necessarily those of CIHI.
Competing interests KC reports grants from AstraZeneca, and attendance to a Merck conference, occurring outside the submitted work. All other authors have no competing interest to declare.
Provenance and peer review Not commissioned; externally peer reviewed.
Supplemental material This content has been supplied by the author(s). It has not been vetted by BMJ Publishing Group Limited (BMJ) and may not have been peer-reviewed. Any opinions or recommendations discussed are solely those of the author(s) and are not endorsed by BMJ. BMJ disclaims all liability and responsibility arising from any reliance placed on the content. Where the content includes any translated material, BMJ does not warrant the accuracy and reliability of the translations (including but not limited to local regulations, clinical guidelines, terminology, drug names and drug dosages), and is not responsible for any error and/or omissions arising from translation and adaptation or otherwise.