Article Text

Abstract
Objective The patent expiry of a number of biological medicines and the advent of biosimilars raised the expectations of healthcare commissioners that biosimilars would reduce the high cost of these medicines and produce potential savings to the NHS. We aimed to examine the prescribing pattern of different growth hormone preparations (ready to use and reconstitution requiring) in primary and secondary care in England to determine relative rates of decrease or increase and identify the possible factors influencing prescribing following the introduction of biosimilar growth hormone in 2008.
Design Longitudinal observational study.
Setting and data sources Primary care prescribing cost and volume data was derived from the NHS business services authority website, and for secondary care from the DEFINE database, between April 2011 and December 2015.
Outcomes Quarterly prescribing analysis to examine trends and measure the relationship between usage and price.
Results Expenditure and usage of growth hormone in primary care decreased by 17.91% and 7.29%, respectively, whereas expenditure and usage in secondary care increased by 68.41% and 100%, respectively, between April 2011 and December 2015. The usage of reconstitution requiring products significantly declined in primary care (R²=0.9292) and slightly increased in use in secondary care (R²=0.139). In contrast, the usage of ready-to-use products significantly increased in use in primary (R²=0.7526) and secondary care (R²=0.9633), respectively. Weak or no correlation existed between the usage and price of growth hormone preparations in primary and secondary care.
Conclusions The price of growth hormone products was not the key factor influencing the prescribing of the biological medicines. The main driver for specific product selection was the ease of use and the number of steps in dose preparation. Prescribers appear to be taking into account patient preferences rather than cost in their prescribing decisions.
- EPIDEMIOLOGY
- THERAPEUTICS
- HEALTH SERVICES ADMINISTRATION & MANAGEMENT
This is an Open Access article distributed in accordance with the Creative Commons Attribution Non Commercial (CC BY-NC 4.0) license, which permits others to distribute, remix, adapt, build upon this work non-commercially, and license their derivative works on different terms, provided the original work is properly cited and the use is non-commercial. See: http://creativecommons.org/licenses/by-nc/4.0/
Statistics from Altmetric.com
Strengths and limitations of this study
This study includes cost and volume analysis of all available growth hormone preparations in England.
The study analyses longitudinal observational data set reflecting ‘real life’ prescribing in primary and secondary care.
The analysis shows which factors drive prescribing of growth hormone.
Time period for analysis was limited to 5 years.
Segmented regression of interrupted time series analysis of the data was considered but cannot be applied.
Introduction
Biological medicines can be defined as biotechnological products whose active ingredient is developed from living cells by one or more of recombinant DNA, controlled gene expression and antibody production methods.1 These medicines represent an advance in the treatment of patients with chronic and life-threatening diseases such as diabetes, growth hormone deficiency and cancer.2 Biological medicines tend to be expensive compared with conventional drugs, mainly due to the cost of research and development and their complicated biosynthesis and handling techniques.3 For example, remicade (infliximab) costs £12 584 per year per patient for the treatment of Crohn's disease.4 As a consequence, they potentially place a heavy burden on healthcare budgets even in developed countries with high resources.5 In a free at the point of need health system funded through general taxation, such as the UK NHS, there is always pressure to remain within budget and provide value for money for tax payers.6 According to the Health and Social Care Information Centre report in 2015, the expenditure on medicines in England was £15.5 billion with hospital expenditure growing at a higher rate than primary care.7 The Five Year Forward View of the NHS England predicted a budget deficit of nearly £30 billion a year by 2020–2021 if the increasing demand was met by no further annual efficiencies and funding remained flat in real terms.8 NHS Healthcare policymakers' aim to reduce the acquisition cost of the drugs without affecting the clinical outcome by increasing the uptake of less expensive generic alternatives to branded medicines.9
The patent expiry of a number of biological medicines and the establishment of regulatory frameworks by the European Medicines Agency to register similar biological medicines termed ‘biosimilars’ raised the expectations of healthcare commissioners that biosimilars would reduce the high cost of these medicines and produce potential savings to the NHS. The UK is a relatively large market for biological and generic medicines, so represents a potentially attractive market for the biosimilars manufacturers.10 Recent data have revealed that the uptake of biosimilars in the UK is low compared with Germany and Sweden.11 Possible reasons behind this low uptake were healthcare prescribers and patients concerns regarding quality, safety and efficacy of biosimilars and brand loyalty.12
Human recombinant growth hormone is a biological medicine where a biosimilar has been available since 2006.13 An IMS Health report in 2014 showed that the uptake of biosimilar growth hormone varies considerably across the different European markets, with highest use in Poland (99%) and lowest in Norway (3%) and the UK (5%). In Poland, the implementation of a strict tendering procurement system has resulted in the evolution of growth hormone biosimilar market share.11 ,14 In 2015, growth hormone preparations cost £35 742 128 which represent 0.385% of the overall medicine bill in primary care.7
Although the concept of generics and biosimilars is the same, biosimilars cannot be considered generics, since they are similar but not identical to the branded biologics due to the high molecular weight and complexity of biologics and the difference in synthesis process.15 This has been recognised by the European Medicine Agency (EMA) in specific legislation for biosimilars approval.16 The UK Medicines and Healthcare products Regulatory Agency (MHRA) guidance on biosimilars is that products should not be assumed to be identical due to the high molecular weight and structural differences between biological medicines. Thus, biological medicines and biosimilars are prescribed by brand names rather than by their International Non-propriety Name.17 UK policymakers may have anticipated that the lower price of biosimilars compared with branded biological medicines (15–30%) would lead to a rapid uptake in the same way as conventional small molecule generic medicines, even though the price differential is far greater for generic small molecule medicines (50–90%).18 The high unit cost of biological medicines means that the small percentage price differential could result in significant annual savings.19 The extent to which savings on prescribing for conventional small molecule medicines can be realised is a function of multifactorial influences on prescribing in the UK.20–22 It is not clear whether the same influences which apply to generic medicines are universally applicable to biological medicines. Since 2006, the EMA has approved 23 biosimilars in different therapeutic areas, including growth hormone, erythropoietins, granulocyte-colony stimulating factors, monoclonal antibody and insulin. The European experience during this 10 years identified that the uptake and market penetration of potential biosimilar depend on therapeutic area, geographic area and patient acceptance. The uptake and market penetration of biosimilars are also governed by price variations, local market dynamics, competitors, stakeholder knowledge and experience with products and marketing efforts by companies.23
The main objectives of this study were to undertake a detailed analysis of the pattern of use of human recombinant growth hormone in primary and secondary care settings in England and to determine possible factors influencing its prescribing. A priori hypothesis was set, that, similar to generic medicines, price would be the dominant influencing factor in the use of these medicines.
Methods
Data source
The study was a retrospective analysis of primary and secondary care usage of growth hormone in England. Primary care monthly prescription cost analysis data were derived from the NHS business services authority website,24 for prescriptions dispensed in primary care in England from April 2011 to December 2015. Monthly secondary care data were taken from DEFINE Software for 2011–2016 since this prescribing database did not exist before April 2011. DEFINE Software is a NHS prescribing database of medicines usage in ∼120 hospitals (covering over 90% of NHS hospitals throughout the UK including Specialist Centres and Mental Health Trusts) who subscribe to the software package.25 Data were at gross national level not at institutional or patient level. The volume comparator was the defined daily dose (DDD), defined by the WHO as the mean maintenance daily dose of a medicine for its principal indication in adults. The DDD index for growth hormone is 2 international units.26 Primary care data were the number of items issued and amount of drug in units. This was converted into DDDs using the following formula:
Secondary care data were already available in DDDs.
Prices of the individual preparations were expressed as price per DDD (£/DDD). Primary care prices were the basic price of a drug excluding value-added tax (VAT) (the price listed in the national Drug Tariff or in standard price lists). Secondary care prices were the average net prices for different trusts throughout the UK, including VAT.
Statistical analysis
Regression analyses were used to understand and explore the association (relation) between the independent variables and the dependent variable, and the forms of these relationships.27 ,28
Prescribing trends were examined for growth hormone in primary and secondary care over the period April 2011–December 2015. Linear regression analyses were used with a quarter (3 months) as the independent variable and prescription DDD as the dependent variable, using quarterly data from each in primary and secondary care. The regression coefficient values were divided by the baseline prescription DDD (in April 2011) to calculate the average quarterly percentage increase or decrease in prescribing of growth hormone. Correlation analyses were used between prescription DDD and price/DDD, using quarterly data from each in primary and secondary care. All calculations were performed using Microsoft Excel 2013 and SPSS V.21.
Results
Pricing and expenditure
In primary care, prices of branded growth hormone preparations did not change between April 2011 and December 2015 with the exception of Genotropin preparations which decreased by 25%. Biosimilar growth hormone (Omnitrope preparations) prices decreased by 15% over this period (table 1). Over the same time period, there were higher price reductions in secondary care, including all Genotropin preparations, Humatrope Cart, Norditropin SimpleXx, Omnitrope SurePal and Zomacton Inj (table 1).
Change in price/DDD (in GB pounds) of growth hormone in primary and secondary care between April 2011 and December 2015
Expenditure on growth hormone preparations in primary care in England decreased by 17.91% between April 2011 and December 2015, whereas expenditure in secondary care increased by 68.41% during the same period.
Volume of usage
Growth hormone usage in primary care declined from 764 877 DDDs in the second quarter 2011 to 709 054 DDDs in the fourth quarter 2015. Regression analysis indicates that this decline of on average 0.45% per quarter (95% CI 0.70% to 0.21%) is statistically significant. Genotropin Cart, Norditropin SimpleXx and Saizen Click.easy dominated the growth hormone market by volume, accounting for 30%, 24% and 17.5%, respectively, of prescribed growth hormone in the second quarter 2011 (figure 1). By the fourth quarter 2015, Genotropin Cart, Norditropin SimpleXx still had the highest share of the growth hormone market at 22% for both, but Saizen Cart had replaced Saizen Click.easy at 14.5% (figure 1).

Quarterly usage of growth hormone preparations in primary care between April 2011 and December 2015. DDD, defined daily dose.
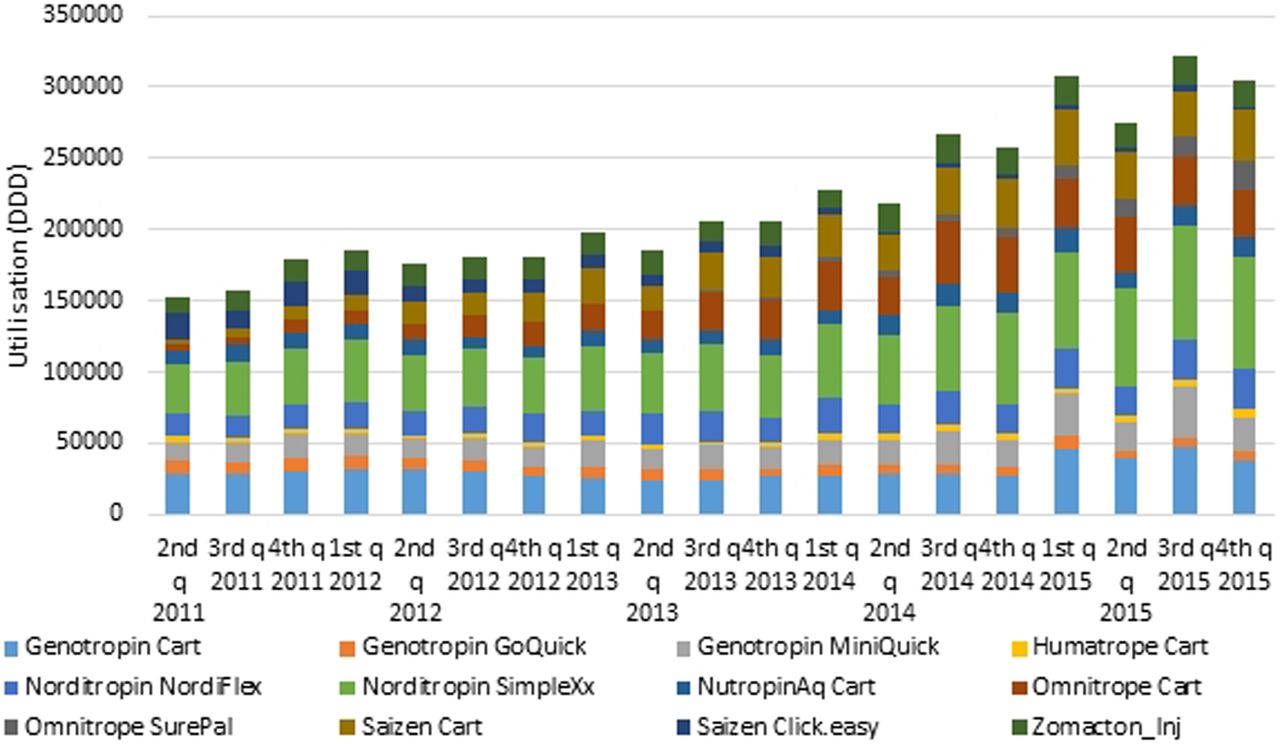
In contrast to primary care, secondary care usage of growth hormone doubled from 152 457 DDDs in the second quarter 2011 to 304 443 DDDs in the fourth quarter 2015 representing a statistically significant rise of on average 5.8% (95% CI 4.71% to 6.89%) per quarter. As in primary care, Genotropin Cart and Norditropin SimpleXx dominated the growth hormone market by volume, accounting for 18% and 23%, respectively, of prescribed growth hormone in the second quarter 2011. By the fourth quarter 2015, Genotropin Cart had decreased to 12%, Norditropin SimpleXx increased slightly to 25%, but Omnitrope Cart and Saizen Cart also accounted for 11% and 12% of the market, respectively (figure 2).

Quarterly usage of growth hormone preparations in secondary care between April 2011 and December 2015. DDD, defined daily dose.
The correlation analysis between price per DDD and product usage in primary care revealed that for Norditropin NordiFlex, Saizen Cart and Saizen Click.easy, there was no correlation. For Genotropin Cart, there was an intermediate positive correlation (R²=0.5023), and for Genotropin MiniQuick, Humatrope Cart, Norditropin SimpleXx and Zomacton Inj, there were weakly positive correlation (R²=0.1081, 0.075, 0.2313 and 0.0006, respectively). For remaining products, there were weakly negative correlations (NutropinAq Cart R²=0.2066, Omnitrope Cart R²=0.0764, Omnitrope SurePal R²=0.3614), with the exception of Genotropin GoQuick, there was an intermediate negative correlation.
In secondary care, a similar diverse pattern of correlation between price/DDD and product usage was seen. Norditropin NordiFlex and Omnitrope Cart showed no correlation. For Genotropin GoQuick, NutropinAq Cart and Saizen Cart, there were weakly positive correlation (R²=0.2535, 0.0873, 0.0004, respectively). For remaining products, there were weakly negative correlations (Genotropin Cart R²=0.0128, Genotropin MiniQuick R²=0.1622, Humatrope Cart R²=0.0155, Omnitrope SurePal R²=0.4973 and Zomacton Inj R²=0.3766), with the exception of Norditropin SimpleXx, there was an intermediate negative correlation.
Table 2 summarises the main characteristics of reconstitution requiring agents and ready-to-use growth hormone preparations. Figure 3 shows the usage trends for products requiring reconstitution and those in a ready-to-use formulation in primary and secondary care settings. The usage of products requiring reconstitution (Genotropin Cart, Genotropin GoQuick, Genotropin MiniQuick, Humatrope Cart, Saizen Click.easy and Zomacton Inj) all showed a clear decline in use in primary care (R²=0.9292) and a slight increase in use in secondary care (R²=0.139). In stark contrast, the usage of ready-to-use products (Norditropin NordiFlex, Norditropin SimpleXx, NutropinAq Cart, Omnitrope Cart, Omnitrope SurePal and Saizen Cart) showed a very clear increase in use in primary and secondary care (R²=0.7526) and (R²=0.9633), respectively.
Growth hormone preparations characteristics

Comparison between reconstitution requiring agents and ready-to-use agents in primary and secondary care between April 2011 and December 2015. DDD, defined daily dose.
Figure 4 shows that in primary care, the usage of five out of six ready-to-use agents increased between 2011 and 2015 irrespective to the price. The usage of four of six of reconstitution requiring agents decreased during the same period, although their prices have decreased. Figure 5 shows that in secondary care that the usage of all ready-to-use agents increased between 2011 and 2015 irrespective of price. The usage of three out of six reconstitution requiring agents increased during the same period when their prices decreased. The usage of remaining three reconstitution requiring agents decreased, despite price reduction.

Usage versus price/DDD of reconstitution requiring agents and ready-to-use agents of growth hormone preparations in primary care. DDD, defined daily dose.

Usage versus price/DDD of reconstitution requiring agents and ready-to-use agents of growth hormone preparations in secondary care. DDD, defined daily dose.
Discussion
The long established principles of good prescribing practice and medicines optimisation suggest that clinicians aim to prescribe to maximise effectiveness, minimise risks and take into account the patients experience.29 At the same time, in a health system free at the point of need funded by general taxation, prescribers consider relative costs of medicines and NHS policy and NICE guidance while still respecting the patient's choice.30 ,31 Balancing between these conflicting aims and recommendations result in good prescribing to achieve maximum effectiveness, minimum risk and cost, although it is recognised that financial and non-financial incentives may also be needed to encourage best practice.32
In the UK, growth hormone prescribing follows a shared care protocol between primary and secondary care. In hospital, a consultant endocrinologist first diagnoses the patient requiring growth hormone. An endocrine specialist nurse demonstrates the available growth hormone devices to the patient, then trains the patient on the use of their chosen device. The patient is then provided with an initial supply. The primary care general practitioner (GP) continues prescribing growth hormone for the patient in accordance with the local agreed shared care protocol.33
In England, there are currently seven preparations of growth hormone. Although these preparations differ in their injecting device for the delivery of growth hormone, these preparations are equal in terms of clinical effectiveness.34 With the availability of such a variety of preparations, endocrinologists and other healthcare professionals prescribing growth hormone are being asked to make some complex decisions regarding the selection of the preparation for each patient. The latest NICE guidelines in 2010 for treatment with growth hormone stated that the product selection should be based on a discussion between the prescriber and the patient or the patients' parents, taking into account the advantages and disadvantages of each device. If more than one option is suitable, the less expensive one should be chosen.34
In this study, we classified growth hormone delivery devices into reconstitution requiring agents and ready-to-use agents. Ready-to-use agents were characterised by fewer steps and time required for dose preparation by patients and potentially a reduction in user errors that may occur during the reconstitution process. Reconstitution can be quite complex since each preparation requires a special reconstitution kit. The cartridge containing lyophilised growth hormone is reconstituted using only the diluent syringe that accompanies the cartridge. The diluent syringe is placed into the reconstitution kit, the needle cover of the diluent syringe is removed and the cartridge inserted. When the diluent needle is inserted inside the cartridge, the plunger of the diluent is pushed until all the diluent is transferred into the cartridge. The cartridge is then removed from the kit, with gentle rotary movement (mixing) but not shaking until the solution became clear.35
Studies have identified that premixed solution devices (ready-to-use devices) are more acceptable to patients and/or parents than reconstitution requiring devices. The simplicity and the least steps required for preparation and administration of growth hormone doses are considered among the most desirable attributes of administration devices.36 ,37 Ready-to-use agents are associated with less pain than reconstitution requiring agents due to the higher concentration of these products and, therefore, smaller volumes of growth hormone injected. Furthermore, added preservative and buffer to the premixed solution of growth hormone decrease the injection pain.38
Interestingly, the usage of the growth hormone market leader in primary care Genotropin Cart decreased over the study period, despite a 25% price reduction (figure 1). Over the same time period, Saizen Cart (ready-to-use agent) replaced Saizen Click.easy (reconstitution requiring agent), although it was the same price (figure 1). This challenges policy assumptions that cheaper drugs will dominate. It also shows that perceived preference may outweigh national guidance to select lowest cost agents. The results have implications for those considering effectiveness of implementation of national guidance. Furthermore, the results have implications for NHS budget mangers when they consider which medicines to make available within local health economies.
The pattern of product usage in secondary care was more diverse (figure 2). In this sector, Genotropin Cart usage decreased, despite a 27.75% price reduction over the study period (figure 2). The market leader in secondary care, Norditropin SimpleXx (ready-to-use agent), grew only slightly, despite a 14.5% price reduction. Omnitrope Cart (the less expensive option) and Siazen Cart (the most expensive option) (the ready-to-use agents) increased their share of the secondary care market, although in both cases, the price did not change. These findings suggest ease of use rather than price is the key influence on the prescribing decision. Within the NHS in the UK, medicines are reimbursed differently in primary and secondary care. In primary care, community pharmacies are reimbursed by the government for the medicines they dispense at a basic NHS price which is set nationally, whereas in hospitals, the prices paid for medicines are negotiated with manufacturers through regional and local contracting processes. These discounts are sometimes offset since hospital medicines attract VAT, whereas primary care medicines do not. This means that the price of medicines is often different in secondary care.
The analysis of price and product usage supports this observation. A number of products in primary and secondary care showed no correlation between price and production usage. Indeed, some showed a positive correlation indicating that the higher price was associated with higher use. A negative correlation would suggest that price was influencing use. However, in primary and secondary care, all the negative correlations were weak R2<0.5, with the exception of Genotropin GoQuick in primary care and Norditropin SimpleXx in secondary care which were intermediate R2>0.5<0.75. This complete diversity of correlations in both sectors indicates price is not the driver for product use.
The use of ready-to-use agents increased in both sectors during the study period (figure 3). This explains the slight overall decrease in growth hormone in primary care as it comprises a growth in the use of the ready-to-use agents counteracted by a significant decrease in the use of the reconstitution requiring agents. Furthermore, the overall growth in secondary care comprises a significant (almost tripling) growth in the ready-to-use agents and a flattening use of the reconstitution requiring agents (figure 3). Figure 3 also shows that reconstitution requiring agents dominated until 2014, but were overtaken by ready-to-use agents. This is perhaps a reflection of the more conservative rate of change of prescribing patterns in the UK, since the reconstitution requiring agents were available since 1987,39 whereas the first ready-to-use agents only became available in the UK in 2000 and the newer devices from 2011 (Norditropin Nordiflex and Saizen Cart were launched in 2011 and Omnitrope Surepal was launched in 2013).40 ,41 This is supported in the literature, which has identified the UK market as one of the slowest markets in Europe in taking up new medicines.42 Furthermore, stable patients will most likely have remained on the product they were initiated on since if all is well, patients and prescribers may be disinclined to switch. Thus, given the nature of this therapy, it takes time for new products to get market traction.
Figures 4 and 5 also suggest that the quantity or the usage of growth hormone preparations is not price dependent in primary and secondary care settings. The usage of ready-to-use agents increased in both sector irrespective to the change in price (decreased or unchanged).
This suggests that the ease of use rather than price is the key driver for growth hormone product selection in primary and secondary care. The findings from this study agree with previous studies of branded growth hormone that outlined that the ease of use and convenience (premixed formulations) were the most important product characteristics from patients' perspective.37 ,43 ,44 This may have been because the patients are adolescents who will be in full-time education and require formulations which are quick and easy to use.
Previous literature on this subject has focused on patient preferences in relation to specific devices. This study focused on whether these preferences are translated into prescriber product selection. Implicitly, this suggests that for growth hormone, prescribers, while following the principles of medicines optimisation take more account of patient preferences than central guidance on cost efficiency. This contrasts with other health economies were mandated switching to growth hormone biosimilar meant that 99% of prescribing was the less expensive biosimilar.14
Our study has several limitations; first, the time period for analysis was limited to 5 years as we wanted to explore the usage of growth hormone in primary and secondary care. We could only access monthly data for primary and secondary care since 2011. Second, segmented regression of interrupted time series analysis of the data was considered, but growth hormone prices change were not linked to a single point of time and NICE guidance on growth hormone was not changed during the study period. Visual analyses of figures 1 and 2 showed no abrupt change in the pattern of the usage of growth hormone over the study period required for this type of analysis.
Conclusion
This study has suggests that the price of growth hormone products is not the key influencing factor in the prescribing of biological medicines. The main driver for specific product selection is the ease of use and fewer steps in dose preparation. Prescribers are clearly taking into account patient preferences rather than cost in their prescribing decisions, in line with national guidance.
References
Footnotes
Contributors All authors have contributed to this study and all authors reviewed and approved the final version of the manuscript. SRC designed the study, interpreted the results and reviewed the manuscript and corrected the final version of the manuscript. RWF participated in the study design, interpreted the results and reviewed the manuscript and corrected the final version of the manuscript. MIA participated in the study design, data collection and interpretation of results, prepared the manuscript draft and performed all analytical testing and manuscript review.
Funding This research received no specific grant from any funding agency in the public, commercial or not-for-profit sectors.
Competing interests None declared.
Provenance and peer review Not commissioned; externally peer reviewed.
Data sharing statement No additional data are available.