Article Text

Abstract
Objective To determine the association between subjective social status (SSS), or the individual's perception of his or her position in the social hierarchy, and the odds of coronary artery disease (CAD), hypertension, diabetes, obesity and dyslipidaemia.
Study Design Systematic review and meta-analysis.
Methods We searched PubMed, MEDLINE, EMBASE, CINAHL, PsycINFO, SocINDEX, Web of Science and reference lists of all included studies up to October 2014, with a verification search in July 2015. Inclusion criteria were original studies in adults that reported odds, risk or hazard ratios of at least one outcome of interest (CAD, hypertension, diabetes, obesity or dyslipidaemia), comparing ‘lower’ versus ‘higher’ SSS groups, where SSS is measured on a self-anchoring ladder. ORs were pooled using a random-effects model.
Results 10 studies were included in the systematic review; 9 of these were included in the meta-analysis. In analyses unadjusted for objective socioeconomic status (SES) measures such as income, education or occupation, the pooled OR comparing the bottom versus the top of the SSS ladder was 1.82 (95% CI 1.10 to 2.99) for CAD, 1.88 (95% CI 1.27 to 2.79) for hypertension, 1.90 (95% CI 1.25 to 2.87) for diabetes, 3.68 (95% CI 2.03 to 6.64) for dyslipidaemia and 1.57 (95% CI 0.95 to 2.59) for obesity. These associations were attenuated when adjusting for objective SES measures, with the only statistically significant association remaining for dyslipidaemia (OR 2.10, 95% CI 1.09 to 4.06), though all ORs remained greater than 1.
Conclusions Lower SSS is associated with significantly increased odds of CAD, hypertension, diabetes and dyslipidaemia, with a trend towards increased odds of obesity. These trends are consistently present, though the effects attenuated when adjusting for SES, suggesting that perception of one's own status on a social hierarchy has health effects above and beyond one's actual income, occupation and education.
- PUBLIC HEALTH
- SOCIAL MEDICINE
- CARDIOLOGY
- INTERNAL MEDICINE
- EPIDEMIOLOGY
This is an Open Access article distributed in accordance with the Creative Commons Attribution Non Commercial (CC BY-NC 4.0) license, which permits others to distribute, remix, adapt, build upon this work non-commercially, and license their derivative works on different terms, provided the original work is properly cited and the use is non-commercial. See: http://creativecommons.org/licenses/by-nc/4.0/
Statistics from Altmetric.com
Strengths and limitations of this study
To the best of our knowledge, this is the first systematic review and meta-analysis examining the association between subjective social status and cardiovascular risk.
By calculating a single-effect measure comparing the bottom with the top of the subjective social status ladder for each outcome in each study, the pooling of results across studies was made possible.
Visual inspection of funnel plots and the use of Begg's test, and the trim and fill procedure demonstrated low risk of publication bias.
Stratified meta-analysis and meta-regression revealed that between-study heterogeneity is, at least in part, explained by ethnicity of study participants and study quality.
Although there were clear strengths in the quality of included studies, areas of weaker quality included study samples that were insufficiently representative of the population and variable adequacy of adjustment of confounders.
Introduction
Objective measures of socioeconomic status (SES) have long been linked with health outcomes, with those having lower income, lower education or working in lower status occupations experiencing increased mortality and prevalence of coronary artery disease.1 Class differences in health appear not just at the extremes when comparing the ‘rich’ with the ‘poor’, but even among those with relatively high status. For example, British civil servants at the highest administrator level had lower risk of angina and cardiac ischaemia compared with those at the professional/executive level in the Whitehall II cohort study.2 The effect of SES on health, therefore, appears to stem from beyond disparities in resources and opportunities to include psychosocial contributions arising from relative and perceived differences in social position.
Subjective social status (SSS) is an individual's perception of his or her own position in the social and socioeconomic hierarchy.3 Although SSS can be measured in different ways, such as individuals self-identifying as low, middle, or upper class,4 ,5 or through a single question about how their income compares with others with a Likert scale of responses,6–8 the most common and standardised method of measurement of SSS is through the MacArthur Scale of Subjective Social Status.9 This tool asks individuals to rank themselves on a ladder representing the social hierarchy, using either the society/country (see online supplementary appendix 1, panel A) or their community (see online supplementary appendix 1, panel B) as the reference group. Increasing evidence suggests that low SSS may have adverse effects on health due to internalisation of perceptions of inferiority resulting in activation of stress-related neuroendocrine mechanisms,10–12 and increased tendency to participate in behaviours that may negatively influence health.13 ,14 Whether this translates clinically to increased risk of coronary artery disease (CAD) remains less clear, with variable results across studies. There is, therefore, a need for the synthesis of evidence of the effect of SSS on cardiovascular health, given uncertain clinical relevance despite consistent demonstration of biological plausibility.
Supplementary appendix 1
We conducted a systematic review with the objective of determining the association between SSS and the odds of CAD, hypertension, diabetes mellitus, obesity and dyslipidaemia in adults. We hypothesised that lower SSS would be associated with increased odds of each of the five outcomes.
Methods
Data sources and searches
A systematic review and meta-analysis were performed and reported in compliance with the Meta-analysis of Observational Studies in Epidemiology guidelines,15 and followed a protocol created by study investigators. We searched the following databases up to October 2014: PubMed (1966–present), MEDLINE (1950–present), EMBASE (1980–present), CINAHL (1982–present), SocINDEX (1895–present), PsycINFO (1803–present), and additionally, Web of Science (1990–present), to include relevant conference proceedings and dissertations. Reference lists of included studies were manually searched. No limits on language were placed. Though there was a plan to contact authors if data were missing or insufficient, this was not needed, as data were found to be comprehensive.
Two investigators (KLT and RR) undertook the search strategy with the help of a research librarian. The search strategy comprised two search themes (see online supplementary appendix 2). The first theme, ‘perception’, combined exploded subject headings ‘Social perception’ or ‘Self-Concept’ with the key words ‘subjective* or perceiv* or perception* or belief*’. The second theme, ‘social status’ combined the exploded subject heading ‘Social Class’ and key words including ‘social status* or social position* or social standing* or social class* or social rank*’. Finally, the two search themes were combined using the Boolean operator ‘and’. We limited the search to the adult population (aged 18 years and over).
Supplementary appendix 2
Study selection
Two investigators (KLT and RR) independently reviewed all titles and abstracts identified by the search strategy for eligibility. All abstracts reporting on the relationship between SSS and CAD, hypertension, diabetes mellitus, obesity or dyslipidaemia in adults were selected for full-text review. Non-English studies (n=4) were translated with the assistance of interpreters and web-based translation programmes.
Full-text review was performed independently by the same investigators to select articles for inclusion in the systematic review based on the following criteria; studies must (1) be in adults aged 18 years and over; (2) compare the odds, risk or hazard of at least one of the outcomes of interest in a lower SSS group compared with a higher SSS group and (3) measure SSS using a ‘self-anchoring’ ladder scale, where the top and bottom of the ladder are defined by the study subject.16 We limited studies only to those with observational designs (cohort, case-control and cross-sectional), and excluded reviews, case studies or series, ecological studies, and qualitative studies. Studies were included into the systematic review if they met the above inclusion criteria, regardless of whether the reference group for the SSS ladder was the community or the country/society. However, because these two ladders represent distinct concepts with the societal SSS ladder being the more robust and more widely studied measure, meta-analysis was performed only for those studies where an effect estimate for the societal SSS ladder was reported. The inter-rater agreement for inclusion of studies after full-text review was excellent (κ=1.0).
Data extraction and study quality assessment
The primary exposure variable was ‘lower’ SSS compared with ‘higher’ SSS. The outcomes of interest were ORs of CAD, hypertension, diabetes, dyslipidaemia and obesity. The outcome of CAD included ischaemic heart disease, angina, myocardial infarction and cardiac ischaemia. Studies that reported only quantitative differences in blood pressure, body mass index or lipid levels without a diagnosis of hypertension, obesity or dyslipidaemia, respectively, were not considered.
One investigator (KLT) extracted data from all included studies, with data extraction performed in duplicate for a random 20% of studies by a second investigator (RR). Data extracted included exposure and outcome variables, study design, setting, methods (including exclusion rates and sample size) and participant demographics. Both investigators independently assessed study quality for all studies using the following dimensions: well-defined and representative sample, objective outcome measures, blinding of outcome assessors, adequate follow-up, adequate consideration of potential confounding variables, and appropriate statistical analysis. Disagreements were resolved by consensus.
Data analysis
All included studies reported ORs with the exception of one reporting hazard ratios (HRs).17 Conversion from HR to OR was performed using the formula18: OR=(RR(1–P0))/(1–RR×P0), where HR was approximated to be the relative risk (RR), and P0 was the prevalence of the outcome in the reference group. Outcome categories (CAD, hypertension, diabetes, obesity and dyslipidaemia) were not pooled in the systematic review, as they were not pooled in the individual studies.
Because a majority of studies presented stratified ORs without an overall summary measure,17 ,19–24 and because studies used different comparison groups (with some reporting ORs between the bottom vs the top of the SSS ladder,19 ,22 others reporting ORs per 1,20 ,25 ,26 1.627 or 223 ,24 rung increases in SSS, and still others, per quartile change in SSS17 ,21) we calculated a single weighted-effect estimate comparing the bottom (lowest rung) with the top (highest rung) of the SSS ladder to facilitate comparisons across studies. This was achieved through the following steps: (1) if both community and societal ladders were used to measure SSS, only ORs for societal ladders were considered; (2) if multiple effect estimates for a single outcome were reported in a single study, the OR using the broadest level of comparison was used; (3) reciprocals of all ORs that used lower SSS as the reference group were taken, so that higher SSS became the reference group; (4) all ORs were converted to logs (ORs); (5) each stratified log (OR) was multiplied by the proportion of the sample in that stratum, then summed across strata, resulting in one weighted log (OR) per outcome per study; (6) weighted logs (ORs) were calculated comparing the bottom rung with the top rung of the SSS ladder, then converted back to ORs. Linearity in the relationship between logs (ORs) of outcomes and SSS was assumed.
Meta-analysis was performed separately for each of the outcomes using Stata V.13 (StataCorp, Texas, USA). Separate meta-analyses were performed for effect measures that were unadjusted and adjusted for objective SES measures (income, education and occupation). Both SES-unadjusted and SES-adjusted ORs still adjusted for non-SES measures such as age, marital status and physical activity. Of note, one study reporting only SES-adjusted effect measures was included in SES-unadjusted and SES-adjusted meta-analyses.26 DerSimonian and Laird random effects models were used to pool ORs across studies, and forest plots were generated. Heterogeneity of effect estimates was assessed using Cochran's Q test and the I2 statistic. We performed stratified analyses and meta-regression on the preselected variables of ethnicity, sex and dimensions of study quality including outcome measure objectivity, adjustment for confounding and selection bias. This was performed for the SES-unadjusted outcome measures of hypertension, diabetes and obesity only, due to insufficient numbers of studies reporting CAD and dyslipidaemia outcomes.
Publication bias was assessed using Begg's test, and by visually examining funnel plots for each outcome. For any outcomes where funnel plot asymmetry suggested publication bias, sensitivity analysis was performed through the trim and fill procedure.28
Results
Identification of studies
The initial search strategy identified 7842 citations, of which 45 were included in full-text review (figure 1). Of these, 35 were excluded (17 did not include an outcome of interest, 9 measured social status but not using a self-anchoring ladder, 3 had no measure of SSS, 3 had no comparator, 2 consisted of an adolescent-only population and 1 was not an original study). In total, 10 studies were included in the systematic review.17 ,19–27 Of these, 9 studies were included in the meta-analysis, excluding the single dissertation25 that evaluated SSS on a community ladder only. A manual review of reference lists identified no additional studies. A verification search performed in July 2015 using the related articles function in PubMed for all included studies did not reveal any additional studies for inclusion into the systematic review.
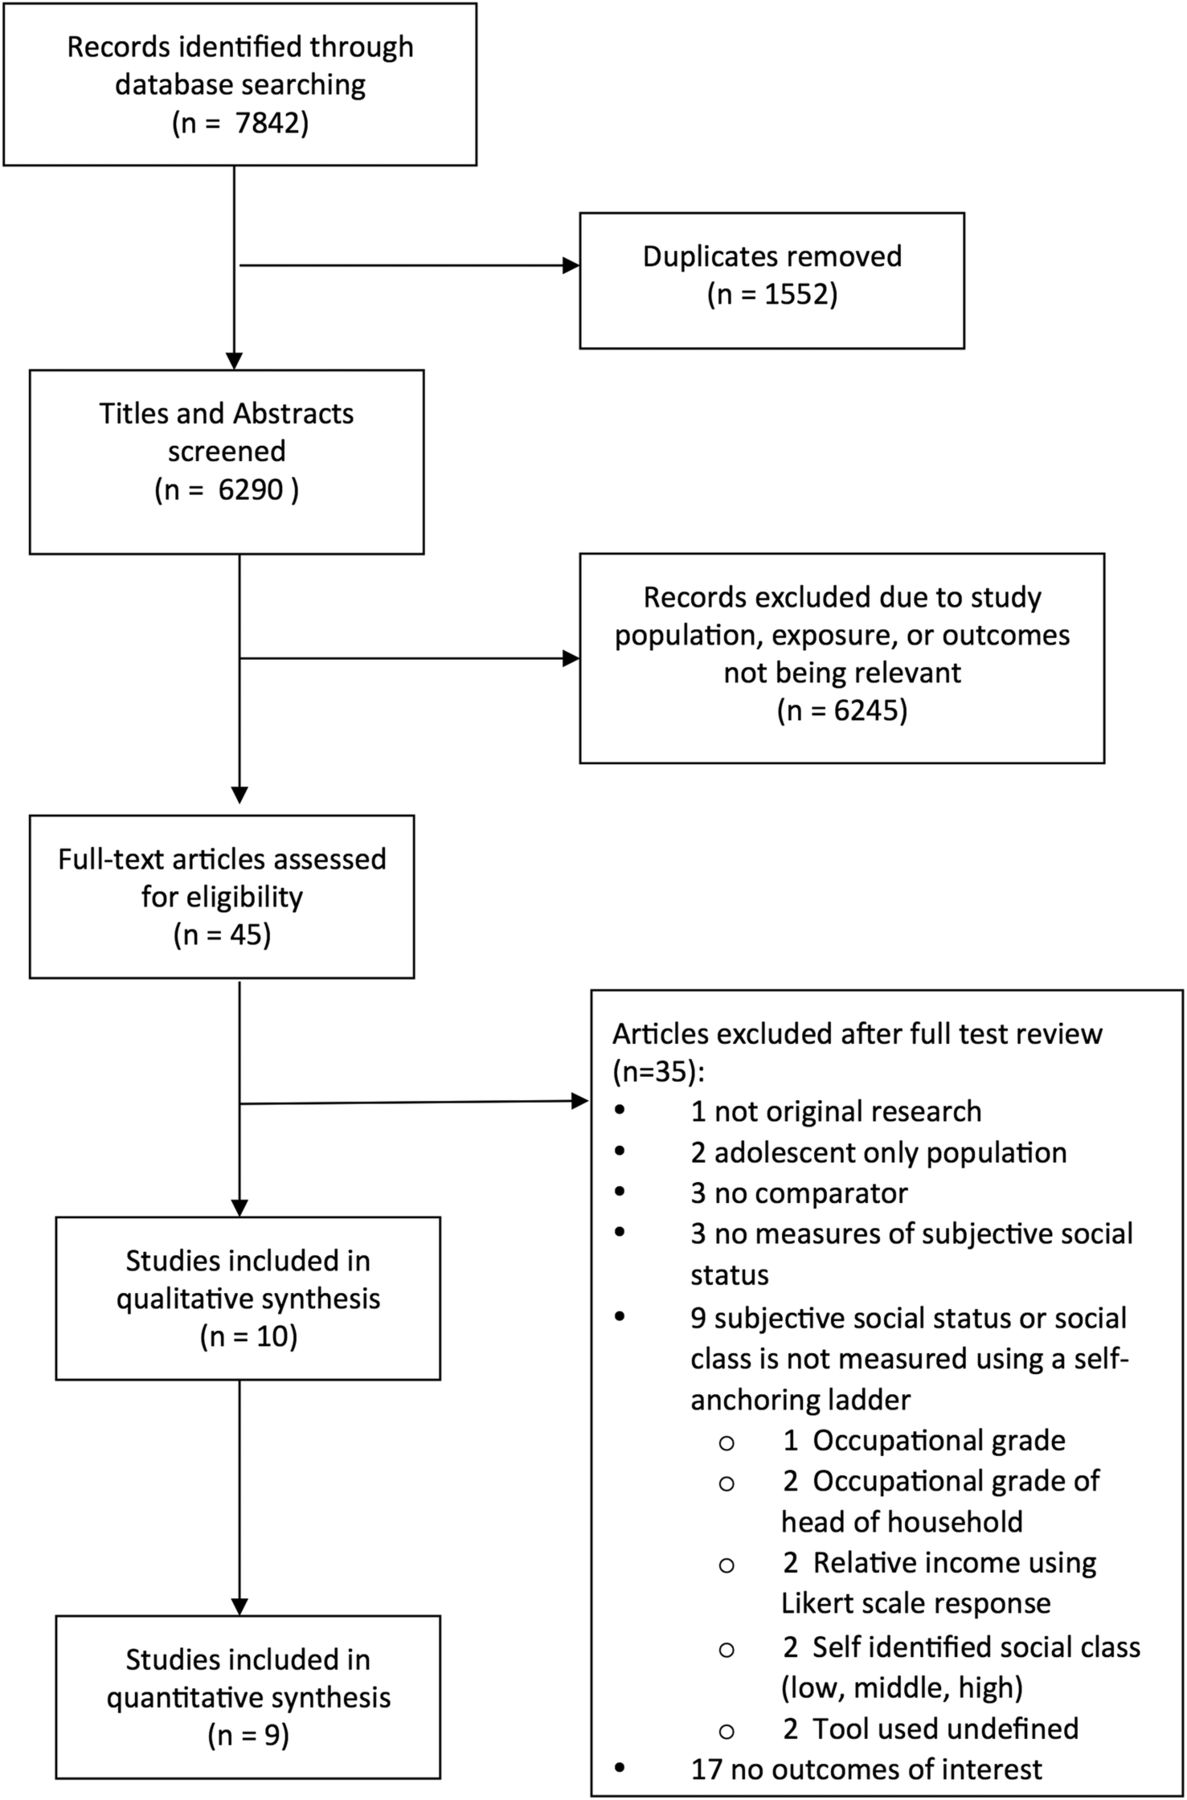
Flow diagram of the study selection process.
Study characteristics
Of the 10 studies, one study reported on two separate cohorts (Whitehall II and ‘Coronary Artery Risk Development in Young Adults’ (CARDIA)),19 two studies reported outcomes on the same Whitehall II cohort,19 ,22 and another two studies reported outcomes on the same ‘English Longitudinal Study of Ageing’ (ELSA) cohort of participants (table 1).17 ,20
Study characteristics
Although nine were cross-sectional studies with only one being a cohort study,17 four of these19 ,20 ,22 ,25 drew data from longitudinal cohorts but used only one phase of data collection for analysis. Five cohorts were from the USA, four from the UK and two from Asia.
The sample size for the individual study cohorts ranged from 981 to 8152. Nine of 10 studies used a 10-rung ladder to measure SSS, with one study using a nine-rung ladder.19 Six studies used the societal ladder only to measure SSS,17 ,19–22 ,27 one study used the community ladder only25 and three used both.23 ,24 ,26
The method of measurement of each of the five outcomes varied across studies (table 2). The two studies reporting CAD outcomes used self-reported measures.22 ,24 Studies reporting on dyslipidaemia and obesity tended to use more objective measurements (such as measurement of weight, height, waist circumference and use of laboratory tests); studies reporting on hypertension and diabetes used a combination of self-report and objective measures.
Methods of measurement of outcomes
Synthesis of results
SES-unadjusted analysis showed an inverse association between SSS and all outcomes of interest, though not all were statistically significant. Pooled ORs comparing the bottom with the top of the SSS ladder (figure 2) were significantly >1 for CAD (1.82, 95% CI 1.10 to 2.99), hypertension (1.88, 95% CI 1.27 to 2.79), diabetes (1.90, 95% CI 1.25 to 2.87) and dyslipidaemia (3.68, 95% CI 2.03 to 6.64), but did not reach statistical significance for obesity (1.57, 95% CI 0.95 to 2.59). The corresponding ORs per rung decrease in SSS for CAD, hypertension, diabetes, dyslipidaemia and obesity were 1.06 (95% CI 1.01 to 1.12), 1.07 (95% CI 1.02 to 1.11), 1.07 (95% CI 1.02 to 1.11), 1.14 (95% CI 1.07 to 1.21) and 1.05 (95% CI 0.99 to 1.10), respectively.

Forest plot of ORs of coronary artery disease, hypertension, diabetes, dyslipidaemia and obesity comparing the bottom with the top of the subjective social status ladder, unadjusted for socioeconomic status.
When analyses were adjusted for objective SES measures, there was attenuation of the association between SSS and outcomes. Pooled SES-adjusted ORs comparing the bottom versus top of the SSS ladder (figure 3) were statistically significant only for dyslipidaemia (2.10, 95% CI 1.09 to 4.06), with a non-statistically significant trend seen for the other outcomes (1.12 (95% CI 0.58 to 2.16) for CAD, 1.32 (95% CI 0.89 to 1.96) for hypertension, 1.34 (95% CI 0.95 to 1.90) for diabetes and 1.26 (95% CI 0.93 to 1.71) for obesity). The corresponding SES-adjusted ORs per rung decrease in SSS were 1.08 (95% CI 1.01 to 1.15) for dyslipidaemia, 1.01 (95% CI 0.95 to 1.08) for CAD, 1.03 (95% CI 0.99 to 1.07) for hypertension, 1.03 (95% CI 0.99 to 1.07) for diabetes and 1.02 (95% CI 0.99 to 1.06) for obesity.

Forest plot of ORs of coronary artery disease, hypertension, diabetes, dyslipidaemia and obesity comparing the bottom with the top of the subjective social status ladder, adjusted for socioeconomic status.
Inspection of SES-unadjusted forest plots revealed little visual heterogeneity, with all point estimates being >1 for all outcomes, with the exception of one study in diabetes27 and one study in obesity.24 The I2 statistics varied from 0.0% for CAD and dyslipidaemia to 69.8% for obesity. The outcomes of hypertension and obesity demonstrated statistically significant heterogeneity (Cochran Q test p=0.018 and 0.010, respectively), likely driven by the large number of study participants, and thus, statistical power for the test of heterogeneity in these studies.
Stratified analysis and meta-regression
To explore study heterogeneity, stratified analysis and meta-regression were performed on five variables: ethnicity, sex and three quality measures (table 3).
Stratified analyses of pooled ORs (95% CI) of hypertension, diabetes and obesity comparing the bottom versus the top of the subjective social status ladder (number of pooled studies in parenthesis after effect estimate)
Analysis stratified by ethnicity revealed increased effect sizes for hypertension (figure 4 A), diabetes (figure 4 B) and obesity (figure 4 C) for studies with a predominantly Caucasian sample, compared to studies with a predominantly non-Caucasian sample (ORs comparing bottom with top of SSS ladder: 2.61 (95% CI 1.42 to 4.79), 2.35 (95% CI 1.35, 4.10) and 3.01 (95% CI 1.24 to 7.34) for hypertension, diabetes and obesity, respectively, for studies with a predominantly Caucasian sample with 1.24 (95% CI 0.84 to 1.83), 1.37 (95% CI 0.87 to 2.15) and 1.06 (95% CI 0.76 to 1.48), respectively, for studies with a predominantly non-Caucasian sample). For two of the three quality measures (adequacy of adjustment of non-SES confounders and level of selection bias), better quality studies reported greater effect sizes compared with lower quality studies for all three outcomes. No differences in effect sizes were seen between studies using objective versus subjective outcome measures. Ethnicity and study quality seemed, at least in part, to explain between-study heterogeneity.

Forest plots of OR of hypertension (A), diabetes (B) and obesity (C) comparing the bottom with the top of the subjective social status ladder, stratified by ethnicity.
Meta-regression performed for each of the above five variables did not result in any statistically significant p values, likely due to being underpowered from limited numbers of studies. p Values approached significance for ethnicity and adequacy of adjustment of confounders (p=0.065 for both variables, for the outcome of obesity).
Publication bias
Begg's test for funnel plot asymmetry was not statistically significant for any of the five outcomes. Visual inspection of funnel plots did reveal visual asymmetry for hypertension only, so a sensitivity analysis using the trim and fill method was performed. The OR of hypertension comparing the bottom with top of the SSS ladder after imputation of hypothetical ‘missing’ studies decreased slightly to 1.47 (95% CI 0.96 to 2.24), compared with an OR of 1.88 (95% CI 1.27 to 2.79) without imputation. Therefore, publication bias may have resulted in slightly overestimated effect sizes for hypertension alone though the same trends remain.
Study quality
Assessment of study quality can be found in table 4.
Study quality criteria
One area of deficiency was in study samples being insufficiently representative of the target population due to the use of convenience samples,24 ,26 lack of description of recruitment strategies,21 ,25 lack of reporting of response rates,17 ,25–27 high or unreported exclusion rates23–26 and lack of reporting of participant demographics.19 ,22 In addition, nearly three-quarters of included studies only performed limited adjustment of non-SES confounders, such as for age alone, or age and marital status, without consideration of comorbidities or cardiovascular risk behaviours.19–25 Despite these limitations, there were clear areas of strengths in study quality. All 10 studies drew the exposure and comparator groups from the same population, 9 of 10 studies had a well-defined sample population, and eight studies performed appropriate statistical analyses. Half the included studies used objective outcome measures.
Discussion
In this meta-analysis of nine studies, there appeared to be a consistent and statistically significant increase in odds, of approximately 1.8-fold to 3.7-fold, of CAD, hypertension, diabetes and dyslipidaemia when comparing the bottom with the top of the SSS ladder; there was a non-significant trend for obesity. To the best of our knowledge, this is the first systematic review and meta-analysis to comprehensively summarise the body of literature examining the association between SSS and cardiovascular disease and cardiovascular risk factors.
A previous qualitative study demonstrated that individuals cite income, education and occupation as the top three dimensions used to determine their own SSS ranking.9 SES measures cannot therefore be considered confounders, due to their place on the causal pathway of SES, SSS and health outcomes. That is, if SES affects health due to status differentiation and its psychosocial consequences rather than absolute resource deprivation, then it is likely inappropriate to adjust for these factors that contribute to, and are closely associated with, social status.29 Despite probable over-adjustment for socioeconomic factors, our meta-analysis shows that a consistent trend remains between lower SSS and higher odds of cardiovascular risk and cardiovascular disease after adjustments for SES, with all ORs for all outcomes remaining >1. This adds robust evidence that not only is SSS likely a mediator in the SES—cardiovascular outcomes pathway, but that SSS is still independently associated with cardiovascular risk independent of income, education or occupation. That is, the perception of where one stands on a social hierarchy is associated with health effects independent of a person's actual objective income, education or occupation.
Various bodies of evidence point to the role of psychosocial effects of social status on health, including studies in baboons and macaques, which show that these non-human primates are organised in linear social hierarchies; those who are subordinate tend to have higher lipid levels, cortisol levels, more coronary plaques, and higher rates of obesity.30–33 In a study that manipulated social status by switching female macaque monkeys from one social group to another, those who previously held dominant positions but were then subordinate in their new group had a fivefold risk of developing coronary plaques compared with those that did not change social position.32 This would argue that it is the psychosocial implications of social status rather than physical fitness or ability to attain resources that contribute to cardiovascular risk. In the income inequality literature, residents of countries with high income inequality have more status anxiety,34 and increased cardiovascular morbidity, mortality and risk factors35 compared with countries with less income inequality. However, none of the primate or income inequality studies actually measures individual perception of social status and its association on health, but rather infers that this perception must be present and acts as a causal factor in determining health outcomes because absolute resource and income levels cannot adequately explain the social gradient in health. In this sea of indirect evidence, our review advances knowledge by demonstrating that explicitly measured perceived social status is associated with risk of cardiovascular disease.
Although previous literature has clearly demonstrated the associations between psychosocial factors and health outcomes, the literature does not link these psychosocial factors to social status. For example, control, anxiety, social supports, social participation and social cohesion and trust have all been shown to contribute to health outcomes, though these were not specifically studied in the context of psychosocial responses to social status.36 ,37 Similarly, health disparities based on occupation have been attributed to imbalances between high demands/low control, and high personal efforts/low rewards; these imbalances increase the risk of cardiovascular disease.36 ,38 Perhaps these findings at the workplace are a microcosm of a similar mechanism between the same imbalances in life as a whole leading to the development of cardiovascular disease, for those with low perceived social class. The simple self-ranking on the Macarthur Scale of Subjective Social Status may capture this spectrum of psychosocial factors and imbalances between effort and reward, making it a robust summary measure of the psychosocial effects of social status.
Previous studies have suggested that the inverse relationship between SSS and health is less strong in African-Americans compared with Caucasians.19 ,39 Our stratified analysis, though underpowered, demonstrates similar results, with pooled ORs for hypertension, diabetes and obesity comparing those at the bottom with the top of the SSS ladder being statistically significantly >1 for studies with a predominantly Caucasian population, but not for studies with a predominantly non-Caucasian population. This may be because different ethnicities derive social status from different sources. For example, African-Americans may derive social status from racial identity, Afrocentric values, self-esteem and personal efficacy40 ,41; they have been shown to have higher self-perceived status compared with Caucasians even at lower income levels.41 The MacArthur Scale of Subjective Social Status societal ladder explicitly defines the top of the ladder as those with ‘the most money, the most education, and the most respected jobs’.9 Therefore, low SSS as measured by this ladder may not have the same associations with poor health outcomes for non-Caucasians who may have higher self-worth and satisfaction than is indicated by this ladder. Future research in SSS may need to take this into account by examining associations between SSS and health specifically within specific ethnic groups rather than in a heterogeneous and ethnically diverse population. In addition, perhaps the MacArthur Scale of Subjective Social Status community ladder, where perceived social status is measured without reference to objective socioeconomic measures, may more accurately reflect social status in non-Caucasian ethnicities that derive status primarily from non-SES measures; however, a comparison of the validity of the societal versus the community ladder is needed before the community ladder is widely adopted over the more commonly used and studied societal ladder.
Limitations
There are limitations to our review. First, as with any systematic review, our study is limited by the quality of underlying studies. While there were clear strengths in the included studies, our quality assessment revealed deficiencies particularly in the areas of the representative study samples, adjustment of confounders, and in length of follow-up. These issues highlight the difficulty in performing studies at the intersection between social determinants and health. Our stratified analysis suggested that higher quality studies reported higher effect sizes compared with lower quality studies. Given this, our review likely underestimated the association between SSS and CAD, and CAD risk factors. Second, we were unable to assess the role of negative affect in the association between SSS and cardiovascular health, given that only one study included psychosocial variables in their regression models. However, previous literature suggests that negative affect may act as a mediator rather than a confounder in the association between SSS and health outcomes,42 and adjustment for these factors may, therefore, not always be appropriate. Third, because only 1 of 10 studies was a cohort study, the association between SSS and CAD and CAD factors cannot be deemed to be causal, despite consistency of effect and biological plausibility. We note though that five of the nine cross-sectional studies used longitudinal patient cohorts; there is, therefore, great potential for future cohort studies, given that data for these cohorts are available. Lastly, we included only studies that measured SSS using a ladder scale, excluding a total of nine studies that measured SSS using a different tool. However, studies using other SSS measures show consistent results, with low perceived social class being associated with increased risk of cardiovascular disease, and cardiovascular risk factors, reduced mobility, and worse self-rated health.4 ,5 ,7 ,8 Restriction of studies to those using SSS ladders was necessary to allow a standard comparison across studies given the heterogeneity and uncertain validity of other instruments; this restriction is unlikely to have biased our findings and conclusions.
Implications
Although social hierarchies are inevitable, the presence of the hierarchy itself does not automatically translate to perceptions of status inferiority or superiority, but rather depends on how this hierarchy is linked to resource distribution.37 Unequal societies result in a greater differential in social status. Interventions to address the association between SSS and cardiovascular risk can, therefore, work to reduce the social hierarchy, or alternatively, to address the psychosocial consequences of low standing in this hierarchy. The former includes interventions aimed at improved early childhood education and income distribution, such as changing taxation rules and increasing minimum income thresholds to allow for healthy living.43 The latter includes interventions to improve social cohesion, social trust and social participation; examples include increased variety of work, use of skills, and level of control in the workplace, and increased accessibility and affordability of public transportation. Our findings serve to highlight not only the need for these interventions for the health of a population, but may also provide guidance on more specific public health and social policies. For example, commitment to work and parental roles have been shown to be associated with higher self-image in the middle-aged population. Policies that invest in human capital, such as through job training and job creation, may therefore have greater impacts on SSS, and subsequently on health compared with policies that provide income assistance and subsidies. The UK has led in recognising the role that social disparities play in health, with specific recommendations for interventions in the Acheson Report44 and Marmot Review.45 These recommendations though have been slow to gain traction due to the need for multiple stakeholder involvement, spanning local and national governments, in health and non-health sectors. Given the clear associations between social status and health, health professionals and public health agencies are not only well placed, but also have both a social and professional responsibility to lead and advocate for these policy changes, acting as a link between politics, health and research.
Acknowledgments
The authors thank Diane Lorenzetti for her guidance in developing the search strategy.
References
Footnotes
Contributors KLT, RR and WAG conceived of the study and were involved in study design, development of study protocol and data extraction form, and statistical analyses. KLT and RR undertook the search strategy, determined eligibility of articles, extracted data, performed assessments of study quality and drafted the manuscript. All authors were involved in data interpretation, data analysis and critical revision of the manuscript. All authors had full access to all the data, and can take responsibility for the integrity of the data and accuracy of the data analysis. All authors have read and approved the manuscript. KLT is supported by fellowship awards from the Canadian Institutes of Health Research and Alberta Innovates- Health Solutions. RR is supported by a graduate studentship award from Alberta Innovates – Health Solutions.
Competing interests None declared.
Provenance and peer review Not commissioned; externally peer reviewed.
Data sharing statement No additional data are available.