Article Text

Abstract
Objective/design We conducted a comparative risk assessment analysis to estimate the cardiometabolic disease (CMD) mortality attributable to 11 dietary and 4 metabolic risk factors in 20 countries of the Middle East by age, sex and time. The national exposure distributions were obtained from a systematic search of multiple databases. Missing exposure data were estimated using a multilevel Bayesian hierarchical model. The aetiological effect of each risk factor on disease-specific mortality was obtained from clinical trials and observational studies. The number of disease-specific deaths was obtained from the 2010 Global Burden of Disease mortality database. Mortality due to each risk factor was determined using the population attributable fraction and total number of disease-specific deaths.
Setting/population Adult population in the Middle East by age, sex, country and time.
Results Suboptimal diet was the leading risk factor for CMD mortality in 11 countries accounting for 48% (in Morocco) to 72% (in the United Arab Emirates) of CMD deaths. Non-optimal systolic blood pressure was the leading risk factor for CMD deaths in eight countries causing 45% (in Bahrain) to 68% (in Libya) of CMD deaths. Non-optimal body mass index and fasting plasma glucose were the third and fourth leading risk factors for CMD mortality in most countries. Among individual dietary factors, low intake of fruits accounted for 8% (in Jordan) to 21% (in Palestine) of CMD deaths and low intake of whole grains was responsible for 7% (in Palestine) to 22% (in the United Arab Emirates) of CMD deaths. Between 1990 and 2010, the CMD mortality attributable to most risk factors had decreased except for body mass index and trans-fatty acids.
Conclusions Our findings highlight key similarities and differences in the impact of the dietary and metabolic risk factors on CMD mortality in the countries of the Middle East and inform priorities for policy measures to prevent CMD.
This is an Open Access article distributed in accordance with the Creative Commons Attribution Non Commercial (CC BY-NC 4.0) license, which permits others to distribute, remix, adapt, build upon this work non-commercially, and license their derivative works on different terms, provided the original work is properly cited and the use is non-commercial. See: http://creativecommons.org/licenses/by-nc/4.0/
Statistics from Altmetric.com
Strengths and limitations of this study
This study provides country-specific estimates of the cardiometabolic disease mortality attributed to individual dietary and metabolic risk factors informing national priorities for prevention strategies.
Dietary data used in this study were from mixed sources, which increases the statistical uncertainty in dietary estimates. A major advantage of the study is that it has incorporated various sources of uncertainty into the analysis and has quantified the overall uncertainty intervals for the mortality estimates.
The aetiological effect sizes of diet–disease relationships were obtained from the most recent meta-analyses of the clinical trials and observational studies that had adjusted for major confounders. However, the possibility of residual confounding cannot be excluded.
The cardiometabolic disease burden of individual dietary factors might have been underestimated due to the measurement error and adjustment of aetiological effect sizes for potential mediators (eg, blood pressure, body mass index and blood lipids).
The number of cardiometabolic deaths attributed to the combined effect of dietary factors might have been overestimated due to the correlation of dietary factors at the population level.
Introduction
Cardiometabolic disease (CMD), including cardiovascular disease (CVD) and type 2 diabetes mellitus (DM), is the leading cause of mortality in the Middle East and North Africa, accounting for nearly one million deaths annually.1 ,2 Over the past few decades, along with socioeconomic changes, the prevalence of a suboptimal lifestyle (eg, dietary) and metabolic (eg, obesity) risk factors has rapidly increased in this region.2–6 Yet the absence of a valid and reliable methodology for comparative risk assessment, as well as systematic and comparable methods to assess nationally representative risk patterns, has hindered accurate estimation of the impacts of lifestyle and metabolic risk factors on CMD in each country of this region. Several prior efforts have estimated how various risk factors contribute to CMD globally. For instance, the World Health Organization (WHO) estimated the global and regional burdens of disease attributable to multiple risk factors, including four metabolic factors (high blood pressure, high blood cholesterol, high blood glucose and adiposity) and only one dietary factor (low fruits and vegetables combined).7 Other nation-specific analyses—for example, in the USA, Australia, Iran, Japan and Mexico—have similarly estimated the health impact of selected dietary and metabolic risk factors.8–12 The global burden of disease (GBD) 2010 study built on these prior efforts by developing more systematic and comparable methods to collect nationally representative data and evaluating aetiological effect sizes of risk factor–disease relationships.2 A particular advance of GBD 2010 was the new systematic assessment of multiple dietary risk factors for CMD, based not only on national food availability estimates but also individual-level data on dietary consumption.2 ,13 These prior efforts included estimation of the contribution of suboptimal diet and metabolic risk factors to chronic disease mortality in the overall Middle East and North African region.14 However, detailed national results, including by key subgroups within each country by age and sex, have not as yet been reported. In addition, these prior analyses have not utilised the most current evidence for aetiological effects of diet, which produces substantial overall CMD burdens; nor have they examined how the selection of optimal levels of dietary and metabolic risk factors influences the estimated CMD impact. To address these key gaps in knowledge, we evaluated the CMD mortality attributable to dietary and metabolic risk factors in 20 countries of the Middle East and North Africa, as well as changes in risk factor levels and corresponding attributable mortality between 1990 and 2010.
Methods
The methods and standardised data collection protocol have been described in detail elsewhere.1 ,2 ,13 ,15–20 In brief, we conducted a population-level comparative risk assessment analysis for 15 dietary and metabolic risk factors to estimate the number of deaths that would have been averted in 1990 and 2010 in 20 countries of the Middle East and North Africa if distributions of risk factor exposure had been sustained at an optimal level (table 1). The countries included in our analysis were Afghanistan, Algeria, Bahrain, Egypt, Iran, Iraq, Jordan, Kuwait, Lebanon, Libya, Morocco, Oman, Palestine, Qatar, Saudi Arabia, Syria, Tunisia, Turkey, the United Arab Emirates (UAE) and Yemen.
Metabolic and dietary risk factors, their definitions, optimal levels and disease outcomes
Selection of risk factors
We selected 11 dietary and 4 metabolic risk factors for which sufficient evidence was available on the presence and magnitude of probable causal relationships with coronary heart disease (CHD), stroke, other CVDs or DM from high-quality epidemiological studies. The dietary factors included low intake of fruits, whole grains, vegetables and beans, seafood ω-3 fats, nuts and seeds and polyunsaturated fatty acids (PUFA) as a replacement for saturated fatty acids (SFA) or carbohydrate, and high intake of sodium, trans fats, processed meat, sugar-sweetened beverages (SSBs) and unprocessed red meat. Several other important dietary factors (eg, low intake of milk, low intake of dietary calcium and high intake of dietary cholesterol) were also considered but were not included because the evidence on causal effects was less convincing.13 The metabolic risk factors included in our analysis were high systolic blood pressure (SBP), fasting plasma glucose, serum total cholesterol and body mass index (BMI). Table 1 summarises these 15 risk factors, their optimal level, also referred to as theoretical-minimum-risk exposure distributions, and disease outcomes.
Data sources
Dietary factors
We estimated the intake of each dietary factor by sex, age and time in 187 countries using the data from individual-level nutrition surveys and the United Nations Food and Agricultural Organization (FAO) food balance sheets data from each country. To identify nationally representative nutrition surveys from all countries around the world, we conducted systematic searches of multiple databases; collected data on the survey characteristics as well as the mean and SD of measured intakes of the dietary factors of interest by country, sex, age and time; and performed survey quality assessment by review of evidence for selection bias, sample representativeness, response rate and validity of dietary assessment methods. The characteristics of the 15 dietary surveys identified in 20 countries of the Middle East and North Africa and included in this study are provided in the data supplement (see online supplementary table S1).
For countries without identified dietary surveys, we utilised the comprehensive FAO food balance sheets, providing data on national food availability per capita for major food groups in 176 countries across all years. Food availability data from the FAO food balance sheets from all years between 1980 and 2010 were extracted and used to create 17 standard food and nutrient groups most closely matching the key dietary factors of interest. Since availability data may overestimate true intakes, we determined and utilised the relationship between individual-level dietary surveys and the FAO food balance sheets, accounting for age and sex patterns in the individual-level intakes, to adjust the estimated intakes in those countries having only FAO data. For each dietary factor, we developed an age-integrating Bayesian hierarchical model that estimated the mean consumption level and its statistical uncertainty for each age-sex-country-year stratum. Primary inputs were the survey-level intake data, including all available country-specific, time-specific, age-specific and sex-specific consumption levels (mean, distribution), data on the numbers of participants in each strata and survey-level indicator covariates (sampling representativeness, dietary assessment method, type of dietary metric); the food disappearance data derived and standardised from the FAO including 17 nutrients or food groups and 4 factors derived from principal components analysis of these 17 variables; lagged distributed national income; and random effects for each country, region (21 GBD regions) and super-region (7 GBD groupings of super-regions). For five countries (Afghanistan, Bahrain, Iraq, Oman and Qatar) with no FAO food balance sheets data, dietary data were imputed based on the regional mean in each age-sex group and the country-specific covariates (see online supplementary figure S1). Model validity across different iterations had been evaluated using cross-validation; and sources of uncertainty were identified and incorporated, including from survey-level versus FAO country data, sampling uncertainty of original data sources, and additional uncertainty associated with suboptimal metrics, subnational samples or household-level surveys. Thus, by combining the individual-level diet surveys and the adjusted FAO data, our dietary estimates in the Global Dietary Database were derived from dietary information available in all countries.
Metabolic risk factors
The distributions of metabolic risk factors were obtained from recently published studies by GBD Metabolic Risk Factors Diseases Collaborating Group.17–20 In these studies, the researchers systematically reviewed published and unpublished studies from 1980 to 2008 and collected data on the mean and SD of each metabolic risk factor from representative surveys in all countries across the world. Data were collected and modelled separately for men and women. A multilevel Bayesian hierarchical model was used to estimate missing data and derive the average risk factor level and their 95% uncertainty interval (UI) for each age-country-year unit.
Aetiological effects of risk factors on mortality
For each dietary factor, we obtained the relative risk (RR) of CHD, stroke and DM mortality (or incidence) per unit of exposure based on the most recent published systematic reviews and meta-analyses of epidemiological studies (see online supplementary table S4).21 For those dietary factor-disease pairs for which no recent systematic review and meta-analysis were available (eg, nuts and CHD, stroke and DM), we conducted de novo meta-analyses.22 The present analyses are based on the most updated available data until November 2014 on the probable or convincing aetiological effects of diet on CMD. The studies used for quantifying the aetiological effect sizes included randomised controlled trials of exposure reduction (ie, nuts, PUFA, ω-3 fatty acids and sodium) and observational studies that estimated the effects of baseline or cumulatively updated exposure. The majority of observational studies used for effect sizes had adjusted for important potential confounders (eg, age, sex, race, education, socioeconomic status, physical activity, smoking, alcohol consumption). Aetiological effects of metabolic risk factors were estimated using the data from large cohort pooling projects.23 For each risk factor-disease pair, we used the same RR for men and women and consistent age-patterns of RRs.23 Effect modification by other factors (eg, race, prevalent disease) was also evaluated and incorporated in the analysis where applicable.
Optimal distributions
To measure the mortality effects of all non-optimal levels of exposure consistently and comparably across dietary and metabolic risk factors, we used an optimal level as the alternative exposure distribution (table 1). The optimal intake for dietary factors with protective effects was defined as the intake levels to which beneficial effects may plausibly continue based on epidemiological studies. For example, the intake of ω-3 fatty acids seems to reduce CHD mortality at intakes up to 250 mg/day, but has relatively little additional mortality benefits at higher intakes.24 In setting an optimal intake for protective factors, we also took into account the levels observed in populations that have high intake.21 For metabolic risk factors and dietary factors with harmful effects, optimal level was defined as the exposure levels associated with the lowest level of harm. For example, optimal intake for processed meat was zero. The SD of the optimal levels was determined using the global mean to SD regression co-efficient.17–20
Disease-specific deaths
The number of deaths due to CHD (ICD-10 codes I20–I25), ischaemic stroke (I63, I65–I67, I69.3), haemorrhagic stroke (I60-62, I69.0-2), hypertensive heart disease (I11–I13), aortic aneurysm (I71), rheumatic heart disease (I01, I02.0, I05–I09), inflammatory heart disease (I33, I42), other CVDs and DM (E10–E14) for the 1990 and 2010 periods was obtained from the GBD 2010 mortality database, which provides estimated annual mortality statistics by country, age, sex and cause of deaths.1 Considering that reliable mortality data from Afghanistan were not available, we excluded Afghanistan from the analysis and only presented the data on the distribution of dietary and metabolic risk factors in this country.
Statistical analysis
For each risk factor, we computed the population-attributable fraction (PAF):
Where x is the exposure level, P(x) is the actual distribution of exposure in the population, P′ (x) is the optimal exposure distribution; RR(x) is the RR of mortality at exposure level x, and m is the maximum exposure level.
PAF measures the total effects of a risk factor (direct as well as mediated through other factors) and represents the proportional reduction in disease-specific mortality that would occur if risk factor exposure was at the optimal level. We calculated the number of deaths from CHD, ischaemic stroke, haemorrhagic stroke, hypertensive heart disease, aortic aneurysm, rheumatic heart disease, inflammatory heart disease, other CVDs and DM attributable to each risk factor by multiplying its PAF by total disease-specific mortality. Deaths attributable to a single risk factor across different disease outcomes were summed to obtain the total attributable mortality to that particular risk factor. We conducted all analyses separately by country, sex and age groups (25–29, 30–34, 35–39, 40–44, 45–49, 50–54, 55–59, 60–64, 65–69, 70–74, 75–79, and 80+years) and time (1990 and 2010).
We also calculated the change in the risk factor level, total CMD mortality and CMD deaths attributable to each risk factor. To calculate the latter, we accounted for the change in population structure by standardising the 1990–2010 population.
Uncertainty and sensitivity analyses
For each risk factor, we estimated the sampling uncertainty of the attributable mortality using the second order Monte Carlo simulation. In this method, for each unit of observation (ie, country-age-sex-year), we drew repeatedly from the normal distribution of exposure (assumed to be normal), a log-normal distribution of disease-specific RRs, a normal distribution of the optimal intake, and a normal distribution of cause-specific mortality. Each set of exposure, disease-specific RR, optimal intake and disease-specific mortality draws was used to calculate the PAF and attributable mortality. We used 1000 draws for each risk factor, and reported 95% UI based on the resulting distributions of 1000 estimated attributable deaths. In addition to the sampling uncertainty, we examined the sensitivity of our results to the choice of the optimal level of each risk factor. All analyses were conducted using R V.2.15.0.
Results
Distribution of dietary and metabolic risk factors by country, sex and age
In 2010, all metabolic risk factors in almost all countries had suboptimal national distributions (figure 1A). The highest national means were seen in Kuwait (BMI 30.2 kg/m2 and serum total cholesterol 5.1 mmol/L), Libya (SBP 132 mm Hg) and Saudi Arabia (fasting plasma glucose 6.4 mmol/L). Similarly, the national intakes of dietary factors in most countries were non-optimal (figure 1B and C). The lowest intakes of protective dietary factors were in Libya (fruits 60.4 g/day and vegetables 134 g/day), Turkey (whole grains 3.2 g/day), Afghanistan (nuts 4.6 g/day), Yemen (PUFA 3.6%E/day) and Lebanon (seafood ω-3 fatty acids 8.3 mg/day). The highest intakes of harmful dietary factors were observed in UAE (processed meat 6.7 g/day), Algeria (red meat 707 g/week), Egypt (trans fat 6.5%E/day), Lebanon (SSBs 185 g/day) and Bahrain (sodium 5404 mg/day). No single country consistently showed a more favourable national profile of all metabolic risk factors or healthier consumption pattern of all dietary factors.
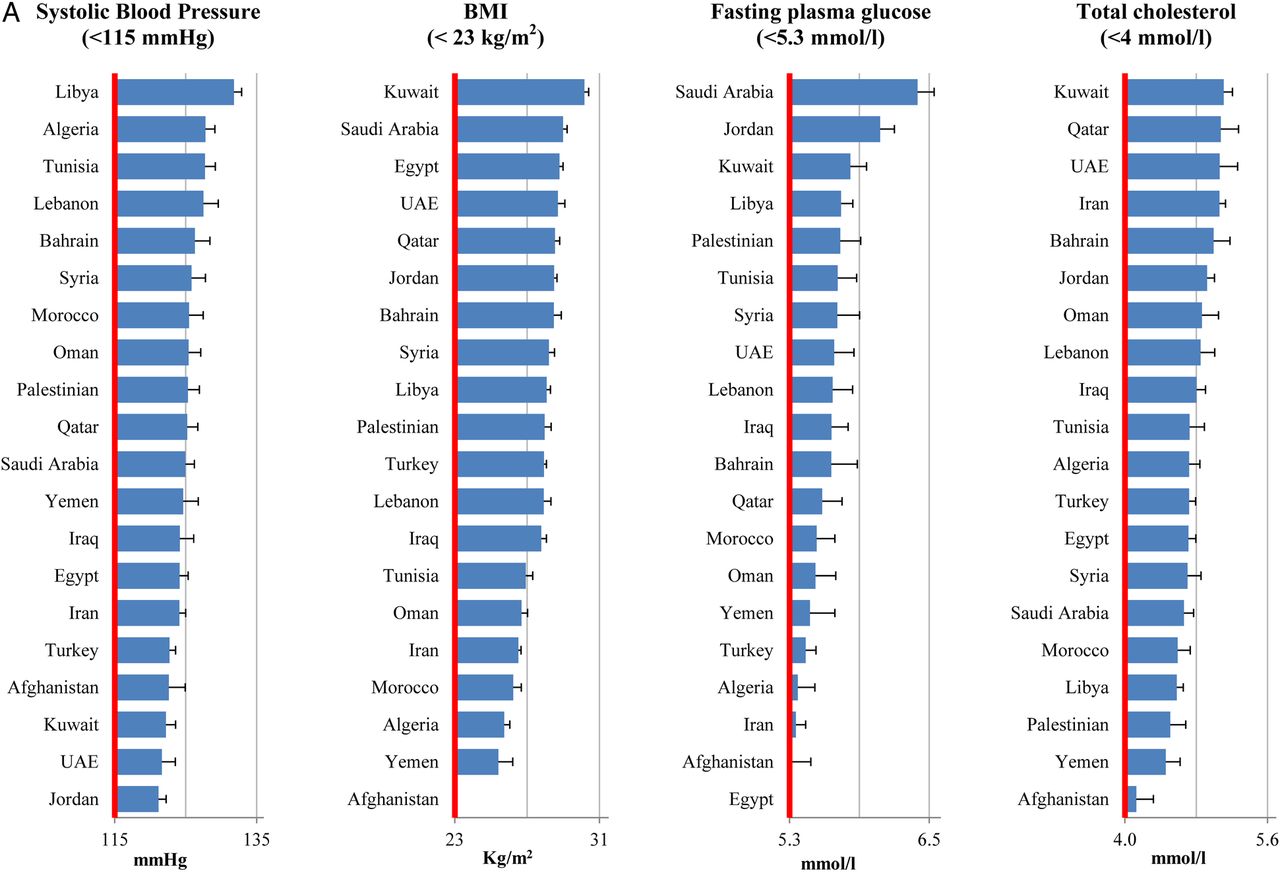
National levels of metabolic risk factors (A) and national intakes of protective (B) and harmful (C) dietary factors in the Middle East and North Africa, by country (2010). Red line represents the optimal level.

Continued

Continued
Women consistently had a higher BMI and total cholesterol in almost all age groups across all countries, whereas no appreciable difference was seen in SBP and fasting plasma glucose levels among men and women (see online supplemental figures S2–S5). The consumption patterns of all dietary factors were similar among men and women except for sodium, which was consistently higher among men across all age groups (see online supplementary figures S6–S9).
SBP consistently increased by age, whereas BMI, fasting plasma glucose and total cholesterol showed a decreasing trend among the elderly (see online supplementary figures S2–S5). The consumption of dietary factors did not vary by age except for SSB intake which decreased by age (see online supplementary figures S6–S9).
CMD mortality by country, sex and age
In 2010, CMD caused 492 036 deaths (49% of CMD deaths due to CHD, 26% stroke, 19% other CVDs and 6% diabetes) among men and 419 102 deaths among women (40% CHD, 30% stroke, 21% other CVDs and 9% diabetes). Nearly 43% of total CMD (388 000 CMD deaths) occurred prematurely (defined as deaths below the age of 70). The highest rates of CMD mortality (per million adults) were seen in Egypt (5722 deaths) and Syria (4167 deaths), and the lowest rates were seen in Qatar (504 deaths), the UAE (832 deaths) and Bahrain (1103 deaths) (see online supplementary figure S10).
CMD mortality attributable to metabolic risk factors by country
Non-optimal SBP (>115 mm Hg) was the leading metabolic risk for CMD mortality in the region accounting for 48% of CMD deaths (436 190 deaths, 95% UI 422 098 to 451 182) (figure 2). Non-optimal BMI (>23 Kg/m2) and fasting plasma glucose (>5.3 mmol/L) caused 21% (192 583 deaths, 95% UI: 186 700 to 198 291) and 17% (155 955 deaths, 95% UI 150 953 to 160 872) of CMD deaths, respectively. High serum total cholesterol (>4 mmol/L) was responsible for 12% of CMD deaths (108 811 deaths, 95% CI 99 687 to 119 315).

Cardiometabolic deaths attributable to dietary and metabolic risk factors in the Middle East and North Africa among (A) men, (B) women, (C) total adult population (2010). Other cardiovascular diseases (CVDs) include hypertensive heart disease, aortic aneurysm, rheumatic heart disease, inflammatory heart disease, other unspecified CVDs.
The ranking of metabolic risk factors was slightly different across countries (see online supplementary tables S5–S23). Non-optimal SBP was the leading metabolic risk factor for CMD mortality in all countries except Bahrain. Non-optimal fasting plasma glucose was the leading risk factor for CMD deaths in Bahrain, the second leading metabolic risk factor for CMD deaths in nine countries (ie, Algeria, Libya, Morocco, Oman, Palestine, Qatar, Saudi Arabia, Tunisia and Yemen), the third leading risk factor for CMD deaths in six countries (ie, Iraq, Jordan, Kuwait, Lebanon, Syria and Turkey) and the fourth leading risk factor for CMD deaths in the UAE, Egypt and Iran. Non-optimal BMI was the second or third leading metabolic risk factor for CMD mortality in most countries. Serum total cholesterol ranked the third or fourth leading risk factor for CMD mortality in most countries.
The CMD mortality rate due to individual metabolic risk factors varied across countries (table 3). The number of CMD deaths (per million adults) due to non-optimal SBP ranged from 208 deaths (in Qatar) to 2855 deaths (in Egypt). The highest number of CMD deaths attributable to non-optimal fasting plasma glucose was observed in Morocco (1351 deaths per million adults). The highest number of CMD deaths due to non-optimal BMI (1,252 deaths per million adults) and serum total cholesterol (638 deaths per million adults) were seen in Egypt. The lowest number of CMD deaths (deaths per million adults) attributable to non-optimal BMI (170 deaths), fasting plasma glucose (187 deaths) and serum total cholesterol (98 deaths) were seen in Qatar.
CMD mortality attributable to dietary factors by country
Low intake of fruits (112 960 deaths, 95% UI 108 958 to 117 346) and low intake of whole grains (104 234, 95% UI 101 156 to 107 283) were the leading dietary risk factors for CMD mortality in the region accounting for 12% and 11% of total CMD deaths, respectively (table 2). Among harmful dietary factors, high intake of sodium was responsible for the highest number of CMD deaths (86 010 deaths, 95% CI 53 811 to 116 434).
Cardiometabolic deaths attributable to dietary and metabolic risk factors in the Middle East and North Africa (2010)*
Like metabolic risk factors, the ranking dietary factors varied across the countries (see online supplementary tables S5–S23). Low intake of fruits was the leading dietary risk factor for CMD mortality in 10 countries, the second leading risk factor for mortality in 5 countries (Egypt, Iran, Kuwait, Lebanon and Turkey) and the third leading dietary factor for mortality in Bahrain and the UAE. Low intake of whole grains was the leading dietary risk factor for CMD mortality in four countries (Jordan, Kuwait, Turkey and the UAE). The leading dietary risk factor for mortality in Iran was low intake of vegetables and beans, and the leading dietary risk factor for mortality in Lebanon and Qatar was low intake of seafood ω-3 fatty acids. Among harmful dietary factors, high intake of sodium was responsible for the highest number of CMD deaths in most countries except Egypt where high intake of trans fat was the leading dietary risk factor for mortality.
The absolute CMD burden of each individual dietary factor was also different across countries (table 3). The highest number of CMD deaths due to low intake of fruits (814 deaths per million adults, 95% CI 742 to 887), whole grains (768 per million adults, 95% CI 727 to 810) and nuts (462 deaths, 95% CI 417 to 510) were observed in Egypt; the highest number of CMD deaths attributable to low intake of seafood ω-3 fatty acids (621 per million adults, 95% CI 550 to 689) was observed in Syria; and the highest number of CMD deaths attributable to low intake of vegetables and beans (483 per million adults, 95% CI 437 to 530) was observed in Libya. The lowest number of CMD deaths attributable to all dietary factors (except for unprocessed red meat) was observed in Qatar.
Cardiometabolic deaths (per million adults) attributable to dietary and metabolic risk factors in 20 countries of the Middle East and North Africa (2010)
CMD mortality attributable to metabolic and dietary risk factors by age and sex
The number of CMD deaths due to dietary and metabolic risk factors increased by age mainly due to the increase in the number of CMD deaths in the older age groups. However, the proportion of CMD deaths attributable to these risk factors decreased by age. Nearly 50% of CMD deaths due to metabolic and dietary risk factors occurred before the age of 70. Among metabolic risk factors, non-optimal total cholesterol had the highest proportion of premature CMD deaths (61% of all cholesterol-attributable deaths) and non-optimal fasting plasma glucose had the lowest proportion of premature CMD deaths (46%) (see online supplementary figure S11⇑).
The proportion of CMD deaths due to BMI was greater among women while no appreciable difference was seen in CMD mortality due to other metabolic risk factors (table 2). On the other hand, men consistently had a slightly larger proportion of CMD deaths due to most dietary factors.
Change in risk factor distributions, CMD mortality and CMD burden due to risk factors between 1990 and 2010
During the 1990–2010 period, the adult population of the Middle East and North Africa has increased by 94% (from 115 914 968 to 224 905 818); the total number of CMD deaths has increased by 58% (from 576 999 to 911 137); the number of CMD deaths per million adults has decreased by 19%; and the age-specific CMD mortality decreased in all age groups. Among metabolic risk factors, the regional mean of BMI has increased by 7%, whereas the regional mean of other metabolic risk factors has not changed significantly. Among protective dietary factors, regional intakes of nut and seafood ω-3 fatty acids have increased by 16% and 13%, respectively, while the whole grains consumption has decreased by 21%. Among harmful dietary factors, trans fat intake and sodium intake increased by 20% and 7% while consumption of processed meat and unprocessed red meat was decreased by 5% and 6%, respectively (see online supplementary figure S12⇑). Furthermore, the CMD mortality attributable to all metabolic risk factors has decreased except for BMI, which has increased by 18%. Similarly, CMD mortality attributable to all dietary factors has decreased except for the high intake of trans fat, which has increased by 10% (see online supplementary tables S2 and S3).
Sensitivity analyses
In a sensitivity analysis, change of optimal levels for SBP (from 115 to 110 mm Hg), BMI (from 23 to 21 kg/m2), fasting plasma glucose (from 5.3 to 4.9 mmol/L) and total cholesterol (from 4.0 to 3.8 mmol/L) increased the attributable mortality by 20–30%. Also, change of optimal level for sodium from 2000 to 1000 mg/day increased the attributable mortality by 30% (see online supplementary figure 13).
To remove the contribution of differences in age structure, we standardised the number of CMD deaths attributable to each risk factor using the WHO standard population.25 Age-standardisation increased the CMD mortality due to all risk factors in all countries signifying the relatively young population of the countries in 2010. This increase was of larger magnitude in specific countries including Qatar, the UAE, Kuwait and Bahrain. Additionally, we used the age-standardised proportional mortality to remove the contribution of difference in underlying CMD mortality. Using age-standardised proportional mortality resulted in significant changes in the relative CMD burden of risk factors across countries. This sensitivity analysis provides an estimate of the contribution of each risk factor to the between-country heterogeneity of CMD burden independent of age structure and underlying country-specific CMD mortality. However, we believe that non-standardised mortality rates provide decision-makers in each country with a better estimate of the true CMD burden of each risk factor in their country based on the total CMD mortality due to all risk factors and should be used for planning prevention strategies in these countries.
Discussion
We systematically evaluated and quantified the impact of 11 dietary and 4 metabolic risk factors on CMD mortality by age and sex in 20 countries of the Middle East and North Africa in 1990 and 2010. Our results demonstrate that suboptimal diet and high SBP were the leading risk factors for CMD mortality accounting for 50–70% of CMD deaths in the countries of the region. Non-optimal BMI and fasting plasma glucose were the third and fourth leading risk factors for CMD mortality in most countries. Among individual dietary factors, low intake of fruits and whole grains were responsible for the highest number of CMD deaths. Our investigation also highlights key similarities and differences in CMD burden due to these risk factors across countries and informs evidence-based priorities for prevention strategies as well as the subsequent implementation research in the region.
An unhealthy lifestyle (eg, poor diet and physical inactivity), poor detection and inadequate treatment are the key contributors to the non-optimal levels of metabolic risk factors in this region.26–32 Additionally, sociocultural changes including economic development, urbanisation and modernisation have been shown to contribute to this problem through the increased availability, affordability and consumption of unhealthful foods and adoption of a sedentary lifestyle.6 ,14 ,33 ,34 Building on previous reports on the high prevalence of metabolic risk factors in this region,6 ,35–39 our study demonstrates the high CMD mortality due to these risk factors in all countries of the region and highlights the need for adoption and implementation of effective interventions to reduce the burden of these risk factors. Our analysis also quantified the contribution of diet (ie, SSBs and sodium) to the burden of metabolic risk factors and highlighted the gap in knowledge about the contribution of other factors to the CMD burden of metabolic risk factors.
Suboptimal diet is driven by a range of factors acting at the individual level (eg, education, income and nutritional knowledge), community level (eg, accessibility to supermarket, and food availability at local stores) and national level (eg, food and agricultural policies, food marketing).40 As will be discussed further below, the relative influence of each of these determinants varies across individual dietary factors. For example, the FAO food balance sheet data show that availability is a major barrier to the adequate intake of fruits in this region.36 Although the per capita availability of fruits has increased in the high and upper middle income countries of the region, it has decreased in the lower-middle income countries of the region.36 Furthermore, the amount of fruit available per person (∼200 g/day) is still below the recommended level in most countries.41 This is partly due to a lack of natural resources (eg, water and fertile soil) which makes most countries of the region food insufficient.38 ,41 However, some countries such as Jordan have been able to increase fruit production by adopting targeted agricultural policies.42 Furthermore, our consumption data show that the true intake of fruits (∼125 g/day) is much lower than the amount available per person. This highlights the need for interventions to improve the accessibility and affordability of fruits in the countries of the region. Like fruits, although the per capita availability of seafood has increased in most countries of the region over the past two decades, the amount available per person is still low, particularly in the lower-middle income countries.36 ,41 The FAO Globefish Highlights report shows that fisheries and aquaculture production is relatively underdeveloped in the countries of the region, making them dependent on and vulnerable to the global seafood market. In contrast to fruits and seafood, low intake of whole grains seems to be driven by factors other than availability. While the per capita availability of cereal has increased in most countries of the region over the past two decades, the proportion of total energy derived from cereals has decreased in the countries of the region.36 Furthermore, the increase in the cereal consumption is mainly driven by the increased level of refined grains.41 A recent review on drivers of nutrition transition in this region suggests that changes in food environment (eg, increased availability of fast food restaurants and aggressive food marketing), food price and lifestyle (eg, higher participation of women in the workforce) which resulted from urbanisation, modernisation and economic development are the most important factors that contributed to this shift.41
The WHO has recommended nine voluntary targets for global non-communicable disease (NCD) prevention and 25 indicators for monitoring the countries’ progress towards these targets.43 While in this study we showed that suboptimal diet is the leading risk factor for CMD morality in most countries of the region, the WHO recommendations only include one dietary target (30% reduction in sodium intake) and five dietary indicators (intake of fruits and vegetables, sodium and SFAs and two dietary policy indicators including restricting marketing of unhealthy products to children and trans fat regulation).43 Furthermore, most countries of the region have not adopted the basic national policies recommended by the WHO.44 This clearly highlights the gap in the WHO dietary recommendations for prevention of NCDs in this region and underlines the urgent need for revision of these recommendations. On the basis of our findings, attention to dietary factors should be expanded beyond the fruits and vegetables sodium and saturated fat to other dietary factors (eg, whole grains, seafood ω-3 fats and nuts). Furthermore, considering the difference in burden of dietary risk factors across the countries, the priority setting for dietary interventions should be nation specific.
Our analysis has several strengths. We focused on nation-specific impacts of dietary and metabolic risk factors on CMD informing national priorities for prevention strategies. We obtained and used the most updated aetiological effect sizes of diet–disease relationships. We assessed the sensitivity of our results to various assumptions about the optimal distribution of dietary and metabolic risk factors by taking into account evidence from epidemiological studies and the feasibility of achieving the optimal distribution at the population level. We accounted for heterogeneity in the current level of risk factors, effect of risk factors on CMD mortality, and current cause-specific mortality by country, age, sex and time.
Potential limitations should also be considered in the interpretation of our findings. Dietary data were from mixed sources including nationally representative individual-level nutrition surveys and FAO food balance sheets. As with all measures, assessment methods for diet were not perfect. Also, nutrition data for five countries (ie, Afghanistan, Bahrain, Iraq, Oman and Qatar) were imputed based on the regional mean in each age-sex group and country-specific covariates. Each of these issues increases the statistical uncertainty in dietary measurements. The major advantage of our study is that we incorporated these sources of uncertainty into our analysis and quantified the overall UI for the mortality estimates. We used RRs from meta-analyses of the observational studies that had adjusted for major confounders; however, the possibility of residual confounding cannot be excluded. In particular, correlation among diet factors may affect our estimated aetiological effect for individual dietary factors. To examine the magnitude of the residual confounding due to correlation of dietary factors, we performed three sensitivity analyses. First, using our estimated aetiological effects of each individual dietary factor, we computed the RR for combinations of dietary factors and compared that with the RRs observed in prospective cohort studies evaluating associations of overall dietary patterns with incident CVD events. Second, we compared our estimated RR with the RR estimated from three randomised controlled feeding trials evaluating effects of overall dietary patterns on CVD risk factors (ie, DASH, DASH-sodium and OmniHeart).28 ,29 ,45 Third, we compared our estimated RR with the RR from the PREDIMED trial, a large randomised clinical trial evaluating effects of an overall dietary pattern on the incidence of CVD.46 These sensitivity analyses demonstrated that our estimated RRs corresponded very closely to the observed RRs, confirming that our RRs are not substantially affected by correlation of dietary factors.21 We used the joint population attributable fraction to estimate the number of CMD deaths attributable to the combined effect of dietary factors and assumed that the intakes of individual dietary factors were independent within each country-age-sex group. This could overestimate the CMD burden of suboptimal diet. On the other hand, the CMD burden of suboptimal diet might be underestimated in this study due to measurement error and adjustment for potential mediators (eg, blood pressure, BMI, blood lipids). In addition, we focused on CMD mortality, while dietary and metabolic risk factors would increase the risk of specific cancers as well. Thus, our estimates might be a conservative estimate of the burden of disease due to these risk factors at the regional or country level.
In summary, we found that metabolic and dietary risk factors were major contributors to CMD mortality in countries of the Middle East and North Africa; however, their relative importance varied across countries. Our findings inform the need for adoption, implementation and evaluation of evidence-based national government policies to improve diet and prevent CMD in countries of the region.
Acknowledgments
The authors would like to thank the Institute of Health Metrics and Evaluation at the University of Washington for providing the cause-specific mortality estimates.
References
Supplementary materials
Supplementary Data
This web only file has been produced by the BMJ Publishing Group from an electronic file supplied by the author(s) and has not been edited for content.
- Data supplement 1 - Online figures
- Data supplement 2 - Online tables
Footnotes
Contributors AA, RM, SK, SF, JP, ME and DM conceptualised the idea of the study. RM, SK, PS, SF. MA, SA-H, FF, AH-r, NH, EK, AM, GP, AMS, SZ and GD were involved in exposure data collection; AA, RM, SK, MYY, SF, JP, GS, GD, ME and DM collected other inputs for analysis such as aetiological effects and optimal risk factor levels; AA, GS and MYY conducted the analyses for the study. GD, JP, ME and DM were the faculty guiding and reviewing the overall process. All authors have read the final manuscript, reviewed it and approve of it for submission. AA and DM are the guarantor of the honesty, integrity and authenticity of the work.
Funding AA was supported by a National Heart, Lung, and Blood institute Cardiovascular Epidemiology Training Grant in Behavior, the Environment, and Global Health (grant number T32 HL098048) and a Graduate Fellowship Award from Harvard Global Health Institute. GMS was supported by the T-32 training grant in Academic Nutrition (grant number DK 007703) from the National Institute of Diabetes and Digestive and Kidney Diseases. SK, PS and DM were supported by the grant from Bill & Melinda Gates Foundation, The Global Dietary Database—Global Dietary Intakes, Diseases, and Policies among Children, Women, and Men (grant number OPP 1099505, PI: Dr Mozaffarian). MYY was supported by the Lown Cardiovascular Research Foundation Scholarship and the Founders Affiliate American Heart Association Pre-Doctoral Training Fellowship. Mortality estimates for this work were provided by the Institute of Health Metrics and Evaluation, supported by another grant from the Bill & Melinda Gates Foundation.
Competing interests “All authors have completed the Unified Competing Interests form at http://www.icmje.org/coi_disclosure.pdf (available on request from the corresponding author) and declare that (1) all authors have support from their employment institutions for the submitted work; (2) any relationships of relevant authors with funding agencies in the previous 3 years have been mentioned in the ‘Conflicts of Interest’ section at the end of the manuscript; (3) spouses, partners, or children of none of the authors had any financial relationships that may be relevant to the submitted work; and (4) none of the authors had any non-financial interests that may be relevant to the submitted work.” The authors functioned independently of the funders. All authors had full access to all the data (including statistical reports and tables) in the study and can take responsibility for the integrity of the data and the accuracy of the data analysis. The lead author (AA), who is also the manuscript's guarantor, affirms that the manuscript is an honest, accurate and transparent account of the study being reported; that no important aspects of the study have been omitted; and that any discrepancies from the study as planned have been explained. DM reports ad hoc travel reimbursement or honoraria from Bunge, Pollock Institute, Quaker Oats and Life Sciences Research Organization; ad hoc consulting fees from McKinsey Health Systems Institute, Foodminds, Nutrition Impact, Amarin, Omthera and Winston and Strawn LLP; membership, Unilever North America Scientific Advisory Board; royalties from UpToDate; and research grants from GlaxoSmithKline, Sigma Tau, Pronova, the Gates Foundation, the Sackler Institute of Nutrition, and the National Institutes of Health.
Ethics approval We obtained permission to use unpublished dietary data from corresponding experts in each country who provided us with the data.
Provenance and peer review Not commissioned; externally peer reviewed.
Data sharing statement No additional data are available.