Article Text

Abstract
Objectives Empirical studies of the association between neighbourhood food environments and individual obesity risk have found mixed results. One possible cause of these mixed findings is the variation in neighbourhood geographic scale used. The purpose of this paper was to examine how various neighbourhood geographic scales affected the estimated relationship between food environments and obesity risk.
Design Cross-sectional secondary data analysis.
Setting Salt Lake County, Utah, USA.
Participants 403 305 Salt Lake County adults 25–64 in the Utah driver license database between 1995 and 2008.
Analysis Utah driver license data were geo-linked to 2000 US Census data and Dun & Bradstreet business data. Food outlets were classified into the categories of large grocery stores, convenience stores, limited-service restaurants and full-service restaurants, and measured at four neighbourhood geographic scales: Census block group, Census tract, ZIP code and a 1 km buffer around the resident's house. These measures were regressed on individual obesity status using multilevel random intercept regressions.
Outcome Obesity.
Results Food environment was important for obesity but the scale of the relevant neighbourhood differs for different type of outlets: large grocery stores were not significant at all four geographic scales, limited-service restaurants at the medium-to-large scale (Census tract or larger) and convenience stores and full-service restaurants at the smallest scale (Census tract or smaller).
Conclusions The choice of neighbourhood geographic scale can affect the estimated significance of the association between neighbourhood food environments and individual obesity risk. However, variations in geographic scale alone do not explain the mixed findings in the literature. If researchers are constrained to use one geographic scale with multiple categories of food outlets, using Census tract or 1 km buffer as the neighbourhood geographic unit is likely to allow researchers to detect most significant relationships.
- PREVENTIVE MEDICINE
- PUBLIC HEALTH
- SOCIAL MEDICINE
This is an Open Access article distributed in accordance with the Creative Commons Attribution Non Commercial (CC BY-NC 4.0) license, which permits others to distribute, remix, adapt, build upon this work non-commercially, and license their derivative works on different terms, provided the original work is properly cited and the use is non-commercial. See: http://creativecommons.org/licenses/by-nc/4.0/
Statistics from Altmetric.com
Strengths and limitations of this study
-
Our study applies four neighbourhood geographic scales utilising the Utah driver license data, which allows us to detect the role of geographic scale in the relationship between obesity and neighbourhood food environment.
-
Our study provides evidence that the significance of the association between obesity and neighbourhood food environment depends on the neighbourhood geographic scale used and the specific element of the food environment that is in question. If the relevant neighbourhood is defined too large (ie, larger than Census tract for convenience stores and full-service restaurants) or too small (ie, smaller than Census tract for limited-service restaurants), then the statistical relationship is insignificant.
-
The most important limitation of our study is the cross-sectional nature of our data, which prevents us from inferring causal relationships between elements of the neighbourhood food environment and obesity.
-
Another important limitation is that we used self-reported weight and height data, which could systematically underestimate true obesity status. However, as long as such self-reporting bias is not geographically patterned, the multivariate results should not be affected.
Background
The growing obesity epidemic in the USA1 ,2 has motivated policymakers and researchers to search for modifiable factors that may be linked to individual weight. One of the modifiable factors is the neighbourhood food environment. The neighbourhood food environment involves the “number, type, location, and accessibility of food outlets in a location,”3 with food outlets predominantly including stores (supermarkets, grocery stores and convenience stores) and restaurants (full-service and limited-service, including fast food). Early research suggested that diet quality can be improved, and unhealthy weight gain can be prevented through better access to supermarkets and large grocery stores and reduced exposure to limited-service restaurants and convenience stores.4–6 As a result, public policy efforts to reduce obesity have targeted the food environment as an important area for intervention. For example, in 2008 the City of Los Angeles passed a bill to ban the opening of any fast food restaurants in the poor neighbourhoods in the city.7 The White House Childhood Obesity Task Force proposed that communities increase the number of supermarkets in order to reduce childhood obesity.8 However, as more research has become available based on different study locations using diverse data sources, measurements and analytical methods, the relationship between neighbourhood food environment and obesity has been challenged. While some studies have supported earlier findings,9 ,10 others have found null or even opposite relationships.11 ,12 Inconsistencies in study results are not surprising given the variations in neighbourhood food environment measures, study locations, data sources, analytical methods and controls for confounding factors.
One important potential contributor to mixed findings is the geographic scale of the neighbourhood used in studies. Geographic scale can influence the observed relationship between neighbourhood context and individuals’ health outcomes,13 which is an example of the well-known modifiable areal unit problem (MAUP) associated with the use of geographically aggregated data.14 ,15 Finding appropriate and consistent criteria for defining geographic boundaries of a neighbourhood can be challenging because the appropriate definitions of neighbourhood probably differ across places, environmental factors and outcomes being studied. For example, large grocery stores are likely to draw patrons from a larger geographic area than convenience stores so the aggregation level appropriate for large grocery stores might not be suitable for convenience stores.
The scale of US neighbourhood in the food environment literature has varied considerably, from Census block group,16 ,17 Census tract,18 ,19 ZIP code6 to state.20 When a buffer method was used, there was a wide range of buffer distances, ranging from 100 m21 to 5 km,22 with two studies examining multiple distances for what is considered walkable (eg, 500 m and 1 km) to needing transportation (eg, 2 and 5 km).22 ,23 Several recent studies also used store density within a defined geographic area per 100 000 people as the geographic measure of interest.24 ,25
In this study we examined how four geographic scales of neighbourhood food environment might affect the direction, size and significance of the relationship between neighbourhood retail food establishments and individual obesity risk using population and business data in Salt Lake County, Utah. Three of these four were area measures: Census block group, Census tract and ZIP code; and the fourth was a buffer measure, which was a 1 km buffer around an individual's residence. The 1 km buffer was chosen because of its proven usefulness in past build environment-related research and its compatibility with our intersection density measure.22 ,26 Because the relevant geographic scale is likely to vary by outlet type, we included four types of food retail outlets: large grocery stores, convenience stores, limited-service restaurants and full-service restaurants. We related these various measures of the neighbourhood food environment to individual obesity risk while controlling for other individual and neighbourhood factors in an attempt to understand the role of geographic scale in the estimated relationship between neighbourhood food environment and individual obesity risk.
Methods
Our study area was Salt Lake County, the county with the largest population in the state of Utah. Individual height and weight and demographic data were taken from the Utah Population Database (UPDB),27 which contains driver license data from the Utah Driver License Division (DLD) going back to 1985. Individual DLD information is updated at the time of a license renewal every 5 years and when a person moves. The UPDB staff linked driver license data (residential location, height, weight, gender and age) to other data via Universal Transverse Mercator (UTM) coordinates. All other personal information from the DLD was removed before the data were provided to the investigators to protect the confidentiality of the individuals.
We excluded young adults (younger than 25) who had likely not established their postadolescence residence. We also excluded elderly adults (older than 64) whose body mass indices (BMIs) were likely to have more complex associations with health conditions.28 In addition, we excluded residents who lived in sparsely settled fringe areas of Salt Lake County where the physical environment was mountainous and very different from the urban setting. Because the DLD data had multiple records for many drivers, we selected the DLD record closest to year 2000 to synchronise with the 2000 Census for any given individual. From the driver license data, self-reported height and weight information were converted to BMI (which is (weight in kg)/(height in m)2), with obesity defined as having a BMI ≥30. BMI data obtained from driver licenses have the advantage of extensive coverage but the potential limitation of self-report bias, although there was no reason to suspect that such self-report bias would be geographically patterned. With these restrictions in place, the resulting sample size comprised of 403 305 individuals. According to the US Census, Salt Lake County had 436 438 persons aged 25–64 in 2000 so our sample had about 92.4% of the age-eligible Salt Lake County population.29
UPDB data were linked to the 2000 US Census30 data that measured neighbourhood demographic, socioeconomic and walkability characteristics at the Census block group, Census tract and ZIP code levels. Demographic and socioeconomic control variables included median neighbourhood income, distinct percentages of blacks, Hispanics, Asians and Hawaiians/Pacific Islanders, and median age of residents. Walkability measures included population density, intersection density derived from a 1 km network buffer from the US Census TIGER/Line file,31 and median age of neighbourhood housing because older neighbourhoods have typically been designed with more walkable features such as tree-shaded sidewalks, narrow streets and mixed land use.17 ,32–34 Combined, these latter measures captured neighbourhood population density, land use diversity and pedestrian-friendly design, the ‘3Ds’ of walkability.35
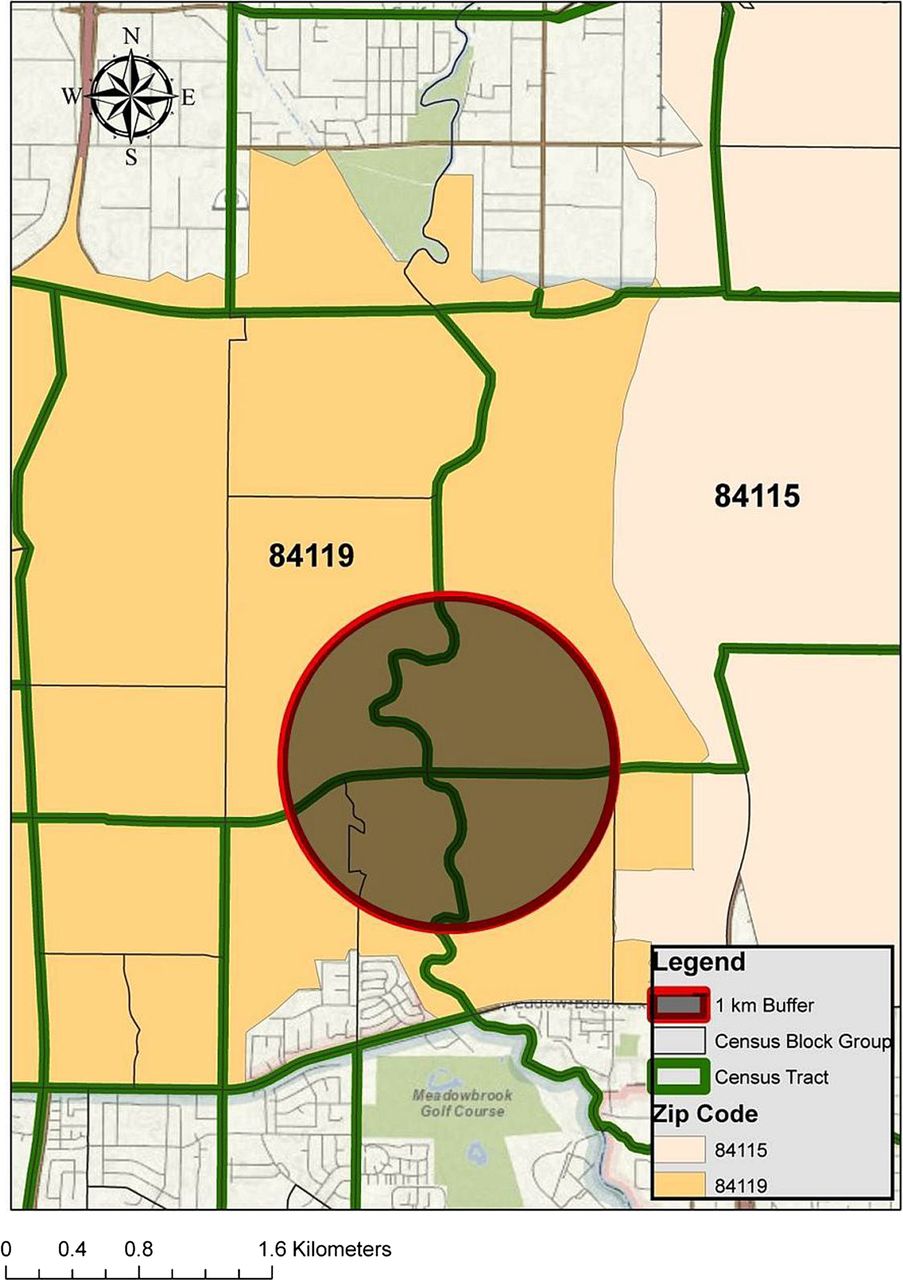
Data on neighbourhood food environments came from the 2000 Dun & Bradstreet files36 and were linked to DLD and Census data through geocoding. Businesses with food-related Standard Industrial Classification (SIC) codes were selected and grouped into four categories: (1) large grocery stores, including general grocery stores, supermarkets, independent and chain grocery stores and fish and vegetable markets, (2) convenience stores, including both chain and independent convenience stores, and drug stores, (3) limited-service food restaurants, including drive-in restaurants, chain and independent fast food restaurants, and pizza restaurants and (4) full-service restaurants, including various American and ethnic restaurants, grills, cafeteria, seafood, steak, barbeque restaurants and buffets. Businesses within each category were aggregated for four geographic units: (1) Census block group, (2) Census tract, (3) ZIP code and (4) a 1 km buffer measure around each individual's home. In total, there were 550 Census block groups, 190 Census tracts and 32 ZIP codes included in our sample. Figure 1 illustrates an example of the relative size of Census block groups, Census tracts, ZIP codes and a 1 km buffer in Salt Lake County, Utah.
An example of the relative size of Census block groups, tracts, ZIP codes and 1 km buffer in Salt Lake County, Utah.
Multilevel regression models were estimated to investigate how associations between neighbourhood food environments and individual obesity risk varied across different geographic scales of the neighbourhood. All four retail outlet types were included in each model at each scale. Random intercept models with two levels were estimated: person level and neighbourhood level, with the neighbourhood level being Census block group, tract and ZIP code, respectively. For the 1 km buffer model, Census block group was defined as the neighbourhood for the control variables because the average area size for Census block groups was the closest to a 1 km buffer area. Control variables based on past studies17 ,34 included individual age, median household income and the percentages of African-Americans, Hispanics, Asians and Hawaiians/Pacific Islanders measured at the relevant neighbourhood scale. Walkability measures included intersection density for a 1 km buffer around residents’ addresses, population density and median housing age at block group, tract and ZIP code levels. Each model was estimated for men and women separately.34 ,37 Analyses were conducted in SAS V.9.2 (Proc Glimmix). Collinearity diagnostics revealed no problematic multicollinearity among the independent variables. Using the tract-level model as an example, the highest variance inflation factor (VIF) was 2.57 for per cent of Hispanics in the neighbourhoods, and the highest condition index was 3.58, well within the acceptable range for multicollinearity diagnosis. For the four food outlet variables, the VIF ranged from 1.17 for healthy grocery stores to 2.57 for full-service restaurants.
Results
Descriptive statistics for individual obesity status and control variables are shown in table 1. The estimated obesity rate was 17.16% for adults 25–64 in Salt Lake County around year 2000, with 18.28% for men and 15.94% for women. This is in line with obesity rate estimates of between 15% and 19% for Utah from the 2001 Behavioral Risk Factor Surveillance System (BRFSS).38 Neighbourhood statistics at the Census tract level are presented while statistics at other geographic scales are available from the authors on request. Table 2 presents average sizes of each definition of the neighbourhood and population-weighted mean counts and SDs of retail food outlets. On average, Census block group was the smallest geographic unit with the least number of food outlets in all four categories, followed by Census tract, 1 km buffer and ZIP code. Regardless of the geographic scale, the number of full-service restaurants was the highest among all four food outlet categories, followed by limited-service restaurants and convenience stores. For every grocery store, there were approximately 7.5 full-service restaurants, 2.5 limited-service restaurants and 2 convenience stores. Correlation coefficients between food environment measures at different geographic scales ranged from a low of 0.15 for convenience stores measured at the Census tract and ZIP code levels to a high of 0.64 for full-service restaurants measured at the Census block group and Census tract levels (not shown in tables but available from the authors on request).
Descriptive statistics for the sample: individual and tract-level statistics
Counts of food outlets by geographic scale: means and SD
Table 3 presents the estimated OR, 95% confidence limits, and p values for the various measures of the food environment as they relate to individual obesity risk, controlling for the list of covariates discussed earlier. On the one hand, if Salt Lake County was considered the study population, then our study covered almost all the population, making sampling testing statistics such as p values irrelevant. On the other hand, if Salt Lake County was considered a sample representing a larger population (eg, US population residing in similar-sized urban areas), then with such a large sample size, p values can quickly approach zero and as such have a tendency to reject the null.39 With this understanding, we note effect sizes, 95% confidence limits and p values as suggested by Lin et al.39
OR estimates of multilevel logistic regression analyses for individual obesity risk*
Large grocery stores: Table 3 shows that for large grocery stores, the point estimates for the ORs ranged from 0.999 (1 km buffer for men) to 0.966 (block group for women), indicating a beneficial role of large grocery stores in reducing individual obesity risk. For the three area measures, 95% CI narrowed as the size of area increased, with ZIP code level having the narrowest CI and the lowest p value for both genders. However, none of the OR had a p value less than 0.05, indicating statistical insignificance of these associations using conventional sampling statistics.
Convenience stores: For convenience stores, the point estimates for the ORs ranged from 0.986 (ZIP code for women) to 0.957 (block group for men), indicating that larger neighbourhood counts of convenience stores were associated with a lower individual obesity risk. For the three area measures, the effect size decreased but the 95% CI also narrowed as the geographic area size increased. This protective effect existed for both men and women when neighbourhood geographic scale was the Census tract or 1 km buffer. In addition, the association was significant at the Census block group level for men.
Limited-service restaurants: For limited-service restaurants, the point estimates for the ORs ranged from 1.015 (ZIP code for men) to 1.032 (block group for women), indicating that greater neighbourhood counts of limited-service restaurants were associated with a higher individual obesity risk. For the three area measures, the effect size was the largest at the tract level for men and at the block group level for women. The 95% CI narrowed as the size of the area increased. This detrimental relationship was statistically significant at the Census tract, ZIP code and 1 km buffer levels, but not the Census block group level.
Full-service restaurants: For full-service restaurants, the point estimates for the ORs ranged from 0.998 (ZIP code for men) to 0.984 (tract for women), indicating that greater neighbourhood counts of full-service restaurants were associated with a lower individual risk of obesity. For the three area measures, the larger the area size, the smaller the effect for men. However, for women, the effect was the largest at the tract level. Regardless of the effect size, the 95% CI narrowed as area size increased. This protective relationship was statistically significant for both genders at the Census tract or 1 km buffer levels, but not the ZIP code level. In addition, the relationship was statistically significant for men at the block group level.
For the control variables, the multilevel logistic regression coefficients were in general agreement across different models so only the tract-level results are presented in table 4. Estimates at other geographic scales are available from the authors on request. Older individual age was associated with an increased obesity risk. The neighbourhood socioeconomic and demographic variables were also consistently associated with individual obesity risk. Higher median neighbourhood income was associated with a lower individual obesity risk. Having higher percentages of Hawaii-Pacific islanders and Hispanics in the neighbourhood were associated with a higher individual risk of obesity while having higher percentages of African-Americans (men only) and Asians in the neighbourhood were associated with a lower individual risk of obesity. Because we did not have individual race/ethnicity data, it was likely that at least some of these neighbourhood racial/ethnic effects were artefacts of individual racial/ethnic effects. For neighbourhood physical environment variables, a higher population density and older housing stock in the neighbourhood were both associated with a lower individual risk of obesity, while a higher intersection density in the neighbourhood was associated with a higher individual risk of obesity.
OR for control variables: tract-level estimates
Discussion
The purpose of this study was to investigate the role of geographic scale on the relationship between neighbourhood food environments and individual obesity risk. Our results show that the relationship between obesity risk and different types of food outlets was significant at different levels of geographic scale. Large grocery stores were not statistically significantly associated with individual risk of obesity at all four geographic scales, although the protective effect had a p value of 0.081 for men at the ZIP code level. It is possible that a geographic scale larger than the ZIP code is needed to detect significant relationships between large grocery stores and obesity risk as people often travel substantial distances when doing major grocery shopping. Limited-service restaurants were detrimental at medium levels of geographic scale of our analysis (Census tract or larger, or 1 km buffer). Convenience stores and full-service restaurants were protective at the smallest geographic scale (Census tract or smaller, or 1 km buffer). Table 5 summarises these findings for the four types of food outlets by gender. Although geographic scale affected the significance level and the size of the coefficients, the directions of the coefficients were remarkably consistent across geographic scales and across gender. More counts of large grocery stores, convenience stores and full-service restaurants were protective of individual obesity risk, while more counts of limited-service restaurants were detrimental to individual obesity risk. We also observed that for the three area measures, with the exception of limited-service restaurants, the estimated size of the effect decreased when the neighbourhood geographic scale increased, regardless of the statistical significance of the estimate.
Area of statistical significance (p value <0.05) for different types of food outlets by gender: multivariate results
Our findings provide evidence that neighbourhood geographic scale could be a contributing factor in explaining the inconsistent findings of the association between neighbourhood food environment and individual obesity risk in the literature. However, it is important to note that contradictory findings from past studies could not always be explained away by differences in neighbourhood geographic scale alone. For example, although some past findings were consistent with ours for the level of geographic scale used, such as a ZIP code level analysis for large grocery stores6 and a Census block group level analysis for fast food restaurants,18 other findings disagreed with our results for the level of geographic scale used, such as two significant findings for large grocery stores using Census tract.18 ,19 It should be noted that neighbourhood geographic scale is only one consideration in understanding the relationship between neighbourhood food environments and individual obesity risk. Past studies varied in several other aspects such as the food outlet definition and classification, inclusion or exclusion of multiple types of food outlets and food outlet data sources. Future research should investigate the role of these other aspects of neighbourhood food environments in the estimated association between neighbourhood food environments and individual obesity risk in order to better understand the complexity of the associations.
The negative association between the number of convenience stores in the neighbourhood and individual obesity risk is contradictory to much of the existing literature, with the exception of Zick et al17 using Census block group as the geographic scale. Aside from possible regional differences in what kind of food convenience stores might carry, Zick et al17 argued that neighbourhood convenience stores could increase an individual's energy output if residents walked to these facilities rather than driving to them. In any event, differences in geographic scale could not explain the differences in our finding and previous findings regarding convenience stores as past studies have used variaous geographic scales with mixed results.11 ,18 ,19 ,40
Most of our control variables have associations with obesity risk that are consistent with past research.41 However, the finding that higher street intersection density was linked to higher obesity risk is counter to much of the exisiting literature but consistent with other studies using Salt Lake County data.17 ,26 ,34 It may be that greater street connectivity reflects greater car traffic, which could discourage individuals from walking or biking. However, it could also be realted to Salt Lake County having unusually wide streets and large street blocks that may discourage walking even when street connectivity is high.17 ,42 In addition, an increase in the proportion of African-Americans in the neighbourhood was related to lower odds of obesity, which is counter to the picture provided by national statistics.43 In the 2000 Census for Utah, African-Americans constituted fewer than 1% of the residents and had somewhat higher incomes than their national counterparts.44 As such, our results may not generalise to neighbourhoods in other parts of the country that have higher concentration of black residents with lower income.
In empirical research addressing the relationship between neighbourhood environments and obesity risk, researchers often have to choose one neighbourhood geographic scale instead of having the luxury of varying geographic scales by food outlet type. Our findings suggest that if the research focus is on large grocery stores, a geographic scale larger than the ZIP code may be needed to allow researchers to detect potential significant relationships. If a buffer method is used, a buffer radius of more than 1 km should be considered. On the other hand, if limited-service restaurants is the focus, then using Census tract (or larger) would be more effective in identifying relationships. If convenience stores and full-service restaurants are the focus, then using Census tract or Census block group would be better. If all four types of outlets are investigated, then our results suggest that Census tract may be better than either Census block group or ZIP code in terms of reaching a compromise among various outlet types. Using Census tract as the neighbourhood geographic scale was also recommended by Krieger et al,45 who found that tract-level analyses most consistently indicated associations between neighbourhood socioeconomic characteristics and residents’ health. The 1 km buffer measure performs as well as the Census tract measure but requires knowledge of individuals’ addresses and is much more computationally intensive.
Regardless of the geographic scale, the fairly consistent results for the direction of associations between individual obesity risk and counts of large grocery stores, convenience stores, limited-service restaurants and full-service restaurants across multiple geographic scales lend support to the validity of these relationships, although the particular geographic scale used can lead to different effect sizes and different levels of statistical significance.
We temper our findings with several caveats. First, as with most studies of neighbourhood characteristics, our results are subject to questions about causal inference. If non-random residential selection exists, the magnitude of our food environment estimates could be misstated.46 Second, self-reported height and weight can systematically underestimate true obesity status. But, as long as such self-reporting bias is not geographically patterned, the multivariate results should not be affected. Third, commercial business directories such as the D&B are subject to significant error rates in listing and in classification.47–49 Fourth, availability and price of foods can vary dramatically within a store type, and as such, food store typologies can be limited in capturing the impact of food environment on consumer decisions regarding food consumption (Rose D, Bodor N, Swalm C, et al. Understanding the economic concepts and characteristics of food access. Washington DC, 2009).22 Fifth, demographic data at the individual level were limited, leading to the potential for spurious correlations due to insufficient control of individual-level variables. Sixth, we did not include some potentially more precise Geographic Information System (GIS) measures of the neighbourhood food environment such as network distance to the nearest or primary food outlet.50 While this latter measure is more precise, it requires significant computational time and research costs to construct and any data errors could lead to accuracy problems whereas area measures are more forgiving of such data errors.
Our paper contributes to the literature by providing insights into the role of neighbourhood geographic scale in the relationship between food environments and individual obesity risk. The utilisation of driver license records has the advantage of extensive local coverage with a large sample size, allowing us to test a wide range of definitions of neighbourhood, and to estimate models for men and women separately. Moreover, our findings have policy implications. In recent years, policymakers have begun to argue for novel policies that may alter food environments for residents, such as encouraging the building of new large grocery stores or imposing moratoriums on the building of fast food restaurants in certain neighbourhoods. While such policy efforts may be protective for individual obesity risk, understanding the geographic scale of the neighbourhood is important in identifying the area boundaries and location of these interventions.
Acknowledgments
The authors wish to thank the Huntsman Cancer Foundation for database support provided to the Pedigree and Population Resource of the Huntsman Cancer Institute (HCI), University of Utah. Partial support for all data sets within the UPDB was provided by the University of Utah HCI and the HCI Cancer Centre Support Grant, P30 CA42014 from National Cancer Institute. They also wish to thank Dr Ikuho Yamada and Linda Keiter for their valuable assistance in the construction of our data set, and Dr Diego Rose and Dr Tomoya Hanibuchi for their insightful comments and suggestions.
References
Footnotes
-
Contributors All authors participated in the conception and design of this research project. HH constructed the GIS-based measures that were linked to the data files. JXF estimated the empirical models and wrote the first draft of the manuscript and the revision. CDZ, BBB, LK-J, KRS and HAH provided suggested changes. All authors participated in interpretation of the results and approved the final manuscript.
-
Funding This research was supported by National Institute of Health NIDDK Grant Number 1R21DK080406 and NIDDK ARRA 3R21 DK080406. Open access support was provided by the University of Utah's J. Willard Marriott Library.
-
Competing interests None.
-
Ethics approval University of Utah Institutional Review Board and the Utah Resource for Genetic and Epidemiologic Research.
-
Provenance and peer review Not commissioned; externally peer reviewed.
-
Data sharing statement No additional data available.