Article Text

Abstract
Objective To evaluate the reliability of stroke volume variation (SVV) for predicting responsiveness to fluid therapy in patients undergoing cardiac and thoracic surgery.
Design Systematic review and meta-analysis.
Data sources PubMed, EMBASE, Cochrane Library, Web of Science up to 9 August 2020.
Methods Quality of included studies were assessed with the Quality Assessment of Diagnostic Accuracy Studies-2 tool. We conducted subgroup analysis according to different anaesthesia and surgical methods with Stata V.14.0, Review Manager V.5.3 and R V.3.6.3. We used random-effects model to pool sensitivity, specificity and diagnostic odds ratio with 95% CI. The area under the curve (AUC) of receiver operating characteristic was calculated.
Results Among the 20 relevant studies, 7 were conducted during thoracic surgery, 8 were conducted during cardiac surgery and the remaining 5 were conducted in intensive critical unit (ICU) after cardiac surgery. Data from 854 patients accepting mechanical ventilation were included in our systematic review. The pooled sensitivity and specificity were 0.73 (95% CI: 0.59 to 0.83) and 0.62 (95% CI: 0.46 to 0.76) in the thoracic surgery group, 0.71 (95% CI: 0.65 to 0.77) and 0.76 (95% CI: 0.69 to 0.82) in the cardiac surgery group, 0.85 (95% CI: 0.60 to 0.96) and 0.85 (95% CI: 0.74 to 0.92) in cardiac ICU group. The AUC was 0.73 (95% CI: 0.69 to 0.77), 0.80 (95% CI: 0.77 to 0.83) and 0.88 (95% CI: 0.86 to 0.92), respectively. Results of subgroup of FloTrac/Vigileo system (AUC=0.80, Youden index=0.38) and large tidal volume (AUC=0.81, Youden index=0.48) in thoracic surgery, colloid (AUC=0.85, Youden index=0.55) and postoperation (AUC=0.85, Youden index=0.63) in cardiac surgery, passive leg raising (AUC=0.90, Youden index=0.72) in cardiac ICU were reliable.
Conclusion SVV had good predictive performance in cardiac surgery or ICU after cardiac surgery and had moderate predictive performance in thoracic surgery. Nevertheless, technical and clinical variables may affect the predictive value potentially.
- thoracic surgery
- cardiac surgery
- anaesthesia in cardiology
- anaesthetics
Data availability statement
Data are available in a public, open access repository. Data are available upon reasonable request. All data used in this research was generated from publicly available published manuscripts
This is an open access article distributed in accordance with the Creative Commons Attribution Non Commercial (CC BY-NC 4.0) license, which permits others to distribute, remix, adapt, build upon this work non-commercially, and license their derivative works on different terms, provided the original work is properly cited, appropriate credit is given, any changes made indicated, and the use is non-commercial. See: http://creativecommons.org/licenses/by-nc/4.0/.
Statistics from Altmetric.com
Strengths and limitations of this study
As far as we know, this is the first systematic review and meta-analysis discussing the predicative value of fluid responsiveness of stroke volume variation (SVV) during thoracic and cardiac perioperation.
We assessed the included studies with Quality Assessment of Diagnostic Accuracy Studies-2 tool in Review Manager V.5.3 to ensure their quality.
Three different software (Stata V.14.0, Review Manager V.5.3 and R V.3.6.3) were used to compare the predictive value of SVV between different subgroups.
A limitation was the existence of overall heterogeneity among our included studies.
We did not discuss whether the SVV is suitable for children in thoracic and cardiac surgery due to a lack of relevant studies.
Introduction
Fluid therapy is the most important factor for maintaining a stable internal environment during perioperative period, especially in thoracic and cardiac surgery.1 In recent years, more and more studies have showed that goal-directed fluid therapy (GDFT) can provide individual treatment for patients, preventing perioperative patients from potentially hypervolaemia or hypervolaemia and reducing complications or mortality. According to Frank-Starling’s curve,2 the preload of the ventricle is proportional to the cardiac output (CO) in the raising stage. However, if the preload reaches the platform stage, fluid therapy would not yield the desired effect but result in cardiac overload and tissue oedema.3 4 Therefore, it is urgent to find an effective method of haemodynamics monitoring sensitive to fluid responsiveness.
Anaesthetists previously tended to use traditional haemodynamic indicators to predict fluid responsiveness, such as central venous pressure (CVP), pulmonary artery diastolic pressure (PADP) and cardiac index.5 However, it was of limited utility in reflecting actual ventricular preload, which may be affected by many non-cardiovascular factors. On the other hand, although transoesophageal echocardiography, serving as a gold standard of evaluating cardiac function, has indisputable advantages in monitoring ventricular preload and guiding fluid therapy, its complex manipulations and potential complications prevent it from being widely used in thoracic and cardiac surgery.6 Stroke volume variation (SVV) offers a good middle ground between them, and combine their superiority and security during perioperative period.7
SVV means the variation of stroke volume (SV) in 30 s and was considered a reliable parameter under the condition of closed chest.8 It reflects the effect of respiratory movement on venous return. During inspiration of mechanical ventilation, the increase of intrapulmonary pressure significantly decreases the negative intrapleural pressure, thereby decreasing venous return and CO. During expiration, the opposite changes occur.9 When the body has insufficient circulating blood volume, the variation of SV fluctuates obviously with the switching between inspiratory and expiration. Thus, the fluid responsiveness can be predicted according to SVV, so as to judge the condition of blood volume. Toyoda et al10 reported a curvilinear relationship between the right ventricular end-diastolic volume index (RVEDVI) and SVV. They found the regression curve accorded better with SVV than with CVP or PADP, showing its reliable predictive value of RVEDVI.
Several meta-analysis have synthesised present evidence and evaluated the reliability of SVV in common surgery of children and adults, but there was still no systematic review discussing whether SVV could be applied for thoracic and cardiac surgery. Lots of trials have been conducted to investigate this issue.11–30 Unfortunately, they have not been able to reach a consensus so far. A series of studies proved good reliability of SVV in predicting fluid responsiveness during such surgery.11 16 18 20–22 24 25 27–30 However, some other studies are not convincing due to different anaesthesia and surgical strategy, such as model of mechanical ventilation, position, method of fluid therapy, moment of manoeuvres and so on.12–15 17 19 23 26 Fu et al12 and Suehiro et al17 reported that SVV was not suitable for thoracic surgery when a protection ventilation was conducted. Miñana et al14 found that SVV successfully predicted fluid responsiveness only in thoracoscopy but not thoracotomy. Moreover, Fishcher et al26 reported that SVV also could not give a good performance within the first six postoperative hours in cardiac intensive critical unit (ICU). There seems to be a great deal of debate about which anaesthesia or surgical strategy SVV is more appropriate for in thoracic and cardiac surgery. However, no large-sample study has been conducted to evaluate the utility of SVV in such conditions. The purpose of this meta-analysis was to review relevant literatures and systematically evaluate the predictive value of SVV in thoracic and cardiac surgery, providing evidence and guidance for the clinical application of SVV.
Methods
The meta-analysis was performed according to the Preferred Reporting Items for Systematic Reviews and Meta-Analyses statement issued in 2009.31
Description of investigated indices
SVV is the ratio of the difference between the maximum and the minimum of the SV and the mean of the SV during 30 s as follows: (SVmax– SVmin)/SVmean.
Eligibility criteria
We included diagnostic trials evaluating the accuracy and effectiveness of SVV in predicting fluid responsiveness in the operating room (OR) and ICU. We excluded review articles, commentaries, case reports and research papers in vivo and vitro. In addition, we also excluded studies of which the subjects were pregnant women or patients with spontaneous breathing, sepsis, shock, and arrhythmia.
Search strategy
We searched PubMed, Web of Science, Embase and the Cochrane Library database for relevant literature by using searching terms such as SVV, stroke volume variation, responsiveness and predict. The full search strategy was described in the online supplemental file 1. The initial search was conducted on 9 August 2020 with a language restriction of English.
Supplemental material
Data extraction and quality assessment
Backgrounds and conclusions of the included literatures were screened independently by two authors, following the inclusion and exclusion criteria. Then, the full content was read in detail. Disagreements or discrepancies were resolved by discussion with the third author. The information was extracted from the included studies as follows: study characteristics (last name of the first author, publication year, sample number, operations, fluid therapy, reference standard, position, tidal volume (TV), positive end-expiratory pressure (PEEP), endoscopy and moments of manoeuvers) and outcome indicators (ture positive (TP), false positive (FP), ture negative (TN), false negative (FN), sensitivity, specificity, best cut-off, AUC and correlation coefficient). When there were insufficient or missing data, one author contacted the corresponding author of the included article to obtain the necessary data.
The quality of our included studies was assessed by two authors independently using the Quality Assessment of Diagnostic Accuracy Studies-2 (QUADAS-2) in Review Manager V.5.3 (Cochrane Library, Oxford, UK).32 QUADAS-2 mainly consists of four parts (case selection, trials to be evaluated, gold standard, case process and progress). All components would be assessed in terms of bias risk, and the first three components would also be assessed in terms of clinical risk. In addition, publication bias was also checked using Deeks’ Funnel Plot Asymmetry Test in Stata V.14.0.33 Quality assessment was performed independently by two authors. Disagreements were reconciled through discussion until a consensus was reached.
Statistical treatment and quality assessment
The Stata software V.14.0 was used for basic calculations. Subgroup analysis on primary outcomes stratified by intervention, TV, PEEP, position, endoscopy and moments of manoeuvres was conducted. When the number of included studies within some subgroups was less than four, not meeting the minimum requirements of Stata V.14.0, we used Review Manager V.5.3 and R V.3.6.3 to process data in these subgroups. For comparing the AUC, the Review Manager V.5.3 could only display the summary receiver operating characteristics (SROC) and the R V.3.6.3 could only give the result of mean AUC. The operative performance is graduated as follows:
AUC 0.9–1 excellent operative performance
AUC 0.8–0.9 good operative performance.
AUC 0.7–0.8 moderate operative performance.
We used correlation (mixed model) of Stata to evaluate whether a threshold effect existed. When the correlation was positive and its P value was >0.05, no threshold effect was considered to exist. We then used a random-effects model to calculate pooled sensitivity, specificity and AUC with 95% CI. Statistical heterogeneity was estimated using the Cochrane Q and I2 tests,34 and it was considered to be present when I2 >50% or p<0.05. In such cases, meta-regression analysis and sensitivity analysis were used to determine the sources of heterogeneity.
Patient and public involvement
Patient and public involvement is not applicable for this meta-analysis.
Results
Outcome of literature search and study characteristics
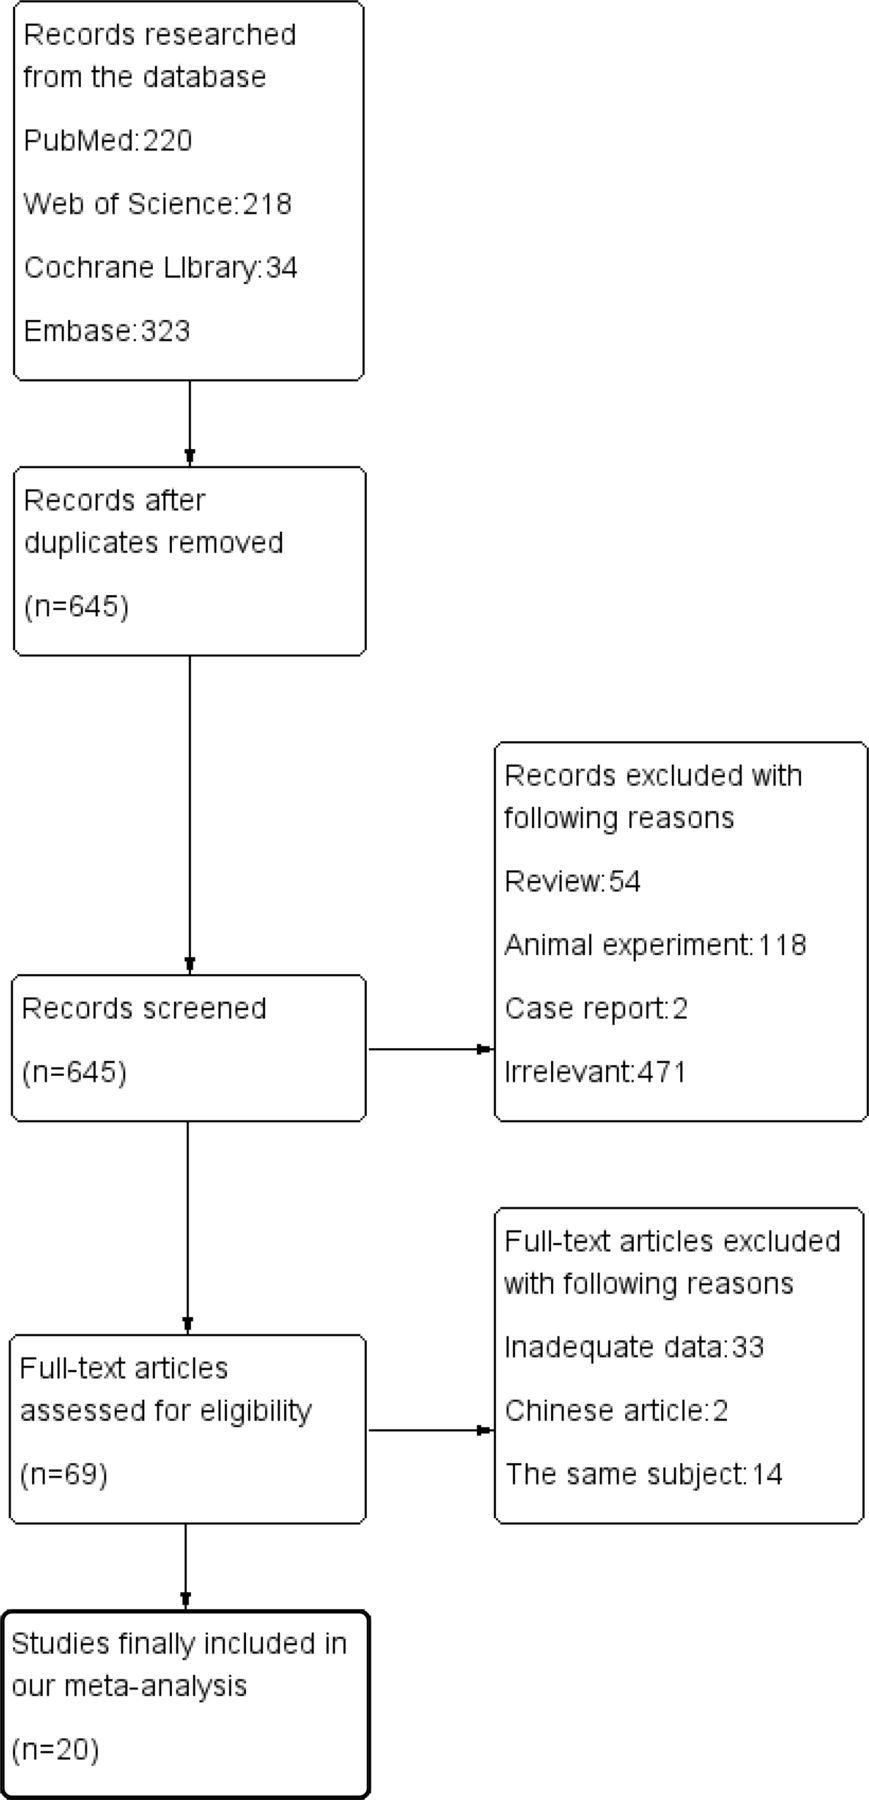
Of the 795 related articles, 645 articles remained after eliminating duplicates. Then, we excluded 576 articles because they were case reports, review articles, articles related to animal experiments or other irrelevant studies. Among the remaining 69 articles, 14 studies repeated the same content, 2 studies were not published in English and data of our interest could not be obtained for 33 articles. Finally, 20 articles were included in our meta-analysis (figure 1).

The search, included and exclusion of the literature.
The 20 articles included 854 patients. The main kinds of monitoring systems were FloTrac/Vigileo system and PiCCO system. Geerts et al28 used pulmonary artery catheter insertion to measure thermodilution CO and CVP. Kang et al29 used Swan-Ganz and NICOM monitors to detect SV and calculate SVV. We defined TV <8 mL/kg as ‘low TV’ and TV ≥8 mL/kg as ‘high TV’; absence of PEEP or PEEP <5 mm Hg was considered non-PEEP. When the infusion volume was set above 5 mL/kg or 250 mL, we considered the study was involve in large bolus group. If not, it was considered a small bolus group. Some patients in the same study accepted fluid challenge with two different systems27 or accepted different methods of TV ventilation.12 17 We included both conditions of these studies in our meta-analysis. The basic characteristics of our included studies are presented in table 1 and online supplemental table 1.
Supplemental material
The characteristics of the included studies.
Assessment of study quality and publication bias
The quality of the 20 included studies was assessed with the QUADAS-2 tool. The result showed most of our included studies were of good quality (figures 2 and 3).

The result of quality assessment of the included articles (overview).

The result of quality assessment of each article.
After using Deeks’ Funnel Plot Asymmetry Test to evaluate publication bias, we found the p value of bias to be 0.870, 0.617 and 0.546 for studies mentioning thoracic surgery, cardiac surgery, and cardiac ICU, indicating that no significant publication bias existed in our included studies.
Results of our meta-analysis
Analysis of the data using the Stata V.14.0, we found the Spearman correlation coefficient of the thoracic surgery, ICU and cardiac surgery groups was −0.43 (p=0.18),–1.0 (p=1.0) and 1.0 (p=1.0), respectively, which indicated that there was a significant threshold effect in the thoracic surgery and ICU groups, but there was no significant threshold effect in the cardiac surgery group.
In the thoracic surgery and ICU groups, the AUC of SROC was 0.73 (95% CI: 0.69 to 0.77) and 0.88 (95% CI: 0.86 to 0.92), respectively. The Cochrane-q value of their AUC was 25.829 (p<0.001, I2=92%) and 15.791 (p<0.001, I2=87%), indicating significant heterogeneity in both groups.
In the cardiac surgery group, the pooled sensitivity was 0.71 (95% CI: 0.65 to 0.77) and the pooled specificity was 0.76 (95% CI: 0.69 to 0.82). The positive likelihood ratio was 3.0 (95% CI: 2.3 to 3.9), the negative likelihood ratio was 0.38 (95% CI: 0.30 to 0.47), and the diagnostic ratio was 8 (95% CI: 5 to 12). The Cochrane-q value of AUC was >−0.001 (p=0.5, I2=95%), indicating significant heterogeneity.
Heterogeneity
Meta regression analysis showed that monitoring devices (p<0.05) in the thoracic surgery group and types (p<0.01) and volume of fluid (p<0.01) in the cardiac surgery group were significant reasons for heterogeneity. There was no significant reason to explain the heterogeneity in the ICU group (p<0. 05).
However, subgroup analysis revealed high heterogeneity (>50%) in all subgroups, which may be attributed to management of surgery and anaesthesia, patient comorbidities, timing of performing fluid challenge, speed of fluid infusion and so on.
Results of sensitivity analysis showed that only in the thoracic surgery group one study15 may contribute to the heterogeneity. Despite excluding this study, the heterogeneity was still significant (I2=63%). Therefore, we concluded that heterogeneity was inevitable and the results were stable.
Comparison between subgroups
The results of our subgroup analysis were shown as follows. When the sample number of subgroups was larger than 4, Stata V.14.0 was used to compare the difference between subgroups. In thoracic surgery, the AUC and Youden index of subgroup of lateral position were 0.71 (95% CI: 0.67 to 0.75) and 0.31. The AUC and Youden index of subgroup of supine position were 0.82 (95% CI: 0.73 to 0.92) and 0.53. The AUC and Youden index of subgroup of colloid were 0.76 (95% CI: 0.72 to 0.79) and 0.36. The AUC and Youden index of subgroup of crystalloid were 0.47 (95% CI: 0.30 to 0.65) and 0.18. The AUC and Youden index of subgroup of large bolus infusion were 0.76 (95% CI: 0.72 to 0.79) and 0.36. The AUC and Youden index of subgroup of small bolus infusion were 0.47 (95% CI: 0.30 to 0.65) and 0.18. The AUC and Youden index of subgroup of large TV were 0.81 (95% CI: 0.77 to 0.84) and 0.48. The AUC and Youden index of subgroup of small TV were 0.67 (95% CI: 0.63 to 0.71) and 0.27. In cardiac surgery, the AUC and Youden index of subgroup of crystalloid were 0.70 (95% CI: 0.47 to 0.92) and 0.25. The AUC and Youden index of subgroup of colloid were 0.85 (95% CI: 0.81 to 0.88) and 0.55.
When the sample number of subgroups was smaller than 4, R V.3.6.3 was used to calculated the pool sensitivity, pool specificity and mean AUC, and Review manager V.5.3 was used to compare the difference between AUC of SROC of subgroups. In thoracic surgery, the mean AUC and Youden index of subgroup of thoracoscopy were 0.73 and 0.38. The mean AUC and Youden index of subgroup of thoracotomy were 0.67 and 0.32. The result of Review Manager V.5.3 showed that AUC of thoracoscopy was larger than that of thoracotomy. The mean AUC and Youden index of subgroup of FloTrac/Vigileo system were 0.80 and 0.38. The mean AUC and Youden index of subgroup of PiCCO system were 0.42 and 0.19. The result of Review Manager V.5.3 showed that AUC of FloTrac/Vigileo system was larger than that of PiCCO system. The mean AUC and Youden index of subgroup of non-PEEP were 0.74 and 0.39. The mean AUC and Youden index of subgroup of PEEP system were 0.67 and 0.33. The result of Review Manager V.5.3 showed that AUC of non-PEEP system was larger than that of PEEP.
In cardiac surgery, the mean AUC and Youden index of subgroup of FloTrac/Vigileo system were 0.73 and 0.46. The mean AUC and Youden index of subgroup of PiCCO system were 0.66 and 0.48. The result of Review Manager V.5.3 showed that AUC of FloTrac/Vigileo system was smaller than that of PiCCO system. The mean AUC and Youden index of subgroup of small bolus infusion were 0.86 and 0.62. The mean AUC and Youden index of subgroup of large bolus infusion were 0.73 and 0.46. The result of Review Manager V.5.3 showed that AUC of small bolus infusion was larger than that of large bolus infusion. The mean AUC and Youden index of subgroup of postoperation were 0.85 and 0.63. The mean AUC and Youden index of subgroup of preoperation were 0.70 and 0.41. The result of Review Manager V.5.3 showed that AUC of postoperation was larger than that of preoperation. The mean AUC and Youden index of subgroup of non-PEEP were 0.77 and 0.53. The mean AUC and Youden index of subgroup of PEEP were 0.67 and 0.47. The result of Review Manager V.5.3 showed that AUC of non-PEEP was larger than that of PEEP. The mean AUC and Youden index of subgroup of fluid challenge were 0.73 and 0.52. The mean AUC and Youden index of subgroup of passive leg raising (PLR) were 0.65 and 0.41. The result of Review Manager V.5.3 showed that AUC of fluid challenge was larger than that of PLR.
In cardiac ICU, the mean AUC and Youden index of subgroup of PLR were 0.90 and 0.72. The mean AUC and Youden index of subgroup of fluid challenge were 0.73 and 0.41. The result of Review Manager V.5.3 showed that AUC of PLR was larger than that of fluid challenge. The details are presented in table 2.
The results of subgroup meta-analysis.
Discussion
Fluid therapy is essential during perioperative period. Unfortunately, it is often ignored and some anaesthesiologists just simply estimated infusion volume based on their experience or conventional indicators. Precise prediction of responsiveness to fluid therapy could greatly reduce the risk of heart failure or tissue oedema. SVV has been proved to have a good performance in various kinds of surgery. However, there was still much contradiction in whether SVV could be applied in thoracic or cardiac surgery.
In this study, we systematically reviewed the relevant literatures about reliable and effectiveness of SVV in above-mentioned surgery. A total of 20 studies were included, involving 854 participants accepting thoracic and cardiac surgery to assess predictive value of SVV. Regarding the quality of included studies, most studies had good description of design and protocol so that the overall quality was rated as medium to high quality.
Previous studies have disputed the diagnostic value of SVV during thoracic and cardiac surgery, mainly due to different anaesthesia or surgical factors, such as ventilation mode, rehydration method, intervention moments, operative position and so on. Our study found that SVV had good predictive performance in monitoring patients accepting cardiac surgery in OR (AUC=0.80) and ICU (AUC=0.89) and moderate predictive performance in patients accepting thoracic surgery (AUC=0.73). In addition, SVV was recommended in the condition of low TV, FloTrac/Vigileo system, non-PEEP, thoaracoscopy, supine, colloid infusion of large bolus during thoracic surgery, condition of FloTrac/Vigileo system, postoperation, non-PEEP, fluid challenge and colloid infusion of small bolus during cardiac surgery, and condition of PLR in cardiac ICU. Next, we would discuss the potential impact of different anaesthesia management or surgical manipulation on the reliability of SVV.
Protective ventilation, defined as low TV, low inhaled oxygen (FiO2), and PEEP, has recently been widely advocated in thoracic surgery with one-lung ventilation (OLV). However, our meta-analysis found that it may negatively affect accuracy of SVV. Ventilation volume rather than airway pressure is the key factor determining pleural pressure and right ventricular preload.35 When TV decreased, the Frank-Starling curve of the left ventricle markedly moved to the right, making the variation in systolic pressure insignificant. Low TV would not cause significant variation in SV especially in the condition of hypovolaemia.17 Alvarado et al36 found that low PEEP (0–10 mm Hg) had no significant effect on cardiac preload due to release of most pressure generated from the ventilator to the atmosphere,16 whereas high PEEP (10–15 mm Hg) would mistakenly make SVV predict actual blood volume.37 This phenomenon would become more evident in OLV, in agreement with our result. However, another study reported an opposite conclusion that SVV is not affected by PEEP or driving pressures,36 which may be explained by the difference between OLV and normal ventilation. This suggests that the effect of respiratory pressure and TV on SVV depends primarily on the degree to which these variables transmitted to the pulmonary circulation, rather than absolute value. As far as our results were concerned, high TV without PEEP may be better recommended in thoracic surgery when SVV monitoring. This may also be the reason for the high accuracy of SVV in perioperative patients with cardiac surgery, because all patients received normal mechanical ventilation with 8 mL/kg TV and non-PEEP. However, it cannot be ignored that the use of non-protective ventilation during period of OLV may cause damage to the healthy lung. In total, the applicability of SVV in thoracic surgery is fair and limited.
We found that fluid therapy with large bolus had better reliability of SVV in thoracic surgery, whereas small bolus fluid therapy was more recommended in cardiac surgery. Patients undergoing cardiac surgery usually have cardiac dysfunction, not tolerating a large bolus during a short period, whereas in thoracic surgery patients often experience heavy bleeding and need large bolus of colloid to maintain body blood volume. Regarding the type of fluid, the colloid rather than crystalloid could quickly compensate for fluid loss to achieve satisfactory CO8 and significantly increase RVEDVI.38 Ma et al39 found that PLR could replace fluid challenge as a more effective intervention in protection of patients under ventilation during cardiac surgery. By transfer of approximately 300 mL of venous blood from the lower body towards the right heart, PLR can mimic a fluid challenge and increase systemic filling pressure without influencing vascular resistance. However, our result showed that fluid challenge has larger AUC than PLR in cardiac surgery, and PLR was more suitable for patients in ICU, especially those with cardiovascular dysfunction.29 Precious systematic review has showed that the change of CO and pulse press induced by PLR can reliably predict the response of CO to volume expansion in adult patients with acute circulatory failure. The preload of right and left ventricles was increased to a sufficient extent to induce fluid responsiveness, having the same effect as the liquid challenge. PLR has been proposed by consensus conference of the European Society of Intensive Care Medicine for a long time and became a useful manoeuvre of predict fluid responsiveness in the high-risk patients.40 41
As to monitoring device, FloTrac/Vigileo system was better recommended in thoracic surgery. It has lower thresholds than the PiCCO system and predicts the insufficiency of blood volume earlier with good sensitivity even if the wave of haemodynamic status remained weak in OLV.27 In addition, it need no calibration and was less affected by arterial compliance and elasticity.42 However, misestimation of blood volume may exist when a rapid wave of CO occurs.43 The PiCCO system can be used only after correction for low-temperature saline, and it is difficult to continuously calibrate the system during surgery in cases of heavy bleeding.44 It was reported that latest version of PiCCO system adapted vascular compliance measurement from every 10 min to every 1 min based on a modification algorithm,45 giving a more accurate result of SVV. Wiesenack et al46 reported a significant correlation between baseline SVV and changes of SVI after updating the algorithm of PiCCO system, which was opposite to their previous negative result. Therefore, the version update of monitoring device may make SVV more and more suitable for difficulty conditions.
Our analysis did not include studies with patients with arrhythmia because it is reported that wide pulse pressure could seriously affect accuracy of SVV.18 Similarly, in patients under shock or patients with heart failure, the diagnostic value of SVV was greatly limited.47 However, Cannesson et al48 reported that a new SVV algorithm using multiparameter signal recognition to reject ectopic beats could work well even in patients with arrhythmia. Heart failure could seriously decrease the ventricular output due to the increasing afterload during inspiration.49 Right ventricular dysfunction would also lead to false positive prediction of preload.50 Interestingly, some studies found that SVV applied in patients with slightly impaired LV function (50%≥EF≥30%) still had good values.10 23 This showed that SVV may have a potential value in predicting fluid responsiveness of patients with mild cardiac dysfunction. Moreover, we found monitoring after main operative manipulation had a better predictive value than that monitoring before that, which may result from partial cure of cardiac dysfunction.
Previous studies have shown that SVV is suitable for laparoscopic surgery in different positions. However, thoracoscopy, different from other endoscopy, creates a continuous intrathoracic pressure, which compresses the mediastinum and contralateral lung, further reducing lung compliance.35 51 Oppositely, opening the chest cavity would increase the aortic impedance and decrease venous return, strongly affecting the correlation between SV and pulse pressure.23 Therefore, SVV correlated closely with the ventricular preload when the pericardium is closed.30 52 Our result also showed supine position is better in thoracic surgery when monitoring SVV. However, the applicability of SVV may be further limited because the lateral position is mostly used in thoracic surgery. Interestingly, Kang et al11 found that SVV also had good diagnostic value during lung recruitment manoeuver. This may prove that SVV was suitable for different time periods in surgery, not just during operative manipulation.
Systolic pressure variation (SPV) and pulse pressure variation (PPV) are also widely used in guiding intraoperative fluid therapy. However, present studies suggested that SVV may be more applicable in patients with high-risk non-cardiac surgery.40 Some studies found correlation coefficients between baseline SVV and ΔSVI were higher than that of PPV and SPV. SVV is derived from the arterial pressure waveform, and relies on the PulseCO algorithm. SPV and PPV are based on absolute measures of arterial waveform analysis, which may not reflect true CO as accurately as former.41
As development of anaesthesiology and surgery, number of patients accepting thoracic and cardiac surgery increased rapidly. Perioperative haemodynamic monitoring combined with GDFT has been demonstrated to usefully reduce mortality and cardiac dysfunction. More and more anaesthetists and surgeons are now aware of the importance of body fluid balance and cardiac perfusion during perioperative period. Despite of this, the reliability of minimally invasive CO monitoring indicator is not widely accepted, and a lack of consensus on monitoring method and device has done little to promote the popularisation of GDFT, especially in undeveloped areas and grass-rooted hospital. There is increasing evidence that fluid therapy should be defined as ‘the right amount of the right type at the right time’, but this is hard to be perfectly performed. When a patient showed hypotension or pallor, it does not imply that this patient blindly needs large bolus of crystalloid or colloid infusion. The specific liquid therapy needs to be reasonably and individually analysed and chosen according to anaesthetic management and surgical manipulation.
The use of SVV monitoring for high-risk surgery was first put forward by the National Institute for Clinical Excellence in the UK in 2012. During recent years, it is obvious that the popularisation of SVV monitoring has been more prompted. However, whether these monitoring device and indicators accurately predict responsiveness of fluid therapy in high-risk patients and when the necessary fluid therapy is required are still not clear. More studies related with SVV in thoracic and cardiac surgery should be conducted.
In view of authors, our study assisted rational decision-making and provided clinical consistency for the patients undergoing high-risk thoracic and cardiac surgery in guiding fluid therapy. SVV in perioperative period of thoracic and cardiac surgery may be justified.
Limitations and strengths
Our meta-analysis has some limitations. First, heterogeneity existed in the overall dataset and in most subgroups, so our conclusion should be interpreted with caution. Second, the best cut-off value of our included articles was too wide, ranging from 3.5 to 13.5. Physicians and anaesthesists should refer to the related articles when choosing the appropriate cut-off value. Third, we did not discuss the effect of vasoactive drugs on SVV because of the lack of relevant data. Fourth, the type of surgery in our included studies was mostly coronary artery surgery, which made our conclusion may not be applicable to all cardiac surgery. Therefore, multicentre and large-sample studies should be performed.
There are also several strengths in our research. First, this is the first diagnostic meta-analysis studying the reliability of SVV in predicting responsiveness to fluid therapy of patients undergoing cardiac and thoracic surgery. Second, most of our included studies are of high quality. Third, we used three different software to compare the predictive value of SVV between subgroups, so our results have a high credibility.
Conclusion
SVV has good predictive performance in patients accepting cardiac surgery in OR and ICU, and has moderate predictive performance in patients accepting thoracic surgery with OLV. Colloid infusion, high TV, and non-PEEP ventilation can effectively improve the accuracy of SVV in both thoracic and cardiac surgery. PLR was more suitable in ICU, whereas fluid challenge is more appropriate in OR. When performing fluid challenge, a large bolus in thoracic surgery and a small bolus in cardiac surgery were the preferred options. Regarding the monitoring device, the FloTrac/Vigileo system was better recommended than the PiCCO system during surgery.
Data availability statement
Data are available in a public, open access repository. Data are available upon reasonable request. All data used in this research was generated from publicly available published manuscripts
Ethics statements
Patient consent for publication
Ethics approval
Not applicable.
Acknowledgments
The authors would like to thank all the researchers of the included articles for their data. We appreciate the help from Wordvice company for revising the language in this manuscript.
References
Supplementary materials
Supplementary Data
This web only file has been produced by the BMJ Publishing Group from an electronic file supplied by the author(s) and has not been edited for content.
Footnotes
Contributors SH and GY conceived and designed the meta-analysis. SH and YJ conducted the database search, screened and extracted data for the meta-analysis and prepared extracted data for the procedures. SH and JD had primary responsibility in writing this article. SH and YJ performed statistical analysis and contributed to article screening, data collection and extraction. SH, YJ, JD, SS and GZ contributed to the data analysis. SS and GZ critically revised the manuscript. GY serves as the guarantor of overall content. All authors contributed towards data analysis, drafting and critically revising the paper and agree to be accountable for all aspects of the work.
Funding The authors have not declared a specific grant for this research from any funding agency in the public, commercial or not-for-profit sectors.
Competing interests None declared.
Patient and public involvement Patients and/or the public were not involved in the design, or conduct, or reporting or dissemination plans of this research.
Provenance and peer review Not commissioned; externally peer reviewed.
Supplemental material This content has been supplied by the author(s). It has not been vetted by BMJ Publishing Group Limited (BMJ) and may not have been peer-reviewed. Any opinions or recommendations discussed are solely those of the author(s) and are not endorsed by BMJ. BMJ disclaims all liability and responsibility arising from any reliance placed on the content. Where the content includes any translated material, BMJ does not warrant the accuracy and reliability of the translations (including but not limited to local regulations, clinical guidelines, terminology, drug names and drug dosages), and is not responsible for any error and/or omissions arising from translation and adaptation or otherwise.